Article Text

Abstract
Introduction Early intervention in type 2 diabetes can prevent exacerbation of insulin resistance. More effective interventions can be implemented by early and precise prediction of the change in glycated haemoglobin A1c (HbA1c). Artificial intelligence (AI), which has been introduced into various medical fields, may be useful in predicting changes in HbA1c. However, the inability to explain the predictive factors has been a problem in the use of deep learning, the leading AI technology. Therefore, we applied a highly interpretable AI method, random forest (RF), to large-scale health check-up data and examined whether there was an advantage over a conventional prediction model.
Research design and methods This study included a cumulative total of 42 908 subjects not receiving treatment for diabetes with an HbA1c <6.5%. The objective variable was the change in HbA1c in the next year. Each prediction model was created with 51 health-check items and part of their change values from the previous year. We used two analytical methods to compare the predictive powers: RF as a new model and multivariate logistic regression (MLR) as a conventional model. We also created models excluding the change values to determine whether it positively affected the predictions. In addition, variable importance was calculated in the RF analysis, and standard regression coefficients were calculated in the MLR analysis to identify the predictors.
Results The RF model showed a higher predictive power for the change in HbA1c than MLR in all models. The RF model including change values showed the highest predictive power. In the RF prediction model, HbA1c, fasting blood glucose, body weight, alkaline phosphatase and platelet count were factors with high predictive power.
Conclusions Correct use of the RF method may enable highly accurate risk prediction for the change in HbA1c and may allow the identification of new diabetes risk predictors.
- diabetes mellitus
Data availability statement
The data used in this study are undisclosed data collected from health check-up recipients at the Yamanashi Koseiren Healthcare Center (Yamanashi, Japan) and are not publicly available. Yamanashi Koseiren Healthcare Center1-1-26, Iida, Kofu, Yamanashi, Japan. Tel: +81 55-237-3630. https://www.y-koseiren.jp/index.html.
This is an open access article distributed in accordance with the Creative Commons Attribution Non Commercial (CC BY-NC 4.0) license, which permits others to distribute, remix, adapt, build upon this work non-commercially, and license their derivative works on different terms, provided the original work is properly cited, appropriate credit is given, any changes made indicated, and the use is non-commercial. See: http://creativecommons.org/licenses/by-nc/4.0/.
Statistics from Altmetric.com
What this paper add
The prediction model based on the Random Forest method was able to predict the change in HbA1c with higher accuracy than that obtained with the regression analysis.
Random forests showed some clinically important predictors that were not shown in the approach by regression analysis.
Our findings suggest that machine learning methods such as the Random Forest method may be effective in detecting type 2 diabetes at a very early stage by predicting future increases in HbA1c.
Introduction
The number of diabetes cases worldwide is estimated at 463 million and is predicted to increase to 700 million by 2045.1 Type 2 diabetes accounts for 90% of all diabetes cases, and three in four cases occur in the working age population.2 Blood glucose and glycated haemoglobin A1c (HbA1c) are often measured at regular medical check-ups, but active guidance and intervention are rarely performed unless the measured values exceed the standard values. It is suggested that insulin resistance increases in type 2 diabetes 10 years before its onset, therefore, early intervention before onset is important.3 For early intervention, it is necessary to build a model that efficiently predicts future increases in HbA1c.
Currently, there are an increasing number of research studies applying artificial intelligence (AI) technologies.4 In the medical field, AI is used in many types of research, such as discovery of new disease phenotypes,5 accurate diagnosis6 and cost-effectiveness prediction.7 In the future, AI is expected to be applicable to a wide range of medical research areas, from public health to molecular biology.8 In the area of public health, it is especially important to predict diseases from existing medical data with high accuracy and to propose appropriate early interventions for each individual.9 An ideal preventive care system with individual intervention may be realised by using AI.
Deep learning10 is a machine learning method representing AI technology that has produced good results with respect to discrimination of pathological images11 and fundus images.12 However, this technology is limited in tracing its predictions back to the key discriminative features (ie, the ‘Black Box Problem’13), and typically requires large amounts of data for analysis.14 On the other hand, the random forest (RF) method, a machine learning method included in AI technology proposed by Breiman,15 can show the importance of variables used in its predictions.16 Recent studies have shown good results in terms of predicting Alzheimer’s disease and identifying predictors with RF.17
Regression analysis is often used in disease risk prediction studies; in particular, logistic regression analysis has been used in the recent study18 to generate models of diabetes risk in Japan. In the present study, we applied the RF method to medical data to investigate the advantages of this method over the existing method. Specifically, we applied the RF method to data obtained from annual health check-ups conducted on residents in Japan. We compared this method with an existing method by creating a model to predict the increase of HbA1c, and we also examined variables that influenced successful predictions with the RF method.
Materials and methods
Study participants
A total of 168 206 data samples from 64 379 people who received annual health check-ups at Yamanashi Koseiren Healthcare Centre (Yamanashi, Japan) during April 1999 to March 2009, were included in this study. This annual check-up was performed based on a legal requirement imposed by the Industrial Safety and Health Act in Japan. With the goal of predicting the diabetes risk in a given year by using the results of the previous two consecutive years, we extracted the data for a total of 44 307 data samples from 13 253 people who had received a health check-up for three consecutive years. (A single person might have received multiple series of three-consecutive-years health check-ups within the 10-year study period. In these contexts, a data sample refers to a single series of three consecutive years health check-up data of a single person; people indicate the total number of the single persons who may have multiple data samples (for details, see online supplemental eMethod S1)
Supplemental material
To ensure sufficient data for analysis, all data samples obtained from the same people were used redundantly in the analyses. People with HbA1c ≥6.5% (48 mmol/mol) or those taking medicines for diabetes in either the first or second year were excluded from the analysis, yielding 42 908 data samples (from 12 977 people). Among these data samples, 32 181 data samples (from 10 408 people, 75% of data samples) were used as training data to develop each prediction model. We used 10 727 data samples (from 8556 people, 25% of analysis data samples) as test data to draw receiver operating characteristic (ROC) curves for each model. We randomly extracted training and test data from all data samples (42 908 data samples from 13 253 people). Hence, there were some data samples derived from the same people across training and test data. Eventually, there were a total of 5987 people who had data samples in both training data and test data (see online supplemental figure S1).
Measurements
In creating the prediction model, the increase in HbA1c was designated as the objective variable, rather than the occurrence of diabetes (HbA1c ≥6.5%). Considering that our model was designed for early disease prevention, we should make the model that can apply to a wider range of people including those with lower HbA1c values. Therefore, we set up the prediction models based on increasing HbA1c values; the objective variables were dichotomised, depending on whether HbA1c increased by ≥0%, ≥0.2%, ≥0.4%, ≥0.6%, ≥0.8% or ≥1.0% after 1 year. These six prediction models were created in each analysis method. (Characteristics of the study participants according to the amount of HbA1c increase can be seen in table 1).
Characteristics of the study participants
We included 97 items of the health check-up that were considered candidate explanatory variables (table 2). The result was expressed as a numerical or categorical value for 51 items and the remaining 46 items described how the characteristic had changed in value from the previous year (items for which a change would be meaningless were not used, such as age and height).
Variables used in random forest method and multiple logistic regression models
RF method
RF is a machine learning method proposed by Breiman15 and is based on the ‘decision tree’ method used for non-parametric classification and regression. The decision tree is a method of classifying data by dividing it according to the value of a specific variable, then repeating this division, such that the divided data group consists of objective variables of the same category.
In the RF method, a decision tree is created using randomly selected variables for a data set extracted by bootstrap sampling, and classification is performed based on the majority of the decisions. In addition, the contribution of each variable to data classification can be determined using the created decision trees, and the importance of each variable can be calculated.19 ROC curves of RF models can be generated by changing the cut-off majority ratio of the involved decision trees. All analyses were conducted using R, V.3.6.1 (R Foundation for Statistical Computing, Vienna, Austria). Before using the RF method, the parameters ntree, the number of decision trees to be used, and mtry, the number of variables used to create the decision tree, need to be defined in advance. Parameters in the RF models were as follows: ntree=1000, mtry=9 (RF model)/7 in variable-restricted RF (vrRF) model; all the other parameters were at default settings, on randomForest package V.4.6–14. The Gini index was used as an impurity function. For the detailed algorithm of the R packages used in this research, refer to a previous study by Biau and Scornet20
Statistical analysis
In order to compare the performance of the machine learning model with the performance of the existing model, and to determine the contribution of the longitudinal data to the prediction accuracy, this study created four prediction models: an RF model, a multivariate logistic regression (MLR) model, a vrRF model and a variable-restricted MLR (vrMLR model. In the RF model, all 97 items were used for prediction as explanatory variables. In the MLR model, stepwise analysis (using both forward and backward search with Akaike information criterion) was performed on 97 items for each of the six types of objective variables (selected explanatory variables in each model are shown in online supplemental table S1). We restricted variables by excluding changes from the previous year and made predictions using 51 variables of a single year in the vrRF model. In the vrMLR model, predictions were restricted to only nine variables (not including the change value) that were used in recent studies of diabetes risk models in Japan.18 As the comparison of the ability of each method to select appropriate variables were included in this study, we did not select variables by taking into account previous studies, expert opinion or correlation coefficients of each variable in any method, except for the vrMLR model.
We constructed ROC curves of the four models, and each model was compared by calculating the area under the curve (AUC) for each ROC curve. In addition, the sensitivity and specificity at the optimum point, defined as the point of maximum value of the difference of the true positive rate and the false positive rate, of each ROC curve were calculated and compared. The variable importance (VI); defined in the prior literature,21 using the caret package on R, in the RF model and the standard regression coefficient (SRC) in the MLR model were also calculated. The 10 most important variables were enumerated in descending order of importance.
Patient and public partnership
This research was done without patient involvement. Patients were not invited to comment on the study design and were not consulted to develop patient-relevant outcomes or interpret the results. Patients were not invited to contribute to the writing or editing of this document for readability or accuracy.
Results
Table 1 shows the descriptive statistics of representative variables associated with HbA1c, categorised according to the amount of HbA1c increase in the following year. An increasing trend in HbA1c was observed in several variables including gender, smoking, weight, body mass index, glutamyl transpeptidase, fasting blood glucose (FBG), HbA1c and systolic blood pressure; a decreasing trend was observed in high density lipoprotein cholesterol.
Table 2 shows the objective variables and explanatory variables used in each model. For the RF method, all 97 variables were used as explanatory variables in all models. For the MLR method, conversely, different variables were adopted as explanatory variables in each model using the stepwise method. (For the explanatory variables selected in each model, please refer to online supplemental table S1).
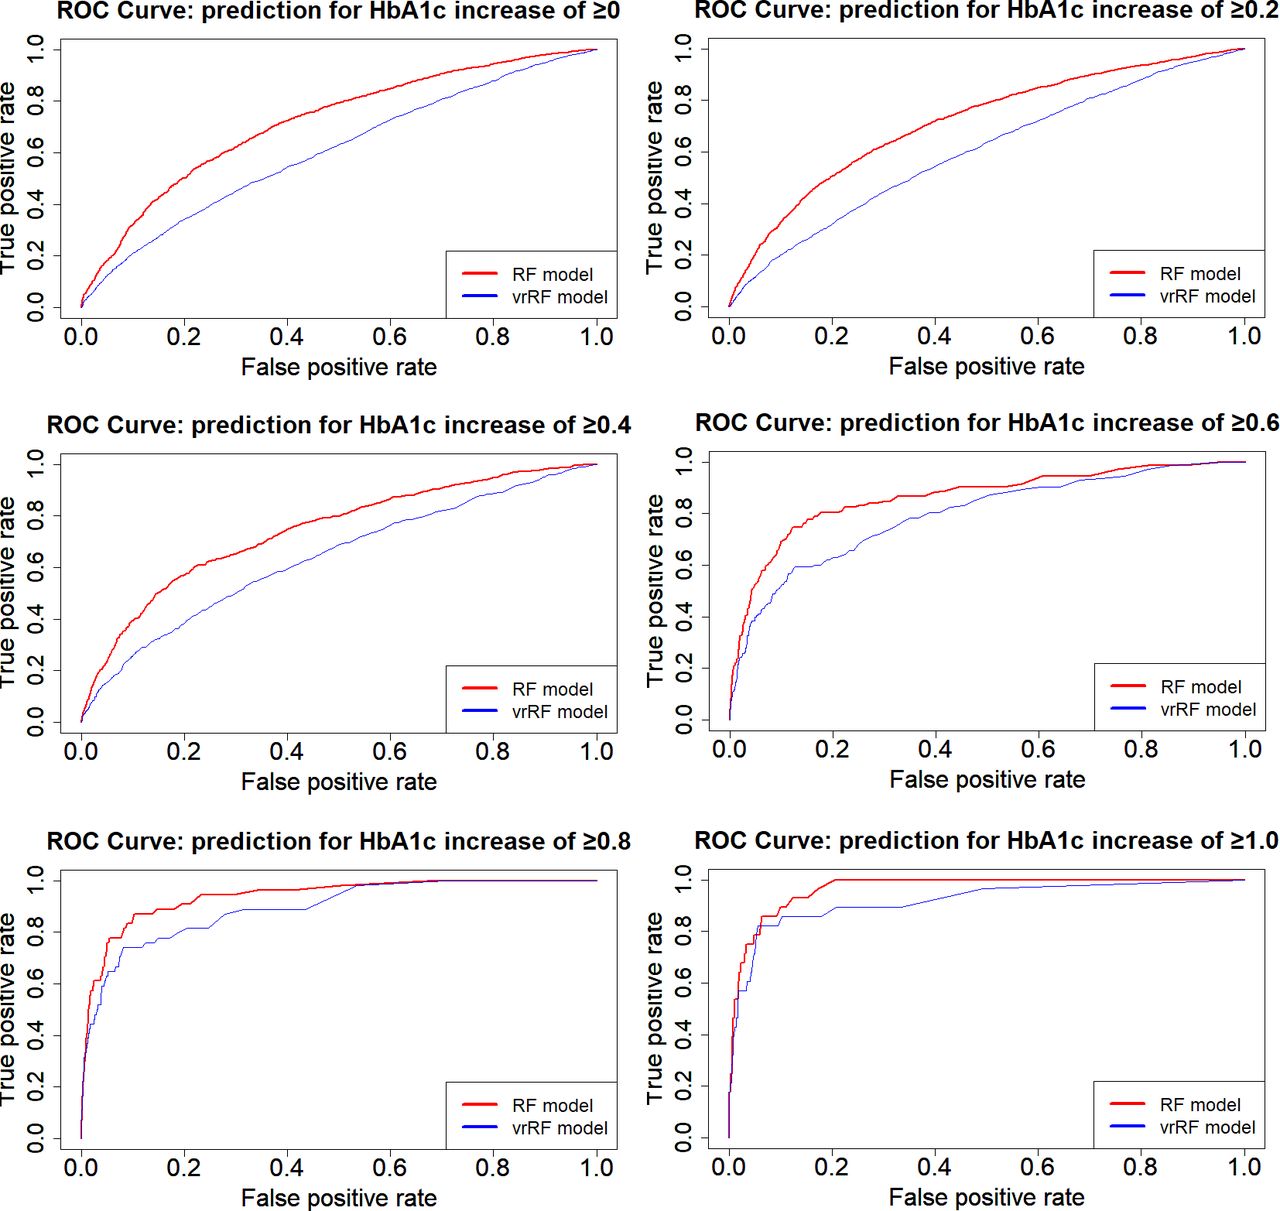
Figure 1 shows the ROC curves for the RF, MLR and vrMLR models and figure 2 shows the ROC curves for the RF and vrRF models according to the increase in HbA1c change value, in order to compare prediction accuracy among models. Notably, the RF model showed the best predictive power among all models. By this comparison, we confirmed how changes from the previous year contribute to the prediction. In these ROC curves, the RF model including the change value showed better prediction power than the vrRF model.
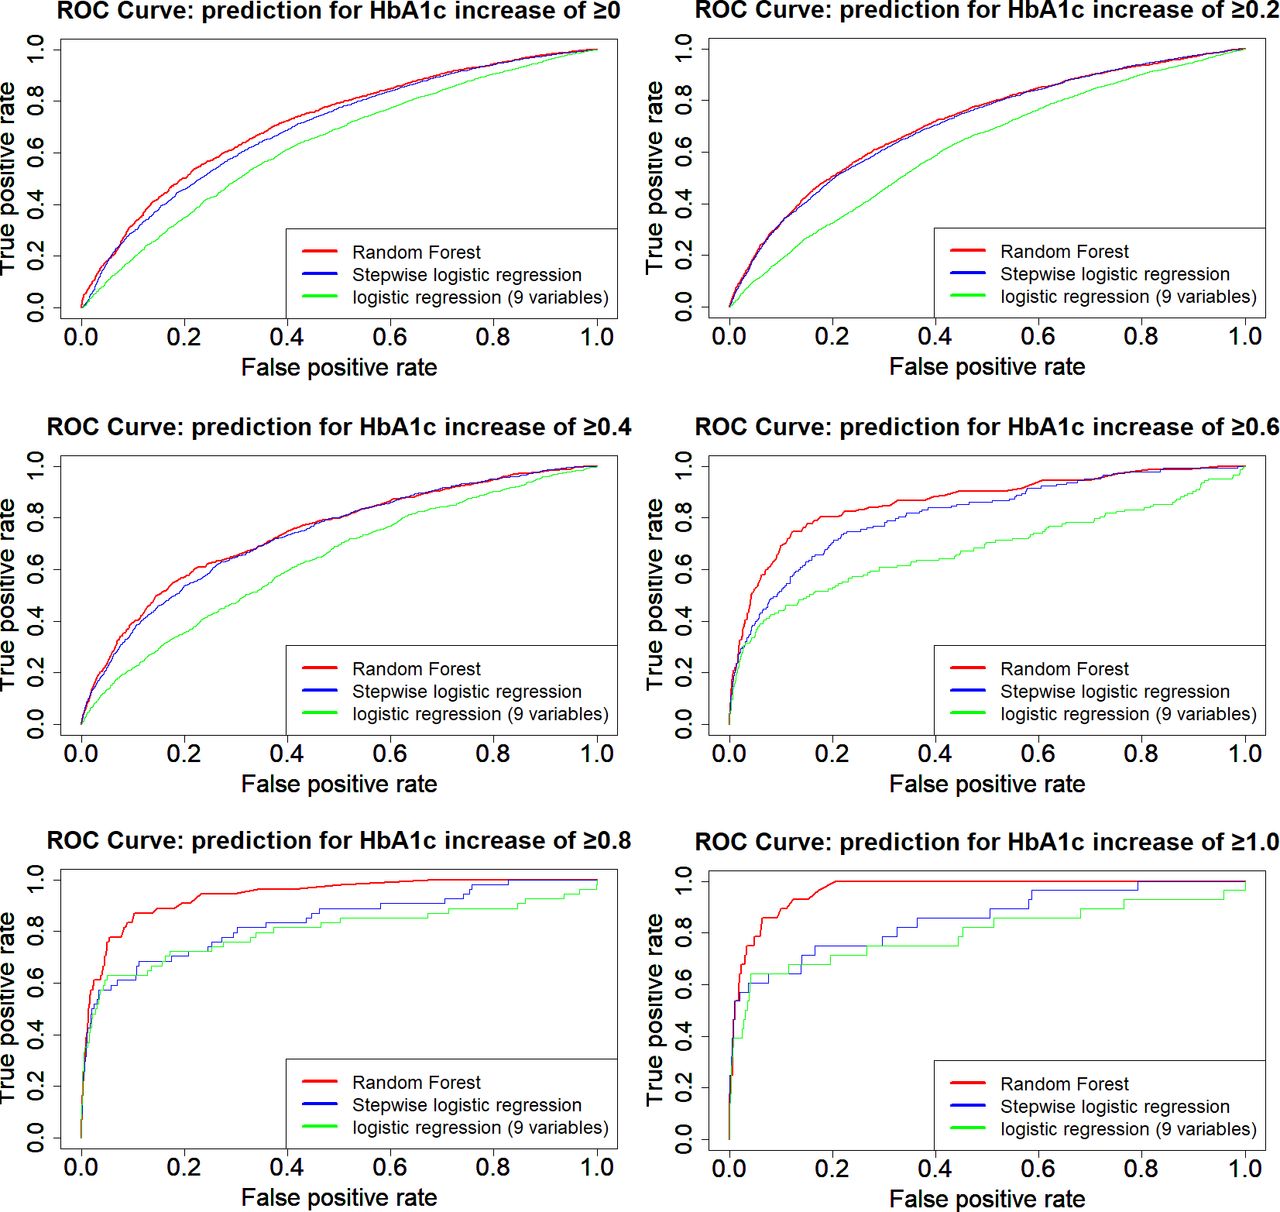
Receiver operating characteristic (ROC) curves showing the prediction performance of select models for changes in HbA1c. ROC curves of Random forest model (red line), multiple logistic regression model (stepwise logistic regression, blue line) and variable restricted multiple logistic regression model (logistic regression with nine variables, green line) are displayed according to the increase in HbA1c change value.
Receiver operating characteristic (ROC) curves showing the prediction performance of select models for changes in HbA1c. ROC curves of random forest model (using two consecutive years of values for prediction, red line) and variable restricted random forest model (using a single year of values for prediction, blue line) are displayed according to the increase in HbA1c change value.
Table 3 shows the AUC for the ROC curve of each model, as well as the sensitivity and specificity at the optimum value on the ROC curve. All RF models had higher AUC than the other three types of models in all categories, and almost all had significant differences at a 5% level with some exceptions: MLR models 2 (p=0.22) and 3 (p=0.31) and the vrRF model 6 (p=0.12).
Sensitivity and specificity of best model and AUC on each ROC curve
Table 4 shows the influence of each variable on HbA1c prediction. We set the degree of most influential variable in each model as 100% (SRC is converted to an absolute value because it can take a negative value). We extracted and compared the top 10 variables that showed the greatest contribution to the prediction using VI for the RF method and SRC for the MLR method. We also calculated the total rank of VI and SRC above all models by averaging the value of VI and SRC through all models.
Variable importance on random forest models and standard partial regression coefficient on multiple logistic regression models
Discussion
In this study, we used a machine learning method, RF, to predict diabetes risk using HbA1c change values, and compared this model with MLR models. The results of this study suggest that RF-based models may have better performance for predicting changes in Hb1Ac than that of MLR-based models (table 3 and figure 1). Further, the RF models based on data of two consecutive years of health check-up may have better performance for predicting changes in HbA1c than that of the model based on data of only 1 year (figure 2). We also revealed that RF models used different factors from MLR models to make predictions (table 4). Therefore, we highlighted the significance of this machine learning method in medical data analyses and presented diabetes predictive factors in a new format.
Many studies predicting disease risk have used regression analysis (ie, MLR or Cox proportional hazards regression). In contrast, the present study used the RF method, which showed better disease prediction accuracy than the existing model (MLR model). Therefore, the RF method may be more appropriate for suggesting predictors of disease risk than existing models under certain circumstances.
In RF models, the increase in HbA1c, HbA1c level, FBG level, the increase in FBG, and weight were selected as the most important variables. HbA1c, FBG, and weight were included in the diabetes risk models of previous studies.18 22 There have also been several previous studies to support the relationship between other items with high VI in the RF models and diabetes. For example, alkaline phosphatase has been suggested to be involved in glucose metabolism with other liver enzymes,23 and platelet consumption have been suggested to increase in patients with diabetes.24 C reactive protein has also been suggested to be strongly associated with the development of diabetes through the activation of adipocytes.25
In the MLR model and in the 0%, 0.4%, 0.6% and 0.8% elevated HbA1c categories (models 1, 3, 4, 5), mean corpuscular haemoglobin (MCH), mean corpuscular volume (MCV) and MCH concentration (MCHC) were selected as the most important variables. In the 1.0% elevated HbA1c category (model 6), haematocrit, haemoglobin, and red cell count concentration were selected as the most important variables. The effect of these anaemia-related factors on HbA1c was supported in a previous study.26
As mentioned above, both methods identified factors that had already been suggested to have associations with diabetes by previous studies. The value of VI in the RF model represents the ability of explanatory variables to clearly discriminate the group of each outcome (in this study, the increase level of HbA1c) by certain threshold level of the variables. Therefore, the VI can be used as a useful metric to identify the groups with exacerbations of type 2 diabetes in the early stages. Additionally, RF can adapt to the data with higher order interactions and non-linear effects, therefore, the VI have the ability to detect important variables for prediction even though there are non-linear relationships or strong interactions between the explanatory variables.27 These properties of the VI may be the possible reasons of different model performance between RF and MLR models in this study.
Given the fact that each method identified different important factors, an approach that uses a variety of analytical methods should be considered when we intend to formulate a prediction model to identify important variables for prediction. For this kind of approach, the RF method is considered one of the appropriate analytical methods. Using the RF method, new disease predictors may be identified, such as more accurate prediction of various cancers, or new predictive factors of such cancers. Thus, the RF method can be regarded as an important analysis method in risk prediction research. However, it is necessary to confirm further applications and precise interpretation of this method.
A strength of this study is that it used several methods to predict the risk of diabetes for a large number of people who completed check-ups in the same facility. In addition, by designating the objective variable as the HbA1c change value, rather than the onset of diabetes, we were able to consider subjects whose HbA1c levels were originally low. Furthermore, we were able to examine which variables were strongly associated with diabetes prediction.
There were some limitations in this study. First, only those who received a medical check-up for three or more consecutive years were included for analysis. People who undergo many medical examinations may be more concerned about being healthy, so this predictive model may present a selection bias towards subjects with higher health consciousness. Second, because the presence or absence of treatment for diabetes was self-reported, those who falsely self-reported their health status may have been included as analysis subjects. These subjects are more likely to have elevated HbA1c because of missed medications, which may affect predictive models. However, it is important to identify these people because they are likely to experience a recurrence of diabetes. Third, we do not know whether the model will apply to other datasets because we did not confirm the external validity of the model created in this study. The model developed in this study can be applied only within the range of the training data and cannot predict outcomes with the values that fall outside the training data. Moreover, the investigation of important predictors revealed by the models could be valid only to the populations similar to that of the training set (Japanese living in the countryside). To confirm external validity, it is necessary to confirm whether similar results are obtained in other health check-up facilities.
Given these limitations, the RF model predicted diabetes risk with significantly greater accuracy than existing models in the present study and identified highly relevant predictors. It is possibly beneficial to the medical field by utilising the RF method used in this research study. In terms of disease prevention, by incorporating the longitudinal data (such as continuous health check-up data) into this method, we can possibly predict the disease risk with higher accuracy than conventional risk models. In terms of disease treatment, we can identify which features of a patient are associated with serious outcomes by applying all data collected at admission to the RF model and comparing the VI on each feature.
However, we do not know whether this methodology will produce similar effects for outcomes other than HbA1c or from different types of datasets. Therefore, it is desirable to identify advantages of the RF method or other types of machine learning methods for diabetes or other disease prediction, through extrapolation to other medical data and validation of the present results.
Data availability statement
The data used in this study are undisclosed data collected from health check-up recipients at the Yamanashi Koseiren Healthcare Center (Yamanashi, Japan) and are not publicly available. Yamanashi Koseiren Healthcare Center1-1-26, Iida, Kofu, Yamanashi, Japan. Tel: +81 55-237-3630. https://www.y-koseiren.jp/index.html.
Ethics statements
Ethics approval
All information used in this study was anonymised and analysed without identification of the individuals involved. The use of anonymised data for research is described on the website of the Yamanashi Koseiren Healthcare Center, and all subjects are given the opportunity to refuse participation in such analyses. This study was approved by the Research Ethics Committee of Faculty of Medicine, University of Yamanashi (receipt number: H30833).
Acknowledgments
This study was conducted in association with the Yamanashi Koseiren Healthcare Center. We are grateful to the staff members of the Yamanashi Koseiren Healthcare Center for careful data cleaning and to the Department of Health Sciences, University of Yamanashi, for careful proofreading of the manuscript.
References
Footnotes
Contributors TO designed the study. TO acquired data and analysed data. TO, HJ, KN and HY interpreted data. TO wrote the first draft of the manuscript. HJ, KN, HY, YY and ZY revised the manuscript critically. All authors have read and approved the final manuscript. TO is the guarantor of this work and, as such, had full access to all the data in the study and takes responsibility for the integrity of the data and the accuracy of the data analysis.
Funding This work was supported by JSPS KAKENHI grant number 19K19433.
Competing interests None declared.
Provenance and peer review Not commissioned; externally peer reviewed by 'Dr. Emmanuel Baah, University of North Carolina System, North Carolina, USA'.
Supplemental material This content has been supplied by the author(s). It has not been vetted by BMJ Publishing Group Limited (BMJ) and may not have been peer-reviewed. Any opinions or recommendations discussed are solely those of the author(s) and are not endorsed by BMJ. BMJ disclaims all liability and responsibility arising from any reliance placed on the content. Where the content includes any translated material, BMJ does not warrant the accuracy and reliability of the translations (including but not limited to local regulations, clinical guidelines, terminology, drug names and drug dosages), and is not responsible for any error and/or omissions arising from translation and adaptation or otherwise.