Article Text

Abstract
Background The importance of addressing malnutrition is increasing in the context of children’s health and their academic performances. Childhood malnutrition further could reduce a country’s economic productivity. No earlier study adequately estimated the causalities between schoolchildren’s malnutrition and their academic performances. How nutritional status contributes to children’s academic performances has never been reported from Madagascar. This study aims to estimate the possible causalities between their nutritional status and academic performances in rural Madagascar.
Methods A cross-sectional household survey was conducted in Antananarivo-Avaradrano district, Madagascar, from November to December 2017, by targeting 404 first and second graders 5–14 years of age enrolled in 10 public primary schools. Children’s anthropometric measurements and structured interviews with their mothers/caregivers were conducted. Children’s academic performances data (mathematical and national language proficiencies) were collected at each school. To estimate associations between their malnutrition and academic performances, bivariate and multivariate analyses were conducted. To estimate their possible causalities between them, three conditions were examined (crude covariational relationship, covariational relationship through controlling for a third variable and temporal precedence).
Results Four independent variables produced significantly positive coefficients with mathematical proficiency in multivariate analysis. Of the four, ‘not being stunted’ and ‘attendance rate’ were estimated to be possible causes of higher mathematical proficiency because they satisfied all the three conditions for a causality. On the other hand, three independent variables produced significantly positive coefficients with national language proficiency in multivariate analysis. Yet, none of them were estimated to be possible causes of higher national language proficiency.
Conclusions A hypothetical causal path indicates that ‘not being stunted’ is likely to have caused higher ‘attendance rate’ and thereby higher ‘mathematical proficiency’ in a two-step manner. This study is the first attempt to estimate the possible causalities between schoolchildren’s nutritional status and their academic performances in Madagascar.
- malnutrition
- nutrition assessment
Data availability statement
Data are available upon reasonable request. Deidentified participant data are available upon reasonable request.
This is an open access article distributed in accordance with the Creative Commons Attribution Non Commercial (CC BY-NC 4.0) license, which permits others to distribute, remix, adapt, build upon this work non-commercially, and license their derivative works on different terms, provided the original work is properly cited, appropriate credit is given, any changes made indicated, and the use is non-commercial. See: http://creativecommons.org/licenses/by-nc/4.0/.
Statistics from Altmetric.com
What this paper adds?
This study successfully estimated ‘possible’ causalities between malnutrition and learning capacities among primary school children, despite employing a cross-sectional study as its study design.
A hypothetical causal path indicates that ‘not being stunted’ is likely to have caused higher ‘attendance rate’ and thereby higher ‘mathematical proficiency’ in a two-step manner.
It is recommended that school feeding program be strengthened for increasing children’s school attendance rate and thereby their mathematical proficiency in Antananarivo-Avaradrano district.
Introduction
Ending hunger and improving nutrition and health continue to be a key global development agenda under the Sustainable Development Goal 2 (SDG 2). Ensuring education and promoting lifelong learning opportunities (SDG 4) serve as an equally important SDG.1 The World Bank emphasises the importance of comprehensively addressing both malnutrition and inadequate learning during childhood to enable each country to have healthier and economically productive populations.2 3 In line with this, Scaling Up Nutrition, a global multisectoral movement on nutrition, expanded its target monitoring groups beyond children under 5 years of age to children 13–15 years of age and older.4 Yet, globally children aged 5–12 years often remain excluded from the monitoring frameworks as if they were a neglected subpopulation,5 6 despite the significant impacts of nutritional status on their health, academic achievements and future socioeconomic productivity.7 It is only UNICEF who started employing prevalence of malnutrition among 5–19 years of age as the standard indicators for its annual publication in 2019.8
The relationship between childhood nutritional status and learning capacities is an old and new research topic. It has been analysed and reported since 1970s9 and recently redrawing global attention from the perspective of future economic productivity.1 2 10 A number of earlier studies attempted to estimate the associations between childhood malnutrition and academic performances.11–16
Yet, a majority of them address the associations between school-age children’s malnutrition and their enrolment in, dropping out from and repeating a grade in schooling.11–15 There are few studies that go beyond it by addressing the associations between malnutrition and school attendance. The level of school attendance serves as the proxy more sensitive to quality and density of their routine learning at schools and home than those of enrolment, dropping out and repeating a grade. The only earlier study that addresses the associations between malnutrition and school attendance employed an ambiguously defined variable of school attendance, that is, a dichotomous variable of whether a student is ‘currently attending’ in school.16 It is not clear whether the study defined ‘currently attending’ as being present at school just on the day of the survey or for a specific number of days during the predesignated period. To precisely estimate the relationship between malnutrition and school attendance, the variable representing attendance must be more clearly and precisely defined, even ideally taking seasonality into account. More importantly, note that all the earlier studies were limited to estimating the associations between school-age children’s malnutrition and their academic performances and that none of them attempted to estimate their causalities. Though intuitively plausible, it is difficult to ascertain or quantify the causalities between children’s nutritional status and their academic performances.17 Hence, there is a clear need for attempting to estimating causalities between children’s nutritional status and their academic performances without focusing only on their associations.
For over 20 years, Madagascar has been challenged by consistently higher prevalence of stunting among children under 5 years of age for decades. The latest data (49% as of 2018) are the fifth highest in the world.8 To address the country’s long-lasting high malnutrition prevalence, the government of Madagascar increasingly focuses on multisectoral coordination for greater coverage and impacts of the national nutrition programme by launching the third National Nutrition Action Plan (PNAN III). PNAN III calls for multisectoral interventions also for school-age children, for example, community-based deworming, school feeding, household food security and crop diversification.18 Yet, it was not until 2017 that the first nutrition study targeting school-age children was conducted in Madagascar. The study reported the malnutrition prevalence among school-age children and the risk factors for being stunted, underweight and thin.5 This study attempts to explore possible causalities between schoolchildren’s nutritional status and their academic performances by assessing whether and how nutritional status contributes to their school attendance and further to learning capacities in rural Madagascar.
Methods
A cross-sectional survey was conducted to estimate the association between malnutrition (ie, stunting, underweight, thinness and overweight) among schoolchildren and their academic performances (school attendance and learning capacities) in Antananarivo-Avaradrano district, Analamanga region, Madagascar.
Study area and target group
Antananarivo-Avaradrano district is a typical mountainous area located in central inland Madagascar, where temperature is relatively stable all year round (minimum 10°C to maximum 27°C). Eighty-one per cent of populations of the district live in rural area. All the 10 public primary schools having been considering improving school feeding programme in the district were selected as the target recruitment points (ie, Ambohimarina, Ambohitrarahaba, Ambohitsoa, Ambovona, Ankadinandriana, Isahafa, Ikianja, Soavinandriamanitra, Tsarahasina and Viliahazo primary schools). Students’ academic performance data were readily accessible at those schools. This was key to enabling us to identify their associations with students’ nutritional status. Of all children enrolled in the 10 schools, exclusively first and second graders were targeted in this study for two reasons. First, targeting first and second graders would help minimise the number of dropouts at the postintervention stage. They will be more contactable at the time of postintervention survey to be conducted 4–5 years later. They are more likely to stay enrolled in the same schools without going on to secondary schools or getting a job elsewhere. Second, a great majority of first and second graders were children 5–14 years of age, for whom AnthroPlus (a WHO’s software) can calculate z-scores for height for age and body mass index (BMI) for age.19
Sample size and sampling methods
National prevalence of stunting among children under 5 years of age has been around 50% for decades.20 Therefore, we assumed that its prevalence among first and second graders could be 50%, under which sample size becomes the greatest (ie, sufficient sample size also for estimating prevalence rates of underweight, thinness, overweight and obesity). The sample size was calculated with α (error)=0.05 and d (precision)=0.05. Thus, 384 schoolchildren were determined as the required sample size. Assuming 5% of non-response rate,21 404 children were employed as the final sample size. To ensure equal representativity of children in each stratum (school, grade and sex), probability proportional to size approach was applied. A total of 404 first and second graders aged 5–14 years were randomly selected from the respective strata using student registries of the 10 primary schools.
Data collection
Data collection was conducted during the period from 20 November to 11 December 2017, early rainy season in Madagascar. Anthropometric measurements of sampled first and second graders and subsequent structured interviews with their parents were conducted. Weights of the children were measured to the nearest 0.1 kg using the electronic scale for mother/child 150 kg × 100 g (UNICEF reference model: S0141021). Heights were measured to the nearest 0.1 cm using the UNICEF standard height scale. Two repeated household visits were made when target children and mothers (or other caregivers) were either absent or not available on the initial visits. When they were totally unavailable despite three visits, a substitute schoolchild was selected by mechanically sampling the next eligible child in student registries. The data of birth dates and academic performances of the selected children were collected from student registries and academic records, respectively, at the target primary schools.
Data analysis
The data collected in the household survey were analysed by using AnthroPlus (WHO, Geneva) for calculation of z-scores for height for age, weight for age and BMI for age,19 and SPSS for Windows V.22 (IBM/SPSS) for all the other statistical analyses.
The causal model between malnutrition and learning capacities this study hypothesised was composed of two steps, that is, first step: ‘malnourished students are likely to more poorly attend schools’, and second step: ‘poorly attending students are likely to have poorer learning capacities’ (figure 1).
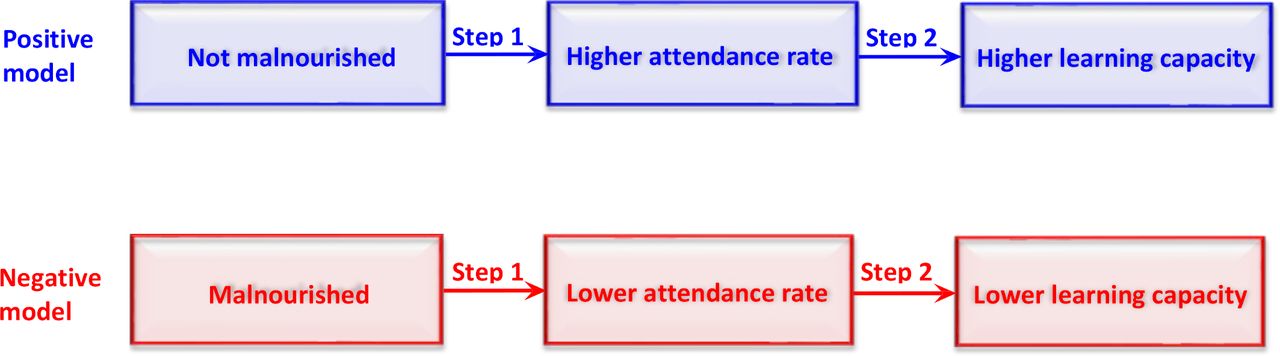
Causal models between malnutrition and learning capacities.
First, with the two steps in mind (figure 1), we examined bivariate associations between children’s nutritional status and their attendance and further between their attendance and learning capacities. To examine the bivariate associations between children’s nutritional status and their attendance rates, Mann-Whitney U test was undertaken. This is because the results of Levene’s test indicated that attendance rate was not normally distributed. In this study, attendance rate was defined as the proportion of the number of schooldays on which a given student fully attended to the total number of schooldays in academic year 2017 as of the data collection day. At the time of conducting the survey, only about a month had passed since the academic year 2017 started. Thus, the rate indicates each student’s attendance status not on a year-round basis but during the initial 1 month only. Yet, it is likely to appropriately represent the children’s and their parents’ updated behaviours towards the new school year. Then, to examine bivariate associations between children’s attendance rates and their learning capacities, Spearman’s correlation coefficients (Spearman’s rho) were employed. This is because learning capacities of two subjects (ie, mathematical and national language proficiencies) are ordinal variables whose data were recorded in a 5-point scale, while attendance rate is an interval ratio variable.
Second, to identify the child-specific determinants of learning capacities of each subject, ordinal regression was performed by employing learning capacities as the dependent variable and its background variables as the independent variables. The background variables were composed of four types of variables in an appropriately balanced manner22: (1) academic variables (attendance rate and grade); (2) nutrition and food security variables (stunting, underweight, thinness, overweight, meal frequency and Household Dietary Diversity Score); (3) sociodemographic variables (ie, gender, age, household size and mother’s/caregiver’s education attainment); and (4) socioeconomic variables (household’s ownerships of land and mobile phone, and major source of household’s income). For all the categorical or ordinal variables to be employed as the independent variables composed of three or more categories (‘Major income sources’, ‘Education attainment of mother or caregiver’), dummy variables were created as the independent variables for ordinal regressions. The category with the greatest frequency was designated as the reference for the dummy variables. Moreover, prior to applying them to ordinal regressions, the multicollinearity between those possible independent variables was examined by assessing Spearman’s correlation coefficient (Spearman’s rho: rs). When |rs|>0.4 with P<0.05 was detected between two independent variables, one of the two variables was excluded from the independent variables to be entered into an ordinal regression model.
Third, nutritional status variables producing significant associations with learning capacities in ordinal regressions, if any, were further assessed on their possible causalities with mathematical and national language proficiencies. To detect a causality between two variables, generally three conditions need to be satisfied as minimum requirement, that is, crude covariational relationship, covariational relationship through controlling for a third variable and temporal precedence.23 In this study, we assumed a possible causality exists between two variables, only when all these three conditions were satisfied.
Results
Of 404 sampled first and second graders aged 5–14 years, 11 did not participate in the study due to refusal or absence. Thus, 399 children participated in the study. It was found that another 11 of the 393 children were over 120.8 months of age (ie, 10.07 years of age). They were excluded from analyses related to underweight, since AnthroPlus allows z-scores for weight for age to be calculated exclusively for children up to 120.8 months of age.19
Table 1 shows the characteristics of children having participated in the study and their malnutrition prevalence and academic performances.19 24 The overall prevalence rates of stunting, underweight, thinness and overweight were 34.9% (95% CI 30.2% to 39.8%), 38.0% (95% CI 33.1% to 43.0%), 11.2% (95% CI 8.3% to 14.7%) and 1.0% (95% CI 0.3% to 2.6%), respectively (table 1). There was no case of obesity (z-score for BMI for age >2).
Characteristics of sampled schoolchildren 5–14 years of age, their malnutrition prevalence, and learning capacities
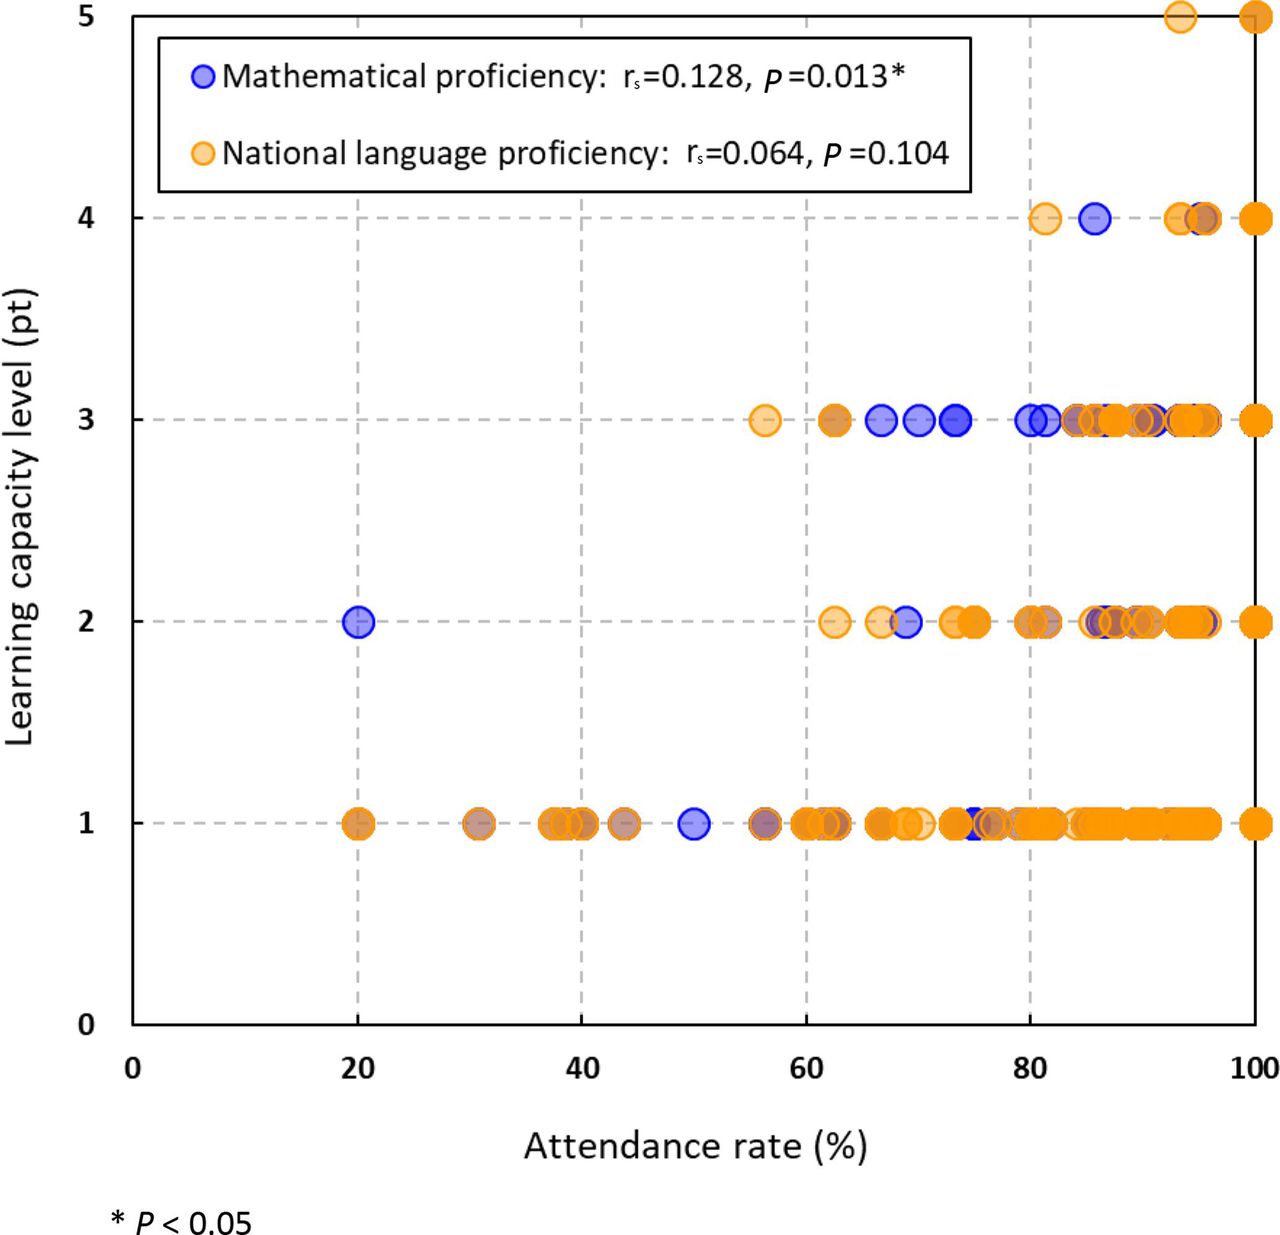
Figure 2 shows the results of bivariate analyses between children’s nutritional status and their attendance rates. School attendance rates among children not being stunted and among those not being underweight were significantly higher than among those being stunted (p=0.003) and among those being underweight (p=0.005), respectively. Yet, no significant difference was identified in attendance rates between those being thin and not being thin and between those being overweight and not being overweight. Figure 3 shows the results of bivariate analyses between children’s attendance rates and their learning capacities in the two subjects (ie, mathematics and national language). A significantly positive association was detected between attendance rate and mathematical proficiency (rs=0.128; P=0.0013). Similarly, a slightly positive association was detected between attendance rate and national language proficiency, yet it was not statistically significant (rs=0.064; P=0.104).
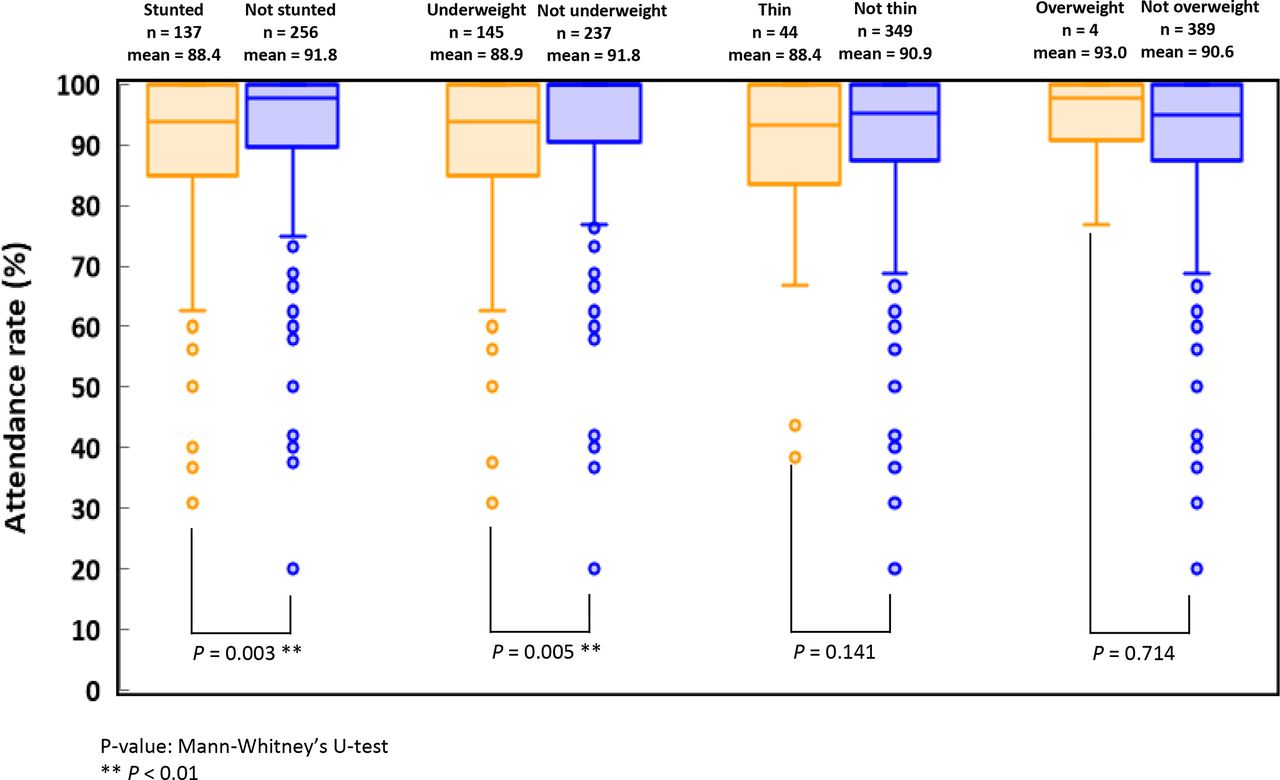
Comparison of attendance rate between malnutrition and not malnutrition schoolchildren 5–14 years of age.

Association between attendance rate and learning capacities among schoolchildren 5–14 years of age (n=393).
The bivariate associations shown in figures 2 and 3 were assessed without controlling possible confounders. Therefore, ordinal regressions were further performed as multivariate analyses by employing learning capacities as their dependent variables. Table 2 shows the results of the ordinal regressions on mathematical proficiency and on national language proficiency. In the ordinal regression on mathematical proficiency, four independent variables produced significantly positive coefficients (P<0.05), that is, ‘Attendance rate’, ‘Not being stunted’, ‘Age’ and ‘Selling, trading and commerce as major income source’. In the ordinal regression on national language proficiency, three independent variables produced significantly positive coefficients (P<0.05), that is, ‘Attendance rate’, ‘Not being thin’ and ‘Age’.
Ordinal regressions on subject proficiencies with background variables
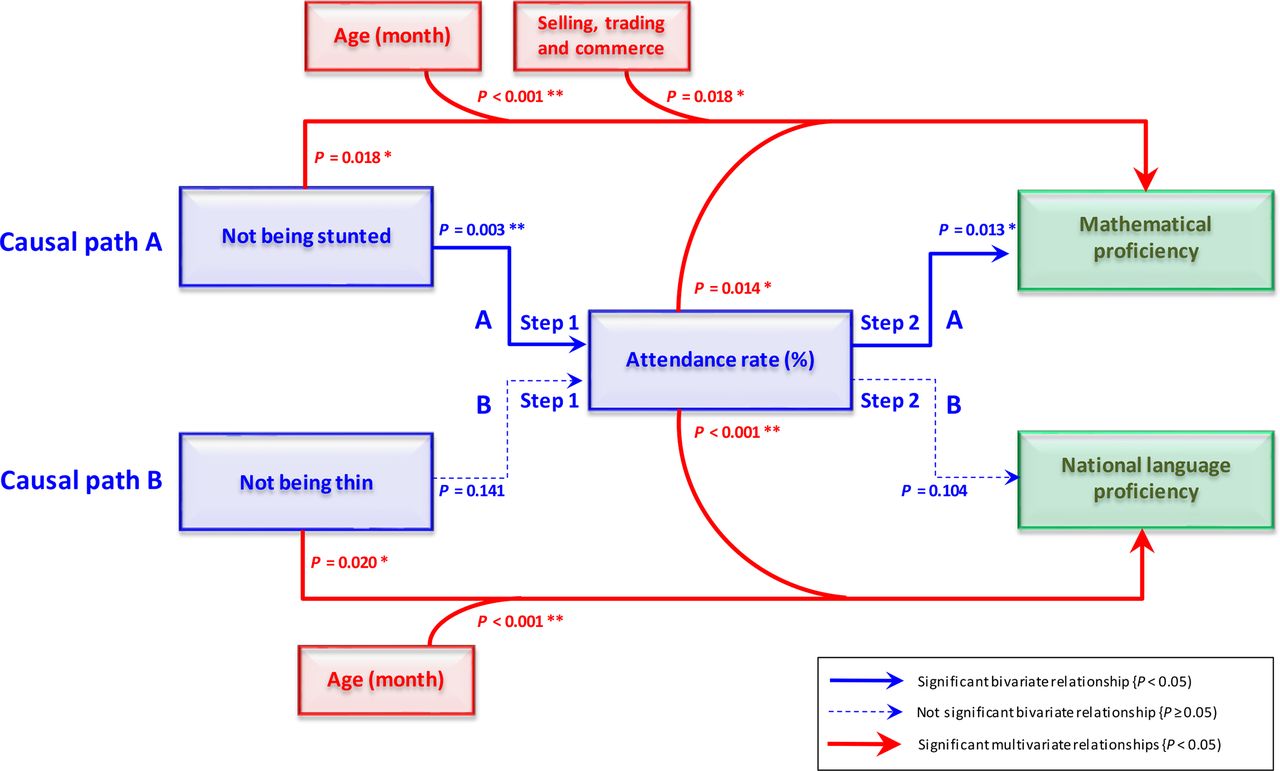
Of the four independent variables having produced significant coefficient estimates in the ordinal regression on mathematical proficiency (table 2), ‘not being stunted’ and ‘attendance rate’ are the variables that compose the causal model between malnutrition and learning capacities (figure 1). Thus, they are likely to have logically caused higher mathematical proficiency. Therefore, the causalities between not being stunted and attendance rate, and further between attendance rate and mathematical proficiency were examined. As shown in ‘Causal path A’ of figure 4, it is assumed that ‘not being stunted’ is one of the causes of higher ‘attendance rate’, and higher ‘attendance rate’ is further one of the causes of higher ‘mathematical proficiency’. This is because all the three conditions for a causality (crude covariational relationship, covariational relationship through controlling for a third variable and temporal precedence) were satisfied (table 3).5 8 25 Similarly, we assessed causalities between not being thin and attendance rate, and further between attendance rate and national language proficiency were examined. Since parts of three conditions were not satisfied, possible causality in ‘Causal path B’ was not detected (table 3).25
Possible causalities between malnutrition and learning capacities

Hypothetical causal paths between malnutrition and learning capacities.
Discussion
The results of the ordinal regression on mathematical proficiency (table 2) indicate that a child not being stunted is 1.86 times more likely (=exp[0.620]) to achieve higher level of mathematical proficiency. It was also found that 1% increase in attendance rate would lead to slightly higher proficiency in mathematics, that is, 1.027 (=exp[0.027]) times higher.
In addition to the aforementioned associations, possible causalities between ‘not being stunted’ and ‘attendance rate’, and between ‘attendance rate’ and ‘mathematical proficiency’ were detected (table 3). Figure 4 presents hypothetical causal paths between malnutrition and learning capacities based on these findings. It is assumed that ‘not being stunted’ is likely to have led to higher ‘mathematical proficiency’ in a two-step manner through syllogism (Causal path A in table 3 and figure 4). Similar possible causalities were not detected between other three types of non-malnutrition (ie, not being underweight, thinness and overweight) and learning capacities. First, ‘not being underweight’ was unable to be assessed on its causalities with learning capacities because it was excluded from the ordinal regression model due to multicollinearity with ‘not being stunted’. Second, causality was not detected between ‘not being thin’ and ‘national language proficiency’ (Causal path B in table 3 and figure 4), though it produced a significantly positive coefficient estimate in the ordinal regression model (table 2). Third, there is no room for possible causality between ‘not being overweight’ and learning capacities, since it was associated neither with mathematical proficiency nor with national language proficiency in the ordinal regression (table 2).
Earlier studies in Ethiopia, Sri Lanka and Uganda reported that being stunted was negatively associated with mathematical proficiency of primary schoolchildren.26–28 The results of our study support this trend. Yet, our study found that being stunted was significantly associated exclusively with poorer mathematical proficiency, while two earlier studies detected the similar associations with both mathematical and national language proficiencies27 28 or exclusively with national language proficiency.29 Thus, the type of subjects whose proficiencies are associated with being stunted differs between the schoolchildren settings and contexts (eg, countries, grades and age). An earlier study in Chile reported that being overweight was not associated with poorer mathematical and national language proficiencies.30 Our study did not find the association between being overweight and academic performance either, despite its plausibility.
Evidence suggests that stunting is generally irreversible after the first 1000 days from conception (ie, up to 2 years of age)31 32 despite its slight possibilities reported by several earlier studies.33 34 Therefore, step 1 in Causal path A (figure 4) would not be able to be effectively and efficiently addressed during school age. Yet, there should be other channels which lead to the increase in school attendance rate and thereby mathematical proficiency. A number of earlier studies reported school feeding programmes are likely to have increased attendance rate and further mathematical proficiency.35–38 Currently, 10 primary schools this study targeted implement school feeding programme.5 Yet, frequencies of school lunch provisions at those schools are limited only to 1 or 2 days a week primarily during food insecure seasons. Therefore, strengthening school feeding programme would be an effective intervention towards higher attendance rate and thereby higher mathematical proficiency.
‘Age’ was the variable producing a significantly positive coefficient estimate commonly with mathematical and national language proficiencies (figure 4). In the 10 primary schools, the levels of both mathematical and national language proficiencies are defined based not on grade-specific learning targets but on overall learning targets for the entire 6-year primary education (table 1). Therefore, a greater proportion of older children participating in the study tend to attend mathematics and national language classes for second graders. In fact, ‘age’ and ‘grade’ are positively correlated with significance (rs=0.610; p<0.001). Probably, for this reason, ‘age’ was significantly associated with both mathematical and national language proficiencies in the ordinal regression models.
It is difficult to interpret the significant association between mathematical proficiency and ‘selling, trading and commerce’ as the major household income source. Needless to say, those practising petty selling, trading and commerce should be competent enough in basic arithmetic for daily cash transactions. Most likely part of those from the households whose greatest income source is ‘selling, trading and commerce’ sometimes are either taught mathematics at home or relatively strongly advised to study mathematics at school, by their parents. This is one of the possible interpretations of this result of the ordinal regression on mathematical proficiency. Yet, we are unable to further deepen the discussion on this result, since we could identify no earlier studies on this topic.
Some may say such a cross-sectional study as this cannot identify causalities. Yet, this study successfully estimated at least ‘possible’ causalities between malnutrition and learning capacities. There are two major reasons for the successful estimation. First, both crude covariational relationship and covariational relationship through controlling third variables were systematically undertaken by using bivariate and multivariate analyses. Second, temporal precedence between step 1 and step 2 of the causal model (figure 1) was self-evidenced enough. For instance, generally children become stunted when they are 2 years of age or younger25 31 32 and schoolchildren physically cannot take examinations without attending schools (table 3).
There are two types of limitations in this study. First, this study may have the limitations in reliability and generalisability of the causalities between malnutrition and learning capacities due to its study design (ie, cross-sectional study). To increase the reliability of Causal path A in figure 4, data should be longitudinally collected from schoolchildren in a time series manner when conducting future studies. As the data were collected in relatively food secure season (ie, November to December),39 there were some risks of underestimation of malnutrition prevalence (particularly thinness, proxy for acute undernutrition) and food security situation. To explore more generalisable causalities in view of volatility of local food security situation, a follow-up survey should be longitudinally conducted by targeting the children having participated in this study during less food secure season. Second, this study has the limitations in presenting the length of the lags between being not stunted and increased attendance rate and between increased attendance rate and higher mathematical proficiency. Also to appropriately estimate the lengths of the lags, a longitudinal study needs to be conducted. Third, this study did not employ children’s IQ scores as the variable for bivariate and multivariate analyses. Thus, schoolchildren’s congenital intellectual abilities to be approximated largely by IQ should be considered and addressed in the future studies.
Conclusions and recommendations
This study identified ‘not being stunted’ and ‘attendance rate’ as the determinants or predictors of ‘mathematical proficiency’ and as possible causes of higher ‘mathematical proficiency’. While admitting need and room for improvement of study design, note that this is the first study that reports possible nutrition-related causalities of learning capacities among primary schoolchildren in Madagascar.
Malnutrition, in particular stunting, has been drawing global attention due to its determinativeness in cognitive performances during preschool40 and later academic performances during primary education.41 42Recently, the World Bank has been highlighting a need for addressing malnutrition among school-age children as a foundational investment each country should make by launching the Human Capital Measurement Project.2 3 43 Thus, a global momentum is being created towards generation of evidence on malnutrition among school-age children. In this context, further studies should be conducted to more precisely identify not just associations but causalities between malnutrition and academic performances. That will help health and education stakeholders more effectively collaborate for addressing malnutrition among schoolchildren in relation to their academic performances in all countries suffering from greater malnutrition prevalence.
It is recommended that the following actions be taken in view of the implications and significance of the results of this study.
Strengthen the existing school feeding programme so as to ensure more frequent and sustainable provision of school lunch. All the 10 primary schools this study targeted are currently attempting to introduce a community-based school feeding programme. Thus, design and strategic planning of the programme should be strengthened by proactively promoting the use of locally produced, procured and donated foods, for instance, through readily functioning school management committees.
Regularly, measure at least height of children at each primary school. Though height scale to be used for nutrition survey is generally expensive (US$150–US$300),44 a simple height scale can be handmade on wall in or out of a classroom by setting graduation scale every 1 or 5 mm. Plotting a dot on growth chart will serve as an invaluable opportunity to better equip students with understanding and skills on two-dimensional axes (an essential part of mathematics). Regular monitoring of height of children will also provide each school with opportunities to increase awareness of growth monitoring as an essential part of school health.
Supplemental material
Supplemental material
Supplemental material
Supplemental material
Data availability statement
Data are available upon reasonable request. Deidentified participant data are available upon reasonable request.
Ethics statements
Ethics approval
The study protocol was submitted to the National Committee for Biomedical Research Ethics, the Malagasy Ministry of Health, for its ethical clearance. The Committee officially approved the study protocol by exempting it from an ethical clearance process due to low-level invasiveness of the study design (Exemption letter No 52). An advanced informed consent to participate in both anthropometric measurements and structured household interviews was obtained in written form from the parents of sampled children. In addition, an additional verbal informed consent to participate in the study was further obtained from the parents upon the household visit for a structured interview, in case they might change their minds about participation in the study.
Acknowledgments
The authors gratefully thank Vonjy Nirina Andrianome for her overall support to this study. The authors are grateful to Masahiro Hara, Toshiyasu Murai and Nobuhiro Kunieda for their valuable technical support. The authors further thank Japan International Cooperation Agency (JICA) for its funding support to the study. This work is sincerely dedicated to all the school-age children, their parents and caregivers, and teaching staff of primary schools in rural areas of Madagascar. This study was conducted as a part of the JICA technical cooperation 'Project for Participatory and Decentralized School Management Support'.
References
Supplementary materials
Supplementary Data
This web only file has been produced by the BMJ Publishing Group from an electronic file supplied by the author(s) and has not been edited for content.
Footnotes
Contributors All the authors made substantial intellectual contributions to the study. HA and KA conceptualised and designed the study. ER, HA, KA and ARR collected the data. HA analysed and interpreted the data. HA drafted and finalised the manuscript. KA, ER and ARR critically commented on and revised the manuscript. The authors took full and final responsibility for submitting this article for publication. All the authors reviewed and approved the final version of the manuscript.
Funding This work was supported by Japan International Cooperation Agency (JICA).
Map disclaimer JICA agreed on the study design but played no roles in data collection, data analysis and interpretation of the results.
Competing interests None declared.
Provenance and peer review Not commissioned; externally peer reviewed.
Supplemental material This content has been supplied by the author(s). It has not been vetted by BMJ Publishing Group Limited (BMJ) and may not have been peer-reviewed. Any opinions or recommendations discussed are solely those of the author(s) and are not endorsed by BMJ. BMJ disclaims all liability and responsibility arising from any reliance placed on the content. Where the content includes any translated material, BMJ does not warrant the accuracy and reliability of the translations (including but not limited to local regulations, clinical guidelines, terminology, drug names and drug dosages), and is not responsible for any error and/or omissions arising from translation and adaptation or otherwise.