Article Text

Abstract
Background The potential of adopting a healthy lifestyle to fight non-communicable diseases (NCDs) is not fully used. We hypothesised that the Healthy Lifestyle Community Programme (HLCP, cohort 1) reduces weight and other risk markers compared with baseline and control.
Methods 24-month, non-randomised, controlled intervention trial. Intervention: intensive 8-week phase with seminars, workshops and coaching focusing on a healthy lifestyle (eg, plant-based diet, physical activity, stress management) and group support followed by a 22-month alumni phase. Weight reduction as the primary outcome and other NCD risk parameters were assessed at six time points. Participants were recruited from the general population. Multiple linear regression analyses were conducted.
Results 143 participants (58±12 years, 71% female) were enrolled (91 in the intervention (IG) and 52 in the control group (CG)). Groups’ baseline characteristics were comparable, except participants of IG were younger, more often females, overweight and reported lower energy intake (kcal/day). Weight significantly decreased in IG at all follow-ups by −1.5 ± 1.9 kg after 8 weeks to −1.9 ± 4.0 kg after 24 months and more than in CG (except after 24 months). Being male, in the IG or overweight at baseline and having a university degree predicted more weight loss. After the intervention, there were more participants in the IG with a ‘high’ adherence (+12%) to plant-based food patterns. The change of other risk parameters was most distinct after 8 weeks and in people at elevated risk. Diabetes-related risk parameters did not improve.
Conclusion The HLCP was able to reduce weight and to improve aspects of the NCD risk profile. Weight loss in the IG was moderate but maintained for 24 months. Participants of lower educational status might benefit from even more practical units. Future interventions should aim to include more participants at higher risk.
Trial registration number DRKS00018821.
- weight management
- lipid lowering
- dietary patterns
- blood pressure lowering
- preventive counselling
Data availability statement
Data are available on reasonable request.
This is an open access article distributed in accordance with the Creative Commons Attribution Non Commercial (CC BY-NC 4.0) license, which permits others to distribute, remix, adapt, build upon this work non-commercially, and license their derivative works on different terms, provided the original work is properly cited, appropriate credit is given, any changes made indicated, and the use is non-commercial. See: http://creativecommons.org/licenses/by-nc/4.0/.
Statistics from Altmetric.com
What this paper adds
Insights in the effects of comprehensive lifestyle programs as measures to prevent and treat noncommunicable diseases.
Overview of the design and methodology of real-world community approaches.
Discussion about target group-specific content of lifestyle educational programs.
Background
Avoiding obesity woul protect people from losing disease-free years owing to lifestyle-related non-communicable diseases (NCDs), like cardiovascular diseases and type 2 diabetes.1 Moreover, the COVID-19 pandemic has highlighted that NCDs are also a risk factor for a serious course of infectious diseases2 and can therefore be an immense burden to personal and public health. However, the immense potential of a healthy lifestyle to prevent, arrest or even reverse NCDs1 3–5 is still not fully embraced by patients and healthcare providers.
There is general consensus how a healthy lifestyle is characterised: (1) A more plant-based diet,4 5 (2) regular exercise6 and (3) managing stress.7 8 Yet, neither are most people aware how big their own behaviours and choices influence risk, nor are they adequately educated how to change their lifestyle accordingly.9 This is especially true for men and people of low socio-economic status, who typically have a lower level of health literacy, that is, they lack knowledge and resources to promote their own health and attend health education programmes less frequently.10–12
Though lifestyle interventions do report improvement of overweight (OW) and other risk parameters,13 effects are heterogeneous.14 Lifestyle interventions that meet the complexity of sustainable behavioural change and, at the same time, reduce complexity for participants wherever possible, are urgently needed.15 As real-world lab approaches intend to cocreate interventions with local stakeholders and overcome the artificiality of the lab setting,16 they seem suitable to transfer evidence-based knowledge and skills about a healthy lifestyle from science to society.
Research objective
This study examined if the Healthy Lifestyle Community Programme (HLCP, cohort 1) was able to improve the metabolic risk profile of NCDs in the long-term through the adoption of health behaviour and lifestyle changes.
Our primary hypothesis was that participants of the intervention group (IG) would reduce their weight significantly after 8 weeks, and again at 6, 12, 18 and 24 months compared with baseline and significantly more than participants of the control group (CG). We secondarily hypothesised that in the IG important risk markers for NCDs, that is, waist circumference (WC), blood parameters (total, low-density lipoprotein and high-density lipoprotein cholesterol (total-C, LDL-C, HDL-C), triglycerides (TG), fasting glucose (FG), glycated haemoglobin A1c (HbA1c), fasting insulin (FI), insulin sensitivity via Homeostasis Model Assessment-insulin resistance (HOMA-IR)) and vital parameters (systolic and diastolic blood pressure (SBP, DBP)) would improve after 8 weeks, and again after 6, 12, 18 and 24 months compared with baseline and more than CG.
Methods
Study design
We conducted a non-randomised, controlled intervention trial with a duration of 24 months (see figure 1). As with all lifestyle interventions, blinding of participants or instructors was not possible (as described previously17). Staff performing laboratory assessments were unaware of group allocation.
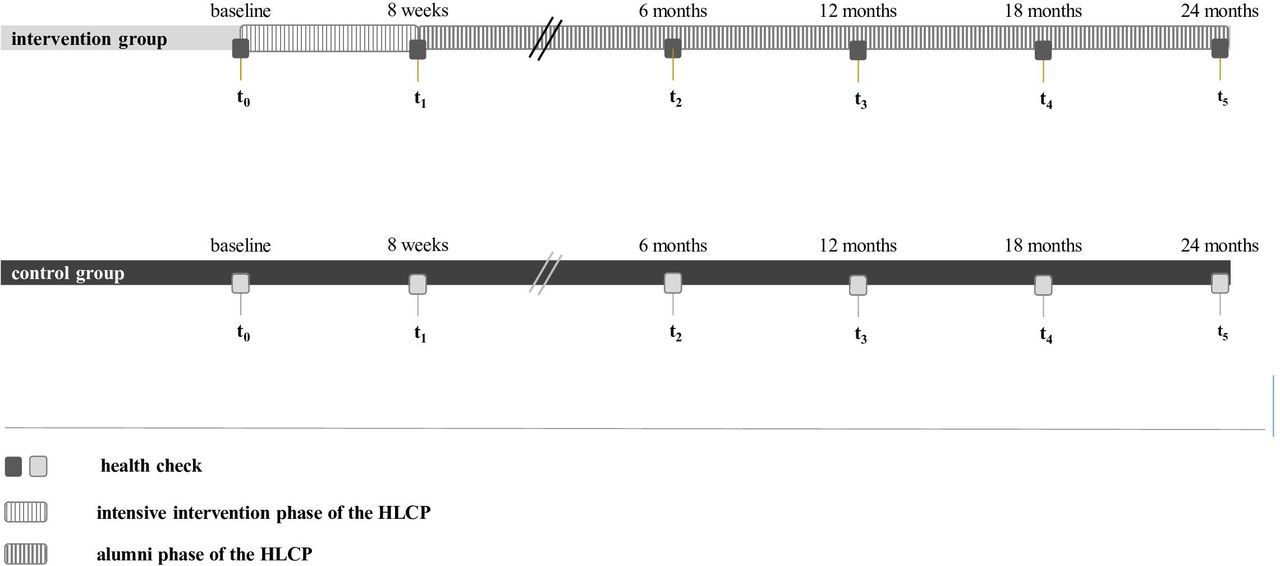
Study design; data collection at six health checks: T0 (baseline), T1 (after 10 weeks), T2 (after 6 months), T3 (after 12 months), T4 (after 18 months) and T5 (after 24 months). In the intervention group (IG), there was an 8-week intensive phase of the Healthy Lifestyle Community Programme (HLCP), which included 14 consecutive seminars about the prevention of non-communicable diseases (NCDs) and a healthy lifestyle, emphasising community support and the chances of behaviour change. Additional workshops and practical sessions were offered. In the subsequent 22-months alumni-phase, monthly meetings of 2 hours each, refreshed the contents of the intensive phase and strengthened group support.
Study population
Sample size calculation
The sample size was calculated with the kind support from the Institute for Biometry and Clinical Research in Muenster, Germany. Six confirmatory tests were planned to prove the effectiveness of the intervention in terms of weight reduction. Assumed effect sizes for sample size calculation were obtained from pilot study data with a prototype version of the lifestyle programme.13 A total of 84 subjects was calculated (56 in IG, 28 in CG), to obtain a power of 0.8 at a global significance level of 0.05. Expecting a drop-out of at least 10%, we aimed for 92 participants. In order to test the HLCP in the real-world lab and to allow engaged community members to participate, exceeding this minimum sample size was tolerated.
Recruitment
Participants of the IG and CG were recruited from the general population in rural Germany and to ensure that they came from different communities, they were recruited separately from a ‘intervention municipality’ and a ‘control municipality’. However, due to our complex real-world approach, which requires involvement of local stakeholders16 in the planning stage and before recruitment was initiated, it was not possible to cluster randomise.17 Notably, we included not only participants at a high risk for NCDs but also health-conscious persons. In the IG, they were desirable role models (ie, peer support). In the CG, they insured comparability of the groups.
Inclusion criteria
Participants ≥18 years, who were capable of understanding the study content were included.
Participants’ flow diagram
A participants’ flow diagram following the Consolidated Standards of Reporting Trials structure shows the study process from enrolment to analysis in figure 2. Sample sizes are provided throughout, and qualitative reasons for dropouts and losses to follow-up are given wherever possible. A total of n=143 participants were enrolled (n=91 in IG and n=52 in CG, respectively). 57% of the IG (n=52) and 52% (n=27) of the CG finished the study.
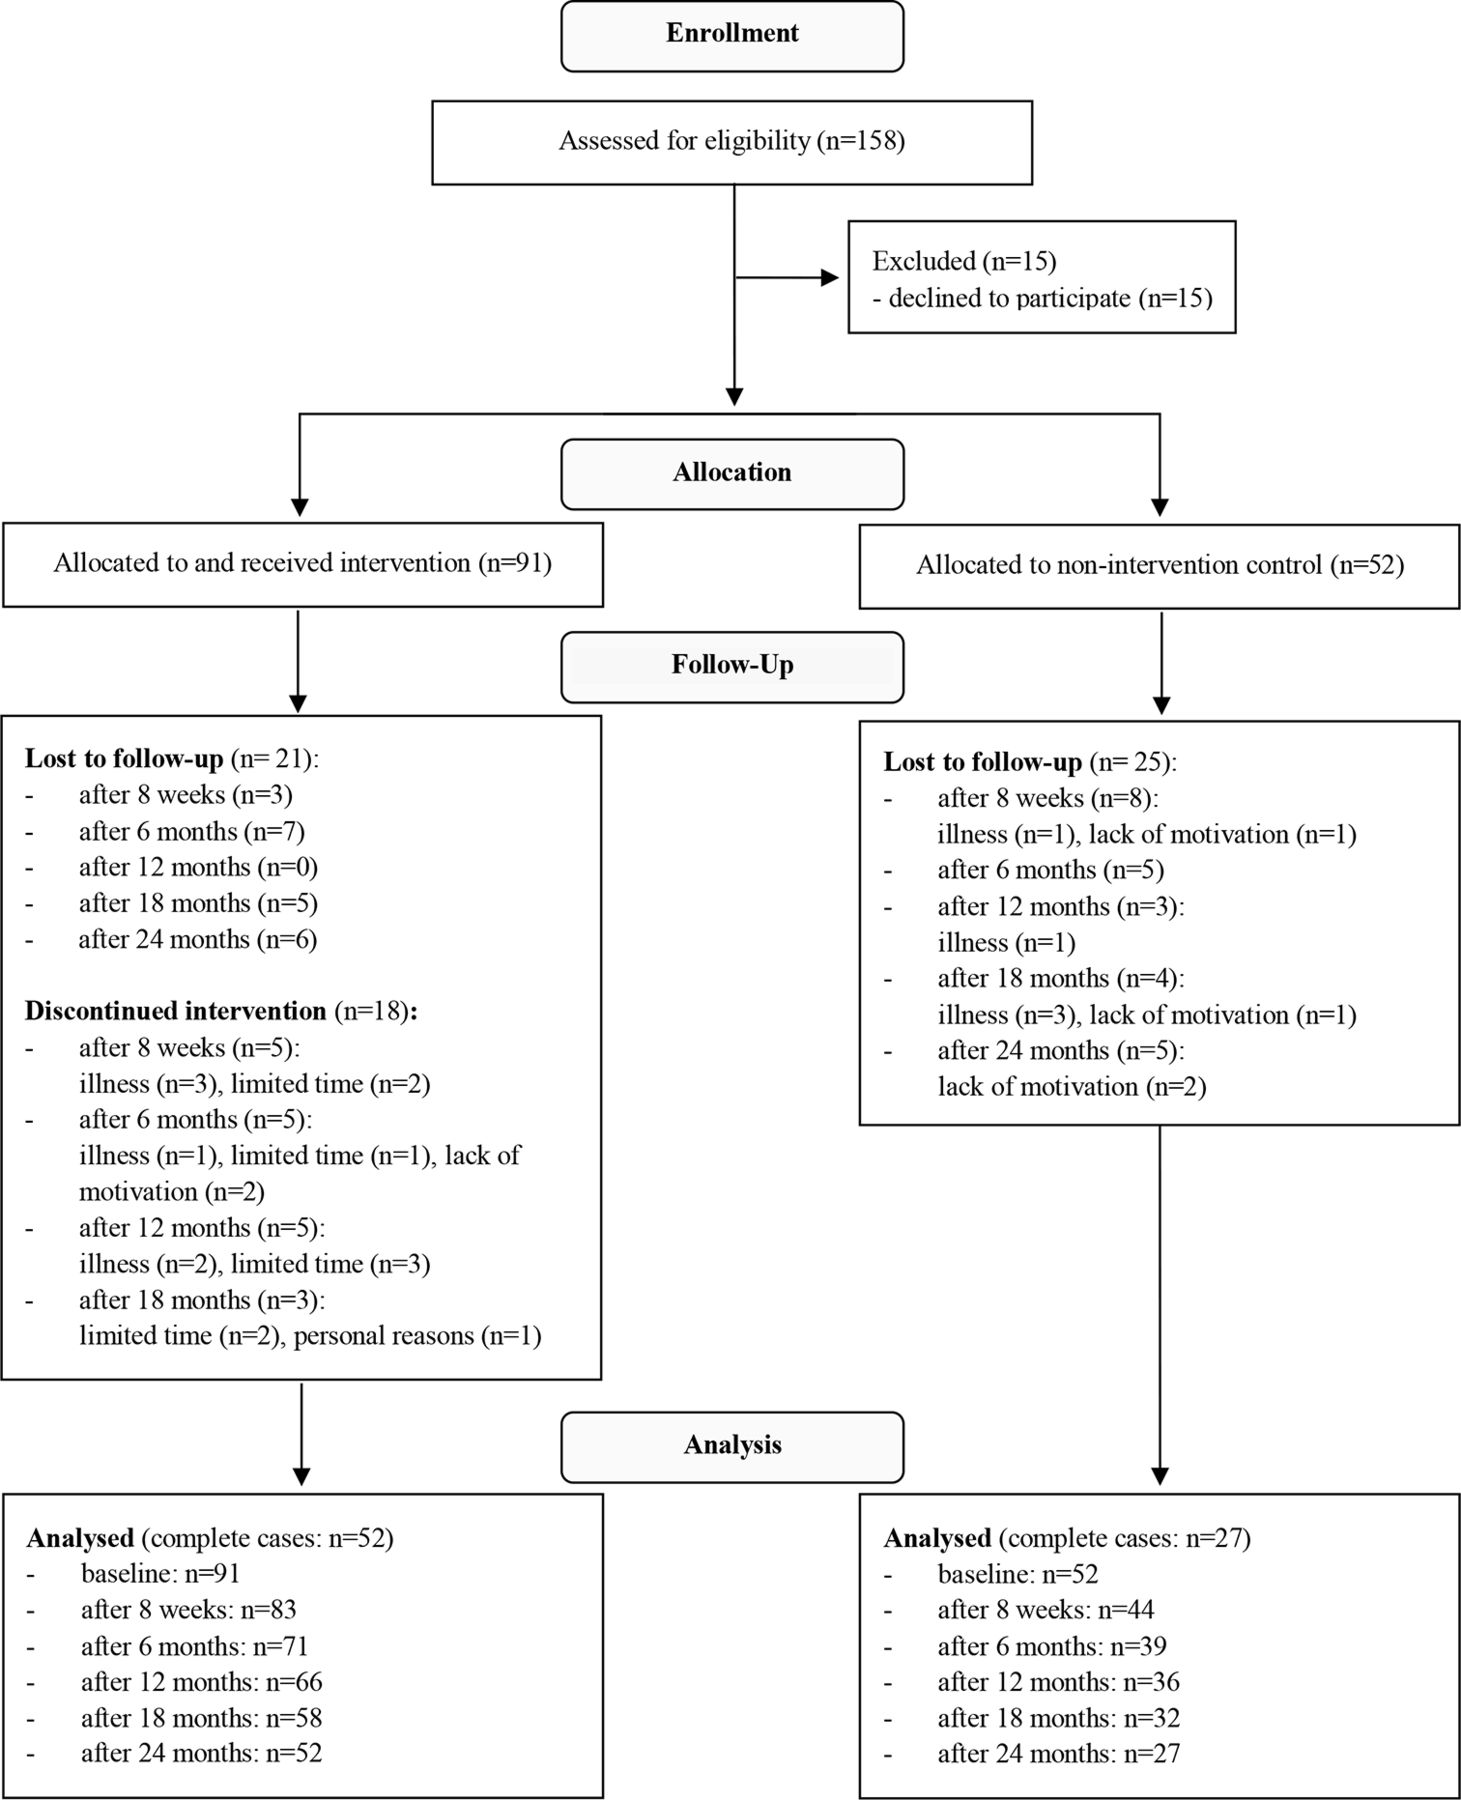
CONSORT structure participants’ flow diagram; in the follow-up-phase, those participants categorised as ‘lost to follow-up’ did not show up to health checks from that time point onwards or withdraw from the study with the given reason. In the IG, additional information is given on how many participants discontinued the intervention (eg, dropped out) and why. CONSORT, Consolidated Standards of Reporting Trials; IG, intervention group.
Health checks
Data were collected at six health checks starting with the baseline assessment in April in IG and October 2017 in CG, respectively. Follow-ups were assessed at 8 weeks, that is, after the intensive phase of the HLCP, and at 6, 12, 18 and 24 months during a 22-month alumni phase in the IG (see figure 1).
Anthropometric and vital parameters
Body weight was determined by calibrated body scales, height by self-report and body mass index (BMI; kg/m²) was calculated, accordingly. Waist circumference (WC) was determined according to the WHO protocol.18 SBP, DBP at rest were determined in duplicate by means of a calibrated blood pressure metre.
Blood parameters
Blood sampling was done in the morning in the fasted state. Metabolic parameters in venous blood (serum) were assessed to establish the risk profile of participants and all analyses were conducted at the University Hospital of Muenster. For lipids, the following reference values were considered optimal19: total-C levels <200 mg/dL, LDL-C <130 mg/dL, HDL-C for women >45 mg/dL and for men >40 mg/dL, respectively, TG <150 mg/dL. FG >126 mg/dL or HbA1c >6.5% were diagnostic of diabetes, FG from 100 to ≤125 or HbA1c from 5.7 to ≤6.5% for pre-diabetes, accordingly.20 FI was assessed and HOMA-IR was calculated.21 A cut-off of 2.5 was used to differentiate good and impaired insulin sensitivity.22
Dietary assessment and questionnaires
Participants filled out weighed food records on three consecutive days (including one weekend day).23 Nutritional intake was computed using the diet software EBISpro 2016 (Dr. J. Erhart, University of Hohenheim, Stuttgart, Germany). To measure adherence to a plant-based diet, a provegetarian food score (ranging from 12 to 60) was calculated and categories of adherence were built (very low, low, moderate, high and very high adherence).24
Validated questionnaires to assess other health parameters (eg, stages of behavioural change,25 physical activity26) and perceived stress27 were assessed among others and results will be published separately.
Lifestyle intervention
The intensive 8-week phase of the HLCP consisted of 14 consecutive seminars (2 hours each, ie, 28 seminar hours in total). Topics included prevention of NCDs, characteristics of a healthy diet, physical activity and stress management, emphasising community support and the chances of behaviour change. Dietary recommendations were to move towards a healthy plant-based diet, high in vegetables, fruits, whole grains, legumes and plant oils, low in meat (especially red and processed meat products), high fat dairy and highly processed foods, for example, refined grains and sugar-sweetened beverages. Evidence-based content about a healthy lifestyle4–7 was communicated vividly including study materials, for example, workbook, recipe booklet. Gender-specific topics, that are considered sensitive (ie, prostate cancer or postmenopausal weight gain), were discussed in single-gender sessions. Practical units (eg, cookery demonstrations and guests’ sessions of local practitioners) were embedded to the seminars and 8 additional workshops (eg, healthy shopping, stress relieve; ~20 participants each; ~2 hours duration) were offered to improve practical skills. In two individual health coaching at baseline and after 8 weeks, results of the health checks and personal goals were discussed. The subsequent 22-months alumni phase consisted of monthly meetings (2 hours each) in which contents of the intensive phase were refreshed and group support was strengthened.
Control group
The CG did not receive any intervention, but participants were informed about health checks results (ie, they could seek medical advice if needed). CG was offered to participate in a subsequent HLCP after completion of the study.
Statistics
All data were analysed according to a predefined plan and all available cases were used. Normality was tested using the Shapiro-Wilk test and judged by histograms.
To compare IG and CG, independent t-test was used for normally distributed continuous variables and Mann-Whitney U test as its non-parametric alternative. Comparisons of dichotomous categorical variables were tested by Fisher’s exact test. Within group comparisons for normally distributed continuous variables were performed by one sample t test or Welch test. Alternatively, the non-parametric Wilcoxon signed-rank test was performed. All tests were two sided.
Multiple linear regression (MLR) models were used to estimate were used to estimate the effect of the intervention on weight change. Variables found to be associated with weight change were added as covariates (in addition to the group variable) to the MLR using a forward-backward selection approach. Regression models that were statistically significant (p≤0.05) with the highest corrected R² and lowest number of covariates were selected. For all secondary outcome parameters MLR was used to explore the effect of the intervention, adjusting for sex, the baseline value and the baseline risk status of the respective variable. In all models, residuals have been checked for normality.
To evaluate the effect of the intervention on subgroup, the cohort was divided retrospectively (eg, gender and weight status). Values of p≤0.05 were considered significant, and are to be understood confirmative for the six hypotheses regarding weight change as the primary outcome, and exploratory28 for secondary outcome parameters.
Statistical analyses were performed using SPSS V.25 for Windows (SPSS).
Results
Baseline characteristics
Baseline demographic characteristics of IG and CG are shown in table 1. We observed no significant differences in most parameters, but participants of IG were younger, more often female and OW and reported lower energy intake than in CG.
Baseline characteristics by study group (n=143)
21% and 29% in IG and CG, respectively, held a university degree (UD). Metabolic risk profiles regarding blood and vital parameters were comparable in both groups; except for HDL-C, diabetic parameters (FG, HbA1c) and DBP, which were better in IG.
Primary confirmatory analyses of weight change
Changes of weight in IG and CG compared with baseline, between groups and separated by sex and risk groups, are presented in table 2.
Change of weight in intervention and control group according to relevant subgroups 8 weeks, 6, 12, 18 and 24 months after baseline, all values are mean±SD
Supplemental material
Weight significantly decreased in IG after 8 weeks, 6, 12, 18 and 24 months compared with baseline and significantly more than in CG—except for after 24 months (see figure 3). BMI followed the same pattern.
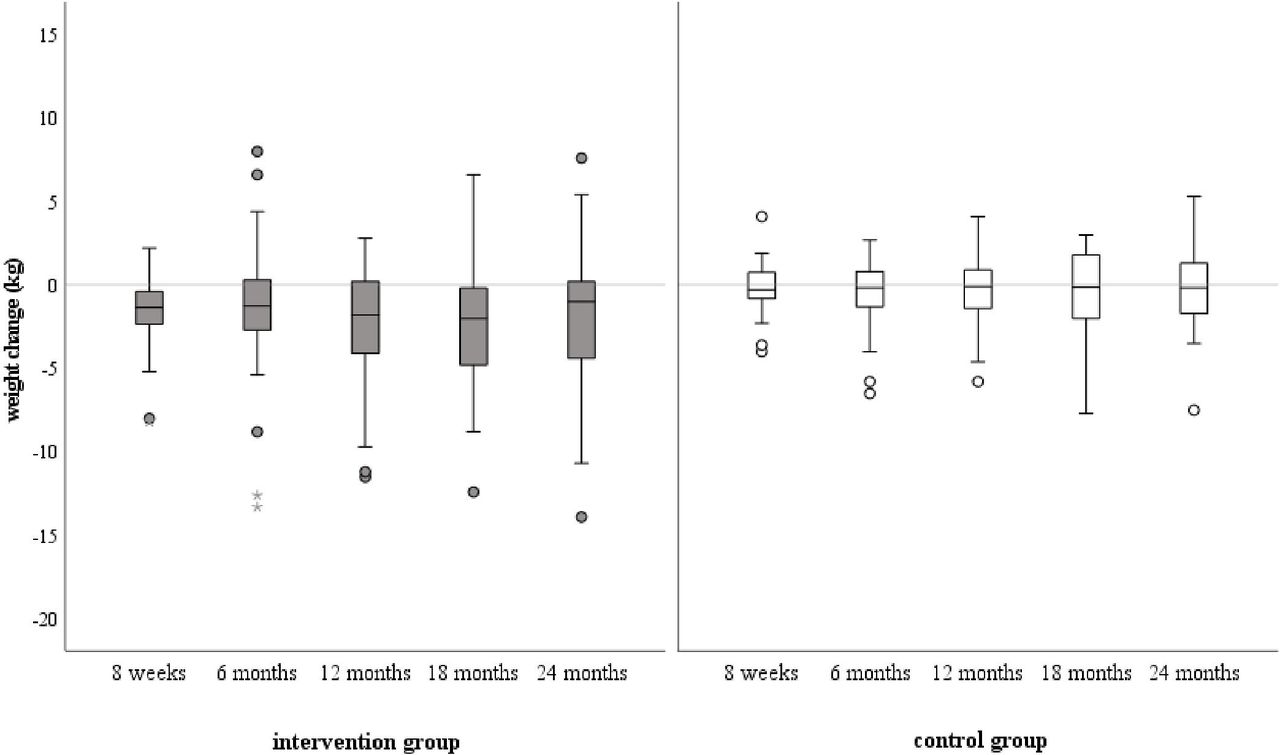
Boxplots of weight change (kg) in intervention (left, dark grey) and control group (white) after 8 weeks, 6, 12, 18 and 24 months after baseline (baseline values in intervention group: 85±19 kg, in control group: 80±18 kg). Differences to baseline were significant in IG after 8 weeks to 18 months (p<0.001) and 24 months (p<0.05). Differences between IG and CG were significant after 8 weeks (p<0.001), 6 months (p<0.05), 12 months (p<0.05), 18 months (p<0.05). CG, control group; IG, intervention group.
Analyses separated by BMI group at baseline indicated, that normal weight (NW, BMI<25 kg/m²) and (OW, BMI ≥25 kg/m²) participants lost more weight in IG than in CG after 8 weeks (p=0.008 and p=0.016, respectively). In IG, OWs also decreased weight more than NWs after 8 weeks (p=0.029) and stayed below baseline levels at all follow-ups (p<0.001 after 8 weeks to 18 months and p=0.002 after 24 months).
Interestingly, participants with a UD did not only maintain weight loss over time but their weight also decreased further up to −6% after 18 and 24 months, resulting in higher weight loss than in other education subgroups (p=0.006, p=0.004 and p=0.003 after 12, 18 and 24 months, respectively) where it stayed on a lower level but did not decrease noteworthily after an initial drop after 8 weeks.
Since a weight loss of 5%–10% is considered to be a doable long-term goal,29 we tested, whether it could be achieved by the HLCP. In the IG, 37% (n=29) of the participants lost >5% of their baseline weight during the study course of 2 years, and 14% (n=7) in the CG, accordingly (p=0.008).
Regression analysis
MLR analyses identified being in the IG, male and OW at baseline as well as the male-by-IG interaction as predictors for weight loss after 8 weeks (online supplemental table S-1). This means, as figure 4 shows: NW and OW men (dark grey bars) in the IG, lost more weight than NW and OW women (dark grey striped bar) and more than NW and OW men of CG (grey bar). NW and OW women in the IG, however, lost comparably as much weight as men of CG and even less than women of CG (grey striped bar).
Supplemental material

Weight loss after 8 weeks in intervention and control group according to sex and weight status at baseline; adjusted for age, participating with/without family interaction and the group-participating with/without family interaction (R²=0.216, p=0.001).
Being male (p=0.040) and OW (p=0.016)) also predicted weight loss after 18 months (adjusted for male by participating with/without family).
In the MLR, having a UD turned out to be a predictor for weight loss after 6 (p=0.027), 12 (p=0.080) and 18 months (p=0.040), and the UD-by-IG interaction after 24 months (p=0.069 (online supplemental table S-1)). Consistently with the results of the descriptive analyses, being OW at baseline influenced weight loss not only after 8 weeks (p=0.028) but also after 18 months (p=0.016). The effect of the IG alone on weight loss, however, was not significant (p>0.05) at follow-ups from 6 months onwards.
Secondary exploratory analyses of anthropometric, blood and vital parameters and dietary intake
The changes of metabolic parameters did not follow a clear pattern. They were most distinct after 8 weeks (ie, the intensive phase of the HLCP) and improved especially in people at elevated risk (eg, total-C, TG, SBP, DBP). For complete presentation of blood parameters, WC and additional subgroup analyses, see online supplemental figure S-2 and online supplemental table S-3.
Supplemental material
Notably, FG increased in IG compared with baseline after 6 (p=0.031), 12, 18 and 24 months (for all p<0.001). P values suggest a relevant difference in FG change between the IG and CG at all follow-ups (for all p<0.001, but 24 months with p=0.001). As the p values of a subgroup analyses indicated, the increase in the IG was due to an increase in non-diabetics with p=0.035 after 6 months and p<0.001 after 12, 18 and 24 months. In the CG, reductions compared with baseline were observed in participants with pre-diabetes at all follow-ups (p<0.001 after 8 weeks and 12 months and p=0.001, p=0.002 and p=0.016 after 6, 18 and 24 months, respectively). HbA1c followed the pattern of these results. Medication with oral antidiabetics and/or insulin did not change in both groups.
After 8 weeks, the IG reduced energy intake more than the CG (−181±352 kcal/day vs 119±363 kcal/day), but the difference stayed non-significant (p=0.102). Evaluation of the provegetarian score showed dietary improvement after 8 weeks not in the CG (p=0.975) but in the IG (p=0.038), where participants shifted towards high adherence (+12%) and away from the moderate (−1%), very low (−6%) and low (−5%) adherence category. There were no differences to baseline at later time points (p>0.05).
Regression analyses
MLR, adjusting for sex, baseline value and risk status of the respective variables, revealed a significant impact of the HLCP at different time points on an improvement of BMI, total-C, LDL-C, HDL-C and DBP and on an increase of WC and all diabetic parameters (table 3). As described above, most significant effects appeared after 8 weeks. The increase of FG stayed distinct (p<0.001 after 8 weeks, 12 and 18 months and p=0.001 after 6 and 24 months) even after adjusting for the baseline values and risk group.
Effect of group (Ref. intervention group) on the metabolic risk profile (adjusted for sex, baseline values and risk group at baseline of the respective variable); forced enter approach
Discussion
In summary, the HLCP, cohort 1 moderately reduced weight and improved some parameters of the risk profile for metabolic NCDs, such as total and LDL cholesterol.
Weight loss in the IG was moderate but comparable with other interventions.30 Studies with a stricter diet regimen show more distinct results, for example, a vegan healthy diet with a weight loss of −6.5 kg after 16 weeks.31 Yet, variability in weight outcomes among participants of lifestyle interventions is high14 and smaller effects were expected due to the real-world approach—as opposed to controlled study lab conditions of regular dieting studies. Still, 37% of the participants in the HLCP were able to reduce >5% of their baseline weight. Since combined interventions that do not only focus on diet alone have been shown to be more effective for long-term weight loss,32 a holistic approach seems suitable for a heterogenous communities despite smaller effects.
Participants with a UD lost more weight (up to −5.7±3.5 kg after18 months), suggesting that knowledge transfer was emphasised too strongly for participants of lower educational status. Therefore, we suggest even more practical units and simplified dietary rules—as we modified in subsequent HLCPs (cohort 217 and 3 (unpublished data)).
The HLCP reached mainly women—as it is typical for health education interventions, but those men who did participate, benefited the most regarding weight change. This is in line with other studies that show higher weight loss in men,33for example, due to gender-specific metabolic differences.34
The diabetes risk profile in the IG did not improve. Notably, most participants (75%) in the IG had no increased diabetes risks at baseline and subgroup analyses showed that FG increased mainly in non-diabetics. In participants at higher risk, parameters tended to decrease. Yet, even when adjusting for risk group, sex and previous FG changes, the difference to the CG stayed significant, which was neither desirable nor expected, as lifestyle interventions are likely to improve diabetes risk parameters.35 The change of diabetes parameters was not mirrored in the improved outcome of other parameters, like weight and lipid profile, and can also not be explained by a change in medication. Possibly, factors that were not assessed, such as working conditions,36 had a relevant impact.
Notably, both groups reported a low average energy intake, indicating the long-known problem of under-reporting, especially in OW people.23 Technology-supported methods might help to improve dietary data assessment in the future.37
As other intervention programmes before,14 30 the HLCP struggled to sustain the better risk profile in the longer term. Though weight loss was maintained throughout the study course of 2 years, other parameters did not improve that clearly.
Since we observed the biggest changes after the intensive phase of the HLCP, also regarding the higher adherence to the provegetarian food pattern, we suggest to intensify the alumni phase. An extension of digital and online measures38 may help participants to include these in their everyday life.
The intervention tended to have stronger and longer-term effects in participants at higher risk. Since we recruited from the general population, these high-risk subgroups were relatively small, which might have contributed to non-significance.28 Future programmes should aim for a larger sample of high-risk participants to test this hypothesis.
In the CG, some risk parameters (eg, HDL-C, TG or FG) improved as well. Possibly, the mere health checks have to be considered an intervention, since participants of the CG regularly received their results, due to ethical and motivational reasons, which can already initiate health behavioural change.39
Limitations
Due to limited resources, the CG started with a delay of 6 months compared with IG and due to the nature of our real-world community approach, randomisation was not possible. However, IG and CG had similar baseline characteristics (except age, gender, BMI, HDL-C and energy intake) and we adjusted for those which were different between groups. Yet, the non-randomisation may have led to a bias due to the selection of particularly motivated participants.
Missing data occurred for blood parameters at baseline, which had to be taken on a different day than other parameters and only 90% (n=81) of the participants were available in the IG. Further disparities of sample sizes occurred due to participants’ personal matters, for example, poor venous access. Also, the sample sizes in IG and CG dropped within the study course of 24 months (similarly in both groups) by around 50%. However, we analysed all the available data to avoid loss of information and overestimation of efficiency which can occur in all-case analyses.40
Our observations should be validated in a bigger cohort, as we divided subgroups (eg, sex) retrospectively and did not consider them when calculating the sample size.
Conclusion
Our study gives valuable insights into the effects of lifestyle interventions in communities as a real-world lab. The HLCP moderately reduced weight of the participants in the long term and slightly improved the risk profile for NCDs mostly in the short term and with regard to some, but not all, parameters. Modifications should be made to improve results with a lower educational status, and more participants with a high cardiometabolic risk should be recruited in future studies.
Data availability statement
Data are available on reasonable request.
Ethics statements
Patient consent for publication
Ethics approval
The study was conducted in accordance with the Declaration of Helsinki and was approved by the ethics committee of the Westphalia-Lippe Medical Association and the Muenster University (Muenster, Germany; reference: 2017-105 f-S; approved 5 April 2017). All participants provided written informed consent.
Acknowledgments
We would like to thank the study participants, the local stakeholders involved, for example, city administration, medical practitioners and volunteers, Alwine Kraatz who took part in the investigation, Matthias Borowski, PhD for his statistical advice, our student helpers and the entire research group.
References
Supplementary materials
Supplementary Data
This web only file has been produced by the BMJ Publishing Group from an electronic file supplied by the author(s) and has not been edited for content.
Footnotes
Contributors CA: guarantor of overall content, conceptualisation, methodology, validation, formal analysis, investigation, participant management, data assessment and curation, writing original draft, review and editing of the text, visualisation, project administration, funding acquisition. R-MK: participant management, data assessment and curation, review and editing. SH: data assessment and curation, review and editing of the text. CK: data assessment and curation, review and editing of the text. NS: participant management, data assessment and curation, review and editing of the text. D-KA: data assessment, review and editing of the text. KH: methodology, medical advice, review and editing of the text, supervision. RG: methodology, medical advice, review and editing of the text, supervision. HE: conceptualisation, methodology, investigation, review and editing of the text, project administration, supervision, funding acquisition.
Funding This work was conducted as part of the project 'KRAKE' and was funded by EUREGIO within the INTERREG V A programme Deutschland-Nederland (ANBest INTERREG DE-NL) with the following grant number: 203018. We acknowledge support from the Open Access Publication Fund of the University of Muenster.
Competing interests None declared.
Provenance and peer review Not commissioned; externally peer reviewed.
Supplemental material This content has been supplied by the author(s). It has not been vetted by BMJ Publishing Group Limited (BMJ) and may not have been peer-reviewed. Any opinions or recommendations discussed are solely those of the author(s) and are not endorsed by BMJ. BMJ disclaims all liability and responsibility arising from any reliance placed on the content. Where the content includes any translated material, BMJ does not warrant the accuracy and reliability of the translations (including but not limited to local regulations, clinical guidelines, terminology, drug names and drug dosages), and is not responsible for any error and/or omissions arising from translation and adaptation or otherwise.