Article Text

Abstract
Introduction Poor diet is the leading cause of poor health in USA, with fresh vegetable consumption below recommended levels. We aimed to assess the impact of medical prescriptions for fresh (defined as picked within 72 hours) vegetables, at no cost to participants on cardiometabolic outcomes among adults (predominantly Mexican-American women) with or at risk of type 2 diabetes (T2D).
Methods Between February 2019 and March 2020, 159 participants (122 female, 75% of Mexican heritage, 31% with non-insulin treated T2D, age 52.5 (13.2) years) were recruited using community outreach materials in English and Spanish, and received prescriptions for 21 servings/week of fresh vegetable for 10 weeks. Pre-post comparisons were made of weight; waist circumference; blood pressure; Hemoglobin A1c (HbA1c, a measure of long-term blood glucose control); self-reported sleep, mood and pain; vegetable, tortilla and soda consumption. After obtaining devices for this study, 66 of 72 participants asked, agreed to wear blinded continuous glucose monitors (CGM).
Results Paired data were available for 131 participants. Over 3 months, waist circumference fell (−0.77 (95% CI −1.42 to 0.12) cm, p=0.022), as did systolic blood pressure (SBP) (−2.42 (95% CI −4.56 to 0.28) mm Hg, p=0.037), which was greater among individuals with baseline SBP >130 mm Hg (−7.5 (95% CI −12.4 to 2.6) mm Hg, p=0.005). Weight reduced by −0.4 (−0.7 to –0.04) kg, p=0.029 among women. For participants with baseline HbA1c >7.0%, HbA1c fell by −0.35 (-0.8 to –0.1), p=0.009. For participants with paired CGM data (n=40), time in range 70–180 mg/dL improved (from 97.4% to 98.9%, p<0.01). Food insecurity (p<0.001), tortilla (p<0.0001) and soda (p=0.013) consumption significantly decreased. Self-reported sleep, mood and pain level scores also improved (all p<0.01).
Conclusions Medical prescriptions for fresh vegetables were associated with clinically relevant improvements in cardiovascular risk factors and quality of life variables (sleep, mood and pain level) in adults (predominantly Mexican-American and female) with or at risk of T2D.
Trial registration number ClinicalTrials.gov Identifier: NCT03940300.
- diabetes mellitus
- dietary patterns
- metabolic syndrome
- nutritional treatment
This is an open access article distributed in accordance with the Creative Commons Attribution Non Commercial (CC BY-NC 4.0) license, which permits others to distribute, remix, adapt, build upon this work non-commercially, and license their derivative works on different terms, provided the original work is properly cited, appropriate credit is given, any changes made indicated, and the use is non-commercial. See: http://creativecommons.org/licenses/by-nc/4.0/.
Statistics from Altmetric.com
What this paper adds
Poor diet is the leading cause of poor health in USA, with vegetable consumption below recommended levels of two to three cups of vegetables each day.
Using a medical prescription programme to provide access to fresh vegetables with no additional nutrition education is associated with improvements in cardiometabolic health; reduced food insecurity; and improved self-reported mood, sleep and pain scores for predominantly Mexican-American adults at risk for or with non-insulin treated type 2 diabetes.
Medically prescribed produce and continuous glucose monitoring may have health-economic benefits for underserved adults at risk for or with diabetes and other common chronic conditions.
Background
In USA dietary factors have been linked to almost half of annual deaths from cardiometabolic disease.1 For adults with or at risk of developing type 2 diabetes (T2D), the consumption of vegetables, fruits, whole grains and legumes is encouraged.2 However, consumption of fruit and vegetables in USA is well below recommended levels, with just 10% of American adults meeting recommendations of two to three cups of vegetables per day.3
Food choices are affected by the proximity of food outlets and types of foods available, and by price and conflicting work and family responsibilities.4 In addition, food insecurity (defined as a lack of consistent access to enough food for an active, healthy life) has also been linked to negative health outcomes, including T2D, coronary heart disease, cancer and mental health problems.5 In 2018, 11% of US households were food insecure some time during the year, including 4.3% (5.6 million households) with very low food security (defined as households in which the food intake of one or more members was reduced and eating patterns disrupted because of insufficient money and other resources for food).6 Food insecure households experience cycles of food scarcity, which can result in negative compensatory behaviours such as consumption of low-cost, energy-dense foods, skipping meals and binge eating when food is available.7 The intake of cheap foods with low nutrient, high energy (eg, refined grains and trans fats or saturated fats) is a major risk factor for progression of T2D.8
Compared with non-Hispanic whites, rates of T2D are higher among US Hispanic/Latino adults,9 and this population is also more likely to participate in federal programmes such as the Supplemental Nutrition Assistance Program (SNAP).10 A recent microsimulation study suggested that implementing healthy food prescriptions within government healthcare programmes could generate substantial health gains and be highly cost-effective.11 At present, little is known about the health and economic impacts of incentivising individuals to choose healthier options, including the use of medical prescriptions for food.
A recent study assessed the feasibility of using medical prescriptions for organic vegetables to improve health outcomes for adults with T2D. In the pilot study, over 3 months, there was a clinically significant reduction in blood pressure, with the majority of participants showing measurable improvements in weight, waist circumference and food insecurity.12 The aim of this study was to use a prospective, observational cohort design to test the hypothesis that providing medical prescriptions to increase access to fresh vegetables improves cardiometabolic outcomes for adults with or at risk of T2D.
Methods
The study (Farming for Life) began in February 2019. Locally (Central Coast of California), 43% of the population is Hispanic/Latino (predominantly Mexican-American) with high rates of T2D and prediabetes.13 Potential participants were recruited via bilingual (Spanish and English) outreach materials and with help from bilingual community health workers (known as ‘Especialistas’). Participants were recruited through community outreach, from existing programmes, Latino-focused community organisations, and local health and social services. Approaches to recruitment included engagement with and referrals, including providing details of the inclusion and exclusion criteria, from local Federally Qualified Health Centers; community service providers; academic institutions with high English as a Second Language enrolment (ie, Hispanic-serving institutions); employers; media (Spanish and English language); social media; advertisements; participation in community events; and ad hoc interaction with Especialistas. Eligible and consented participants provided baseline demographic and clinical information (see below). Data were collected on age, gender, self-reported race/ethnicity, health insurance status and whether participants had been informed of a diagnosis of T2D by a qualified medical provider.
Subsequently, participants collected 10 weekly prescriptions, signed by a medically qualified practitioner from Sansum Diabetes Research Institute, for fresh vegetables (organic and non-organic) from institutional review board (IRB) approved community sites which served as storage and distribution locations. The vegetables for this programme were sourced and purchased wholesale from four farms within 70 miles of the distribution location/s and within 72 hours of being picked from the fields. The types of vegetables were dependent on seasonal availability. At each weekly prescription pick-up visit, participants received the recommended 21 weekly servings of fresh vegetables excluding starchy vegetables.14
For comparison, data collection by trained research staff was repeated 12 weeks from baseline. The end points for comparison were changes in blood pressure, weight, waist circumference, glycaemic control, time in range as measured by continuous glucose monitoring (CGM) and HbA1c levels (a measure of long-term blood glucose control) compared with baseline measurements. Additional assessments were made on the impact of the vegetable prescriptions on food security, mood, sleep and pain, as well as vegetable, tortilla and soda consumption. All questionnaires were available in English and Spanish.
Farming for Life participants were adults with or at risk of developing T2D living in Santa Barbara County. Inclusion criteria included adults aged ≥18 years of age with a self-reported diagnosis of T2D for at least 6 months or self-reported as at risk for developing T2D using the American Diabetes Association diabetes risk assessment tool.15 Exclusion criteria included current or previous use of insulin, pregnancy or any active clinically significant disease or disorder which in the investigator’s opinion could interfere with participation in the study.
Height, weight and waist circumference were measured following the guidelines from the National Health and Nutrition Examination Survey Anthropometry Procedure Manual, January 2016.16 Body mass index was then calculated using the Quetelet Index (body weight (kilograms) divided by height squared (meters)).17 Resting blood pressure was measured following 2017 guidelines set forth by the American College of Cardiology/American Heart Association Task Force on Clinical Practice Guidelines.18
Comparisons were also made at baseline and after 12 weeks from baseline of:
Finger-stick HbA1c (Siemens DCA Vantage, Siemens Healthcare, Norwood, Massachusetts, USA) measured by research staff.
Level of food security, assessed by a six-item short form.19 (available at: https://www.ers.usda.gov/media/8279/ad2012.pdf). The questionnaire consists of six questions regarding food security or insecurity, and the choices for answers are ‘often true’, ‘sometimes true’, ‘never true’ and ‘don't know or refused’.
Concurrent medications, assessed by visual inspection of medication containers brought to the study site by each participant.
Self-reported sleep, mood and pain scores, used 100 mm Visual Analogue Scales to answer the question, ‘How would you rate your sleep/mood/pain over the course of the past 7 days?’ from worst sleep/mood to best sleep/mood and worst pain to no pain. For the final set of measurements, participants were blinded to the baseline scores.
Acculturation, assessed using the Brief Acculturation Scale for Hispanics. This is a participant-reported questionnaire in which response options are 1=only Spanish, 2=Spanish more than English, 3=Spanish and English equally, 4=English more than Spanish and 5=only English. Items are summed and divided by the number of items. A low level of acculturation is a score of ≤3.0 and a high level is >3.0.20
Preprogramme and postprogramme questionnaires about (A) Daily sugar-sweetened beverage consumption21 (available at: https://www.cdc.gov/brfss/questionnaires/pdf-ques/2017_BRFSS_Pub_Ques_508_tagged.pdf), (B) Number of times per week eating meals prepared away from home22 (available at: https://wwwn.cdc.gov/Nchs/Nhanes/2017-2018/DBQ_J.htm%23DBD895 ), and (C) Number of flour and/or corn tortillas consumed daily for over previous 30 days.
Self-reported vegetable consumption, using the questions (in English and Spanish): (A) ‘what percent of Farming for Life vegetables did you discard?’ (B) ‘how frequently did you eat fresh vegetables before the programme?’ and (C) ‘how frequently do you eat vegetables now?’
After the 3-month visit, participants were invited to attend a follow-up visit 6 months postbaseline for an additional measurement of blood pressure and HbA1c level.
Continuous glucose monitoring
Starting in May 2019, after obtaining IRB approval, a subset of 66 of 72 participants asked (53 female, age 53.3±13.1 years, 10 with T2D) agreed to wear a blinded CGM (Abbott Freestyle Libre Pro CGM) for 2 weeks after enrolment (baseline) and during the final 2 weeks of the study to determine if there were additional effects, beyond HbA1c, of the vegetable prescriptions on CGM-based glucose metrics, including time in range (70–180 mg/dL) and glucose variability. Participants were trained to wear CGM sensors using manufacturer educational materials under the supervision of research staff. The CGM data for each participant were summarised using manufacturer software which produces both a statistical and graphical display of data. CGM analyses were based on published recommendations.23 Due to the interruption of the study because of COVID-19, we had CGM data at the final visit from 40 participants.
Statistical analyses
Based on our pilot study (n=21 adults with T2D) in which systolic blood pressure (SBP) fell by −6.8 13.7 mm Hg (mean±SD), to achieve an α=0.05 and a power of 0.9, the minimum sample size for this study was set at 45 participants. Data analyses were performed using Social Science Statistics (https://www.socscistatistics.com/) and MATLAB software (https://www.mathworks.com/, V.R2019b). For each variable, normality of distribution was assessed using the Kolmogorov-Smirnov test. Participants with paired data (ie, data available from baseline and final visits) were compared with those only providing data from their baseline visit using unpaired Student’s t-test or Mann-Whitney U test for data not normally distributed. Subsequently, comparisons were made of data at baseline with the same measurements from the final visit for participants with paired data. For normally distributed data, differences were evaluated using the Student’s t-test and using the Wilcoxon signed-ranks test for paired data not normally distributed. Statistical significance was expressed at the 5% level.
Results
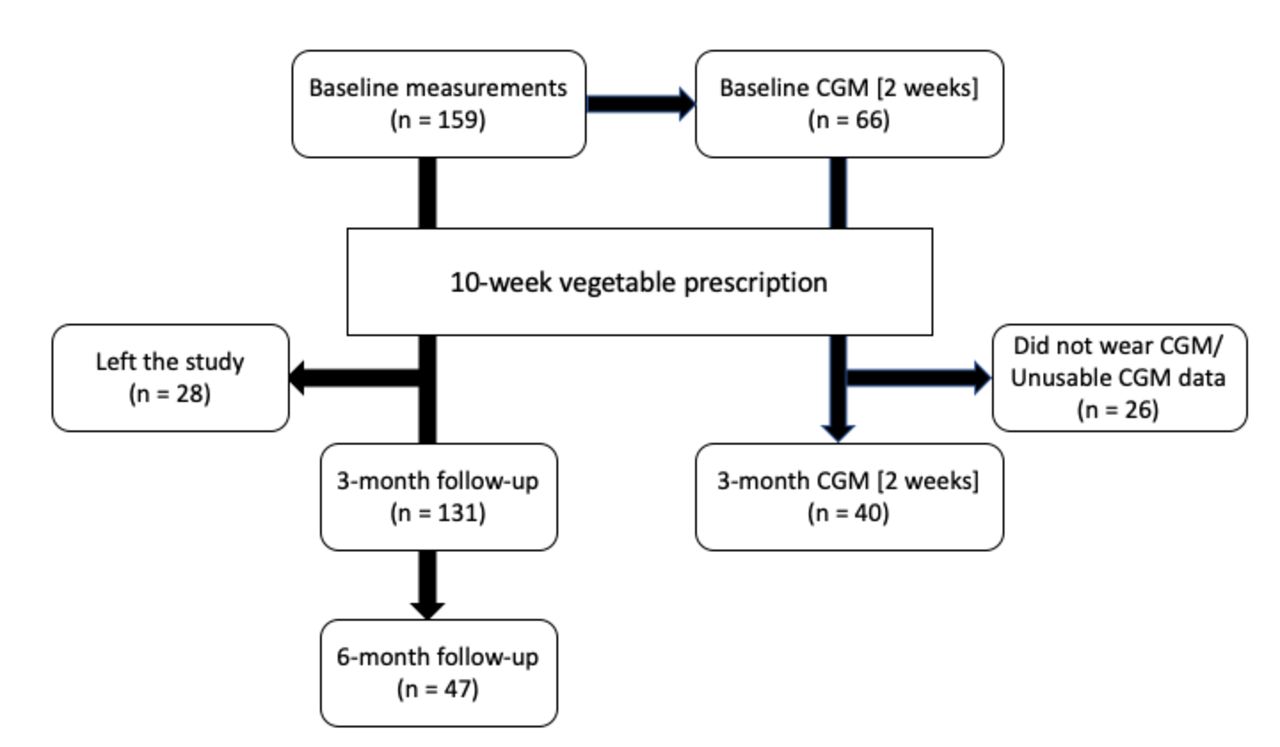
The study began in February 2019, and data from participants have been included up to March 2020, the start of the COVID-19 pandemic in California. Over that period, 159 participants (age 52.5±13.2 (mean±SD) years, 49 with T2D) were enrolled (figure 1 and table 1); 28 chose not to attend at some point after their first visit. Reasons for this are not completely known but included participants moving away, challenges related to weekly pick-up as well as a perceived lack of need for weekly produce, and concerns about COVID-19. Forty-seven participants also returned for a follow-up visit at 6 months postbaseline (ie, 3 months after completion of Farming for Life). In addition, final visits within the scheduled times were not possible for an additional 16 participants due to the impact of the COVID-19 pandemic. Their data have been excluded from the analyses.

Participation flow between February 2019 and March 2020. Note: Recruitment and follow-up visits were cancelled after March 2020 due to the COVID-19 pandemic. CGM, continuous glucose monitors.
Baseline characteristics of all enrolled participants
Baseline characteristics of participants are shown in table 1.
Median score for acculturation was 1.38 (IQR: 1 to 4.4) showing a low level of acculturation.20 For the 31% self-reporting a T2D diagnosis, the average time elapsed from T2D diagnosis was 10.6 (8.6) years.
In table 2 we have stratified participants at baseline into two groups: one with participants who provided paired data (ie, preintervention and postintervention data) and another with participants who only had baseline data.
Comparison of baseline data for participants providing baseline and postintervention (n=131) versus participants providing data on their first visit only (n=28). Results shown as mean±SD
For the 131 participants with paired data, waist circumference was lower at 3 months compared with baseline (−0.77 (95% CI −1.42 to 0.12) cm, p=0.022), associated with a fall in SBP (−2.42 (95% CI −4.56 to 0.28) mm Hg, p=0.037). The fall in SBP was greater among individuals with baseline SBP >130 mm Hg (−7.5 (95% CI −12.4 to 2.6) mm Hg, p=0.005). Diastolic blood pressure was unchanged (67.8+9.3 mm Hg at baseline compared with 67.5±9.0 at the final visit). Weight also reduced by −0.4 kg (−0.7 to –0.04, p=0.029) among women. For participants with baseline HbA1c >7.0%, HbA1c decreased by −0.35% (−0.8 to –0.1, p=0.009). Changes in metrics for the 131 participants completing the study are shown in table 3.
Comparison of variables collected at first and final visits for participants with paired data (ie, at baseline and from the final visit). Results are shown as mean±SD unless otherwise stated
For all participants, the proportion with either low or very low food security was 35% at enrolment, which dropped significantly to 13% after 3 months (p<0.001). In terms of food choices for individuals with paired data, there was a drop in daily consumption of tortillas from 3 (IQR: 0.5 to 4.5) to 1.5 (0 to 2.5) (p<0.0001), with the reduction overwhelmingly in corn-based tortillas (p<0.0001). Similarly, self-reported consumption of soda fell over the same time period, from 3 (0 to 8) per month to 2 (0 to 5) (p=0.013). The number of meals eaten outside of the home each week was not significantly different at baseline compared with at 3 months. Self-reported waste of the prescribed vegetables averaged 0%–25%. Frequency of vegetable consumption increased significantly, with 50% of the 120 participants who completed the exit questionnaire consuming vegetables at least once a day at 3 months, compared with 15% at baseline (p<0.0001).
At enrolment, 33% of participants were taking oral hypoglycaemic agents (OHA) and, 29% took blood pressure lowering therapies. Over the 3-month period, six had reduced or stopped their OHA, and one had the dose increased. Three participants had their blood pressure medicines discontinued.
Continuous glucose monitoring
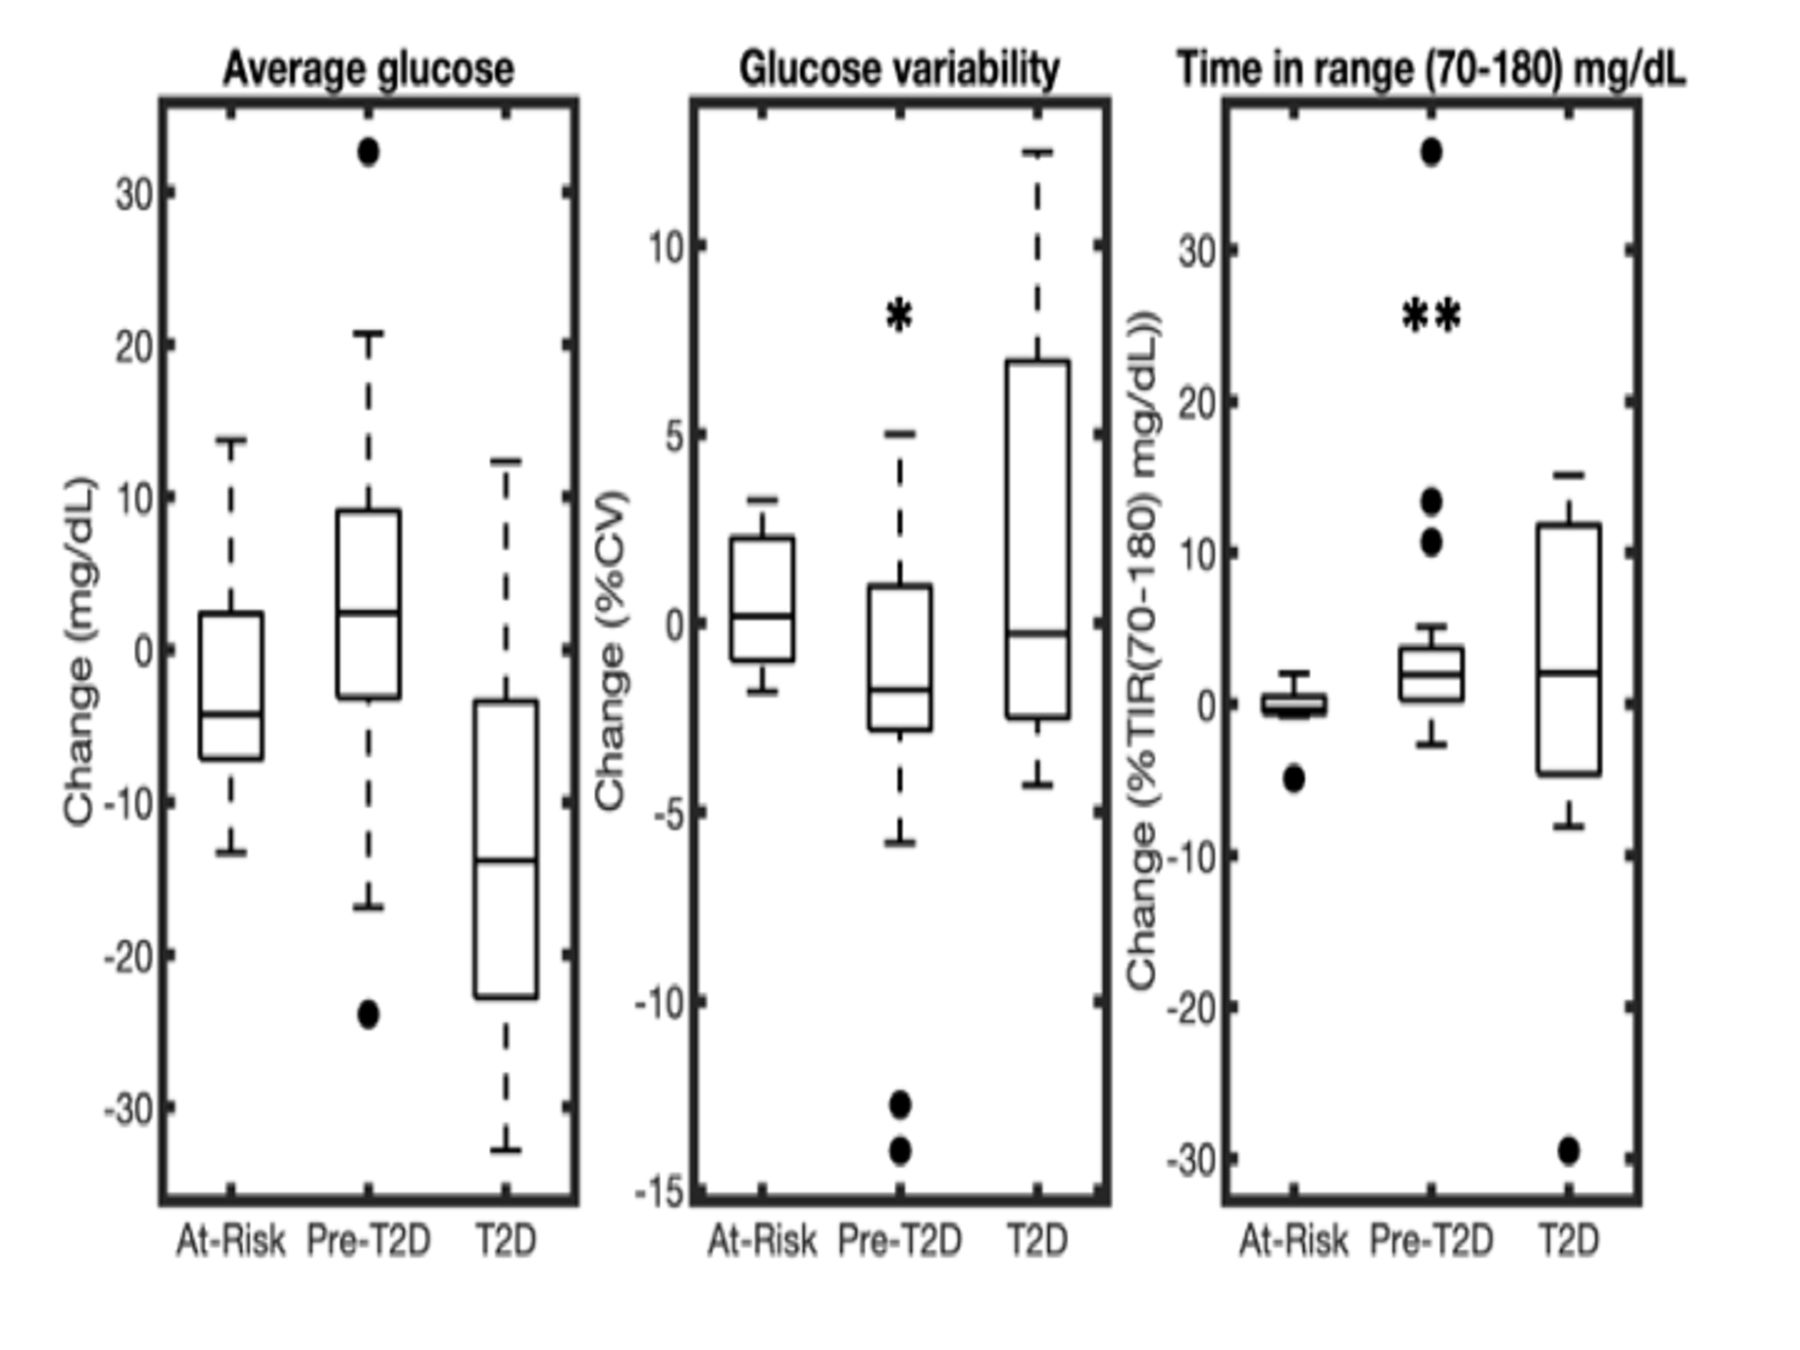
For all participants with both baseline and postintervention CGM data (n=40), there was a significant improvement in time in range (70–180) mg/dl (from 97.4% to 98.9%, p<0.01). Participants were stratified by baseline HbA1c at baseline into at-risk (HbA1c < 5.7%), pre-T2D (HbA1c5.7%–6.4%), and T2D (HbA1c > 6.4%).24 After stratifying by baseline HbA1c levels, there was a significant improvement for time in 70–180 mg/dL range (median (IQR) 1.9% (0.3 to 3.7) %, p=0.0014) and a reduction in glucose variability measured as the percentage coefficient of variation (%CV) (−1.8 (−2.8 to 1.0) %) in the pre-T2D group (p=0.029) over 3 months (figure 2). There was also a non-significant decrease in average glucose (−13.8 (3.4 to 22.8) mg/dL, p=0.055) in the group with a baseline HbA1c >6.4%.

Change in average glucose, glucose variability measured as the percentage coefficient of variation (%CV) and time in range (TIR) (70–180 mg/dL) for n=40 participants wearing CGM at baseline and at 3 months. Participants are stratified by baseline HbA1c at baseline into at-risk (HbA1c < 5.7%), pre-T2D (HbA1c 5.7%–6.4%), and T2D (HbA1c > 6.4%). A positive value represents an increase of the CGM variable from baseline to 3 months, while a negative value represents a corresponding decrease. Results are shown as box plots (*p<0.05, **p<0.01). CGM, continuous glucose monitor; T2D, type 2 diabetes.
Follow-up visit at 6 months
Forty-seven participants (41 female, aged 60.0±11.2 years) returned for a follow-up visit at 6 months, that is, 3 months after completion of the Farming for Life programme (table 4). In this subgroup, compared with baseline values, there were significant reductions in SBP and HbA1c (both p=0.03).
Variables collected on participants returning for a visit 3 months after completing the Farming for Life programme. Results are shown as mean+SD unless otherwise stated
Discussion
In USA, poor diet is now the leading cause of poor health, contributing to more than half a million deaths each year.25 In addition, over the past 50 years, food insecurity has replaced hunger as a major contributor to America’s current nutrition crisis.26 The US Department of Agriculture spends $70 billion each year to reduce food insecurity through the SNAP as well as other initiatives; however, participants still experience disparities in the quality of food compared with food-secure households.27 Disparities have also been documented in the prevalence of overweight and obesity, drivers of the progression of T2D, among low-income and racial/ethnic minority populations. For example, obesity and T2D are more common among Hispanic/Latino adults compared with the background population.28 29 For Hispanic/Latino adults living with T2D, we have shown recently that approximately 30% have an HbA1c at or above 9%, putting them at risk of serious complications associated with the condition.30 There is evidence that Hispanics/Latinos in the USA consume a less healthful diet compared with other racial/ethnic groups due in part to less access to healthy foods, food insecurity and low socioeconomic status. The process of acculturation among Hispanic/Latinos may also be associated with suboptimal dietary choices, including low intake of fruits and vegetables.31
Recently, interventions to improve eating behaviours through changes to the built environment have been reported, mainly in low-income neighbourhoods with poor access to affordable healthy food. The interventions have included creating farmers’ markets, changing restaurant menus, and improving access to grocery and corner stores that sell affordable fresh fruits and vegetables. Overall, the results suggest that solely changing the food environment may not necessarily improve eating behaviours for at-risk communities.32 Here, we provided medical prescriptions, signed by a qualified practitioner and at no cost, to adults with or at risk of T2D to improve immediate access to fresh vegetables. The participants were predominantly Hispanic/Latino adults with low levels of acculturation. Over 3 months, we saw improvements in a number of cardiovascular and glycaemic metrics as well as self-reported benefits in participants’ sleep, mood and pain scores. We also found reductions in tortilla and soda consumption. Food security improved over the same time period, as well. There was a reduction in SBP, most notable in the group with a baseline value >130 mm Hg, a threshold risk for hypertension.18 Similarly, in the subgroup with a baseline HbA1c ≥7.0%, HbA1c also fell significantly over the same time period. Although overall weight did not change, there was a significant reduction among female participants. There was also an improvement in waist circumference for the full study population, as well as for women with high-risk baseline waist measurements >88 cm.33 The mechanisms for the improvement in SBP are unknown but may have been a consequence of lower sodium consumption, with vegetables potentially replacing more processed food. Both tortillas and soda are popular in Hispanic/Latino culture,34 35 and the improvement in glycaemia again may have been a result of the self-reported lower consumption of these products as vegetable consumption increased. Elsewhere, others have shown that improving access to fresh vegetables is associated with lowering of HbA1c levels;36 37 however, in those studies, the vegetable interventions were supplemented with diabetes and/or nutrition education. In this study, neither diabetes nor nutrition education was provided. It was notable that in this study, self-reported wastage of vegetables was below the estimated average for food waste in USA.38
Plant-based dietary patterns which encourage increased consumption of vegetables, fruits, whole grains, legumes and nuts may be beneficial in the prevention of T2D.39 In this study, we found significant improvements in HbA1c levels in those with a baseline value above 6.4% and 7.0%, and an improvement in time in range 70–180 mg/dL in those using CGM. The mechanisms involved are unknown but may, in addition to the reduction in soda and tortilla use, also be related to increased consumption of fibre, antioxidants and sulforaphane.39 40 In comparing CGM variables at baseline versus 3 months after HbA1c stratification, we also observed modest improvements in time in range between 70–180 mg/dL and glucose variability in the pre-T2D group, although the sample sizes of the stratified groups were small. It is also noteworthy that published guidelines for the interpretation of CGM data have been based on profiles from individuals with type 1 diabetes and those with insulin-treated T2D.23 Our data suggest there may be a need to update guidelines for populations at risk for T2D and with non-insulin treated T2D such as those investigated here.
We found marked improvements in self-reported measures of sleep, mood and pain. Although this may have been related to less food insecurity, we cannot exclude direct effects from increasing vegetable consumption or a change in the consumption of other foods and beverages. In this study we did not measure consumption of processed and ultraprocessed foods. However, it is recognised that with acculturation, the overall proportion of energy obtained from less healthy foods increases.31 41 Food insecurity is known to be associated with mental health challenges including depression and stress.42 A recent study has suggested that reducing processed food consumption can have psychological benefits.43 Similarly, reducing soda consumption may also have a central effect on mood and other variables through the effects of caffeine in the drinks.44
Limitations of the study
The main limitation of this study was the absence of a control group. Although we cannot rule out an effect of regression to the mean to explain some of the changes in variables, participants did report increased consumption of vegetables and, in the subgroup attending for an additional visit 3 months after the end of the study, there were continued improvements in HbA1c and SBP compared with baseline. We also have no specific data on participant storage, preparation or consumption of the vegetables, and it is recognised that food choices are influenced by acculturation, cultural practices and food preferences. It is noteworthy that the colour of produce appears to be important for Hispanic/Latino adults.45 It is not known whether our findings would be different if we had provided nutrition education. We also used self-reported data without methods to prove validity of the data and whether information was erroneous or misremembered. As mentioned earlier, the comparison of CGM data stratified into subgroups was limited by sample size. Participants did not have access to their real-time glucose levels and therefore it is not known whether unblinded CGM data would have had an impact on participant food preferences and behaviour. Finally, the majority of our participants were female and Hispanic/Latino. We do not know if our findings would be applicable to other US minority populations, especially if the sample size were increased to include more women.
In conclusion, improving access to fresh vegetables through the use of medical prescriptions for vegetables was associated with clinically relevant improvements in cardiometabolic risk factors and well-being for predominantly Hispanic/Latino adults with or at risk of T2D. Recently, there have been proposals to increase the use of this ‘Produce Rx’ approach to reduce food insecurity and also improve the quality of the American diet.25 Our findings yield evidence suggesting that providing economic incentives by using healthy food prescriptions will have significant health gains and be highly cost-effective for USA.11 Going forward, it makes sense to consider strengthening the relationship between the health and agriculture sectors and to consider food-based approaches to address the growing burden of chronic disease in America.
Acknowledgments
The authors thank Abbott Diabetes Care for providing the Freestyle Libre sensors and readers that provided continuous glucose monitoring for this study.
References
Footnotes
Twitter @godiabetesmd
Contributors DK conceived the idea for the study and is guarantor. AL, WB and NG contributed to the protocol development, IRB approval and the conception and design of the work. MK, AL and CC were involved in the recruitment and retention of participants, and data collection. WB, DK, AS and SB performed data analyses. AS supervised SB in the design of the CGM analysis framework. SB built the CGM analysis framework, performed statistical analysis and created the figures. AS and SB undertook analyses of the CGM data. DK drafted the manuscript. All authors contributed to manuscript review and revisions.
Funding Funding for Farming for Life during the study period was provided by the US Department of Agriculture (Grant number: 2018-33800-28404). We would also like to acknowledge funding support from the Hearst Foundation, the Mosher Foundation, Sun Life Financial, the St. Francis Foundation and the Blooming Prairie Foundation. AS and SB were supported by the NSF Engineering Research Center for Precise Advanced Technologies and Health Systems for Underserved Populations (PATHS-UP) (Award #1648451).
Competing interests None declared.
Patient consent for publication Not required.
Ethics approval Independent Review Board (Advarra IRB).
Provenance and peer review Not commissioned; externally peer reviewed.
Data availability statement Data are available upon reasonable request. The investigators agree to share de-identified individual participant data that underlie the results reported in this article, the statistical analysis plan and the study protocol with academic researchers beginning 3 months after publication and ending 5 years following article publication. Proposals should be directed to dkerr@ sansum.org. To gain access, data requestors will need to sign a data access agreement.