Article Text

Abstract
Background On average, Australian adults consume 3500 mg sodium per day, almost twice the recommended maximum level of intake. The Australian government through the Healthy Food Partnership initiative has developed a voluntary reformulation programme with sodium targets for 27 food categories. We estimated the potential impact of this programme on household sodium purchases (mg/day per capita) and examined potential differences by income level. We also modelled and compared the effects of applying the existing UK reformulation programme targets in Australia.
Methods This study used 1 year of grocery purchase data (2018) from a nationally representative consumer panel of Australian households (Nielsen Homescan) that was linked with a packaged food and beverage database (FoodSwitch) that contains product-specific sodium information. Potential reductions in per capita sodium purchases were calculated and differences across income level were assessed by analysis of variance. All analyses were modelled to the Australian population in 2018.
Results A total of 7188 households were included in the analyses. The Healthy Food Partnership targets covered 4307/26 728 (16.1%) unique products, which represented 22.3% of all packaged foods purchased by Australian households in 2018. Under the scenario that food manufacturers complied completely with the targets, sodium purchases will be reduced by 50 mg/day per capita, equivalent to 3.5% of sodium currently purchased from packaged foods. Reductions will be greater in low-income households compared with high-income households (mean difference −7 mg/day, 95% CI −4 to −11 mg/day, p<0.001). If Australia had adopted the UK sodium targets, this would have covered 9927 unique products, resulting in a reduction in per capita sodium purchases by 110 mg/day.
Conclusion The Healthy Food Partnership reformulation programme is estimated to result in a very small reduction to sodium purchases. There are opportunities to improve the programme considerably through greater coverage and more stringent targets.
- blood pressure lowering
- nutrition assessment
Data availability statement
The data that support the findings of this study are available from Nielsen and FoodSwitch, but restrictions apply to the availability of these data, which were used under license for the current study, and so are not publicly available.
This is an open access article distributed in accordance with the Creative Commons Attribution Non Commercial (CC BY-NC 4.0) license, which permits others to distribute, remix, adapt, build upon this work non-commercially, and license their derivative works on different terms, provided the original work is properly cited, appropriate credit is given, any changes made indicated, and the use is non-commercial. See: http://creativecommons.org/licenses/by-nc/4.0/.
Statistics from Altmetric.com
Summary box
What is already known?
Most Australian’s exceed recommended sodium intake levels, contributing to hypertension and cardiovascular disease. The Australian government through the Healthy Food Partnership has released voluntary sodium targets for packaged foods.
What are the new findings?
Assuming food companies complied completely with the targets, sodium purchases will be reduced by 50 mg/day per capita, with greater reductions for the lowest income households. Adopting the UK sodium targets would increase the reduction to 110 mg/day.
What do the new findings imply?
Our findings suggest that the sodium targets developed by the Healthy Food Partnership will not meaningfully reduce sodium purchases. More stringent targets across a broader range of foods are required to achieve a greater impact on the population.
Introduction
High dietary sodium intake is a key contributor to hypertension globally, which is a major cause of cardiovascular disease (CVD) 1 and chronic kidney disease.2 The WHO recognises the importance of reducing population sodium consumption and has set a target to reduce population sodium intake by 30%,3 to ≤2 g/day per person by 2025.4 Despite this, mean population sodium intakes in most countries continue to exceed these recommended levels.5 In Australia, the estimated daily sodium intake is approximately 4 g/day (10 g/day salt) in men and 2.9 g/day (7.5 g/day salt) in women.6 In 2018, 26% of deaths were attributed to CVD, making it a leading cause of death and disability in Australia.7 8
Sodium reformulation targets for packaged, processed foods have been identified as a priority action area for reducing population sodium intake.9–11 In response to this, a growing number of governments around the world have introduced voluntary and mandatory sodium reformulation targets for packaged foods.12 The UK has one of the best-known sodium reformulation programmes, which was originally developed in 2006.13 To date, four sets of voluntary targets have been published (2006, 2009, 2011 and 2014) and each set of targets has been designed to drive gradual stepwise reductions in the sodium content of foods. To date, these targets have contributed to an estimated 15% reduction in population sodium intakes.14
In 2015, the Australian federal government released the Healthy Food Partnership, a public–private partnership between the government, the public health sector and the food industry with the aim of working collaboratively to improve the dietary habits of the population.15–17 As part of this initiative, a voluntary reformulation programme was developed which aimed to ‘establish priorities for food reformulation which may help consumers achieve dietary patterns that are consistent with the Australian Dietary Guidelines and protect and promote good health’.16 In 2020, after 5 years of planning and development, the Healthy Food Partnership released sodium targets for 27 food categories which ranged from 270 mg/100 g for plain corn, rice and other cakes to 1270 mg/100 g for processed cheese (online supplemental table 1).15 16
Supplemental material
Given the potential benefits of sodium reformulation to reduce hypertension and CVD,10 18 it is vital to objectively assess the likely reach and impact of sodium targets. In Australia, the Healthy Food Partnership has previously modelled an 8.7% reduction in potential sodium intakes assuming full adherence to the targets.16 However, this modelling has acknowledged limitations—in particular reliance on dietary survey data collected ~10 years ago and lack of sales data to account for market share of products.16 Since population dietary habits and availability of packaged foods in the food supply are constantly evolving, it is crucial to conduct modelling using more up-to-date data to estimate the potential impact of the Healthy Food Partnership reformulation programme. Furthermore, no prior research has assessed the potential impact of the reformulation targets at the food category or food manufacturer level in Australia. Such data may help to inform both government and food manufacturers as to where the greatest reductions in sodium might be able to be achieved. Moreover, if potential reductions appear to be skewed toward particular food categories and food companies, this may encourage the government to consider prioritising efforts toward sectors of the food supply with the greatest potential for impact.
Within this context, the primary aim of this study was to estimate the impact of the Australian sodium reformulation targets on Australian household sodium purchases, as a proxy for sodium intake. We examined the potential impact overall and for households with different income levels, since prior literature suggests lower income is associated with higher sodium consumption.19–22 As secondary analyses, we compared the potential differences in sodium reduction against the UK targets to gain insight into how the Australian targets compare against these well-established targets with proven success in reducing sodium in the food supply.14 In addition, we modelled the expected reduction in household sodium purchases at both the food category and food company level to estimate where the greatest reductions in sodium purchases can be achieved.
Methods
For this study, we chose 2018 as the year to conduct our analysis because it is prior to 2020 (ie, provides a ‘baseline’ before reformulation efforts begin in Australia) and is the year in which we have access to the Nielsen Homescan dataset.
Patient and public involvement
As this study used secondary data sources, no patients or members of the public were involved in the design or recruitment of the study, or the dissemination of the study findings.
Study population and food purchase data
We used observational panel data from the Nielsen Homescan Consumer Panel for household-level food and beverage purchases over a 12-month period (January 2018–December 2018) in Australia. This is a dataset from a nationally representative cohort of approximately 10 000 Australian households that continuously captures information on grocery purchases, including non-food purchases, throughout the year. New households are recruited to replace those who drop out to ensure the panel remains broadly representative of the sociodemographic and geographical characteristics of the Australian population. The Homescan dataset is used frequently by researchers to examine food and beverage purchasing habits as a proxy for consumption.23–25
The Homescan dataset includes information on sociodemographic and economic characteristics of the households, including ethnicity and education level of the head of the household (main contact), household income and lifestage, and the age and sex of all individuals in the household. Participating households are given electronic barcode scanners that are used to scan the barcodes of all packaged foods and beverages brought into the home from all retail outlets including supermarkets, grocers, convenience stores and pharmacies. To capture regular shopping habits throughout the year and to account for products that are purchased infrequently, we used year-level purchase data by summing all purchases of foods and beverages made during the 2018 calendar year.
Household eligibility criteria were largely based on the standard criteria provided by Nielsen. Households were excluded if: (1) they were not on the panel for the entire 52-week period; (2) they did not report purchase data for at least 50% of the weeks; (3) they were missing any demographic information and (4) Nielsen thresholds for expenditure were not met (≥$A5 a week on all purchases). To account for households possibly under-reporting purchase information for foods and beverages, we further excluded households with the lowest annual food and beverage expenditure (<2.5th percentile defined separately for single-member households and multimember households) (online supplemental figure 1). Nielsen provided sample weights for the included households so estimates could be projected to be representative of purchasing habits of the Australian population.
Nutrition information
To determine the specific sodium content of a product at the time of purchase, each barcoded packaged product within the Homescan dataset was linked with its corresponding nutrition information panel (NIP). This was performed using the 2018 FoodSwitch annual database.26 The FoodSwitch annual database contains nutrient information obtained directly from the NIP of all packaged food and beverage products available for sale from five large supermarket retailers in Sydney, Australia (Woolworths, Coles, Aldi, IGA and Harris Farm). Data were collected by trained personnel during the months of August–November in 2018. For each product, the product name, package size (g) and nutrient content per 100 g or mL and per serve were recorded. Using the categorisation system developed by the Global Food Monitoring Group, foods and beverages in FoodSwitch were classified into a hierarchical category tree to allow for comparison of nutritionally similar foods.27–29
Matching products across databases
Packaged food and beverage products in the Nielsen dataset were linked with their corresponding NIP data from FoodSwitch to obtain the sodium content at the time of purchase. Initial matching of Nielsen Homescan to FoodSwitch was carried out using the unique barcode associated with each product. A total of 22 721 products were matched, which accounted for 83% of the quantity of product units purchased by the households. To further improve the coverage of products purchased by eligible households, we applied a series of additional matching steps using previously described methods.30 This included linking products across databases by (1) product name, (2) product name following removal of nutritionally irrelevant descriptors, for example, grated, sliced, shredded and (3) applying sodium values to single ingredient foods such as honey, eggs and oils, using the category mean from FoodSwitch. Using these methods, the number of all unique products in the Nielsen Homescan database that matched to FoodSwitch was 26 728, representing 89% of the quantity of all units purchased by the households in 2018. Non-matched products were excluded from the analysis. Non-match rates were similar across food categories.
Modelled sodium reduction scenarios
The first step in our modelling analyses was to map the 27 food categories targeted as part of the Healthy Food Partnership to the FoodSwitch dataset to identify products that fell within each of the targeted categories. This also allowed us to identify the proportion (%) of products purchased by Australian households in 2018 that already met the targets, as a way of understanding the scope of the reformulation programme.
Next, we modelled the potential reductions to Australian household sodium purchases. Current levels of household sodium purchases were compared with a ‘best-case’ scenario whereby all foods in a targeted category were reformulated to meet the targets.15 Foods with a sodium content at or below the target retained their existing sodium content, and foods with sodium content above the target had the sodium content hypothetically reformulated to the category-specific sodium target. For example, in the pizza category where the target is 450 mg/100 g, if a product had a current sodium content of 550 mg/100 g, then we assumed it would be reformulated to 450 mg/100 g. Conversely, if a pizza had a sodium level of 300 mg/100 g, then we assumed its sodium content would remain the same. To date, there are few studies that have examined the impact of reformulation on food choices and purchasing behaviours.10 31 Therefore, we were unable to account for any potential effects of reformulation on food purchase behaviour in our modelling scenario; hence, we assumed that food purchasing habits would not be affected (ie, baseline packaged food purchases would remain unchanged).
The same approach was then applied to model the potential impact of the UK salt reduction programme in the Australian context,13 that is, full adoption of the 76 targets, some of which overlap with the food categories covered by the Australian programme (online supplemental table 2). The current UK targets were introduced in 2014 to extend previous targets set in 2006, 2009 and 2011.13 32
Food company classification
Food companies were categorised using Nielsen classifications, which map at the ‘highest level’ parent food company. This is done by mapping the ownership of subsidiary companies (ie, brands) by parent companies using internet searches, internal consistency checks and direct contact with food companies. For the purpose of this study, we distinguished the food companies into ‘manufacturers’ and ‘retailers’. Manufacturers were classified as national and international food companies that manufacture and distribute items (also known as ‘branded products’) for general trade, whereas retailers were classified as supermarket retailers that sell their own ‘private-label’ products (also known as ‘own brand’ or ‘generic’) exclusively in their own stores.33
Statistical analysis
All statistical analyses were performed using Stata V.16.0 (StataCorp). A p value of <0.05 was considered statistically significant.
We calculated current sodium purchases per capita, that is, the amount of sodium in milligrams (mg) purchased daily per person, by dividing total household sodium purchases per year, by 365 days, and by the number of individuals within the household. We also calculated sodium purchases per capita with reformulation targets applied to assess how much sodium Australians would acquire each day after adoption of the targets. Using the prereformulation and postreformulation purchases, we calculated the change in mean sodium purchases per capita as the difference between the two.
We also explored changes to mean sodium purchases per capita by household income level. Households were categorised into three income groups (low, middle or high income) of approximately equal numbers based on gross equivalised income.34 35 This equated to <$A28 667 per year for low-income households, $A28 846–52 778 per year for middle-income households and >$A53 125 per year for high-income households. Differences in reductions to per capita sodium purchases were assessed using 1-factor analysis of variance test with post-hoc tests.
We also compared potential differences in reductions to sodium purchases (mg/day per capita) between the Australian reformulation programme and the UK programme. This was calculated and compared for (1) products with an Australian or UK target, (2) products with both an Australian and UK target, (3) products with an Australian target only and (4) products with a UK target only.
Lastly, we calculated potential reductions in sodium purchases per capita (mg) per day coming from each of the food categories with a sodium target and for each of the top 10 food companies that contributed to total sodium purchases across all packaged foods and beverages in 2018. Descriptive data are presented across each food category and for each of the 10 companies, with the remainder of the companies grouped as ‘other’.
All analyses and outcomes were modelled to the Australian population in 2018 to ensure our data accurately represents household purchasing habits in the Australian population, using sample weights provided by Nielsen. The sample weights were based on Australian census data pertaining to household size, location, lifestage and income.36
Results
Household characteristics
Of the 11 056 households in the Nielsen Homescan panel in 2018, 3868 were excluded for not meeting eligibility criteria, leaving 7188 households for our analyses. The main shopper in the household predominately consisted of women (68%). Most households consisted of persons living in one or two-person households (57%), which closely aligned with the 2016 census data (58%).36 The most common family composition was older families with children aged 11–17 years old (41%) and older singles and couples (all adults >45 years) (24%). One-third of households were from New South Wales (33%) followed by Victoria (25%) and Queensland (20%), similar to the household location characteristics of the Australian population.36
Overall impact of the Australian targets on per capita sodium purchases
The Healthy Food Partnership sodium reformulation targets applied to 4307 unique products, which accounted for 16.1% of all unique packaged food products. This represented 22.3% of all packaged foods and beverages purchased by Australian households in 2018 (table 1). In 2018, almost half of all these products (47%) met the targets, which ranged from 6% for frankfurts and saveloys to 93% for plain corn, rice and other cakes. Overall, the total sodium acquired from these targeted food categories was 443±0.1 mg/day per capita, representing 30.7% of all sodium purchased from packaged foods and beverages in 2018 (1443±0.3 mg/day per capita). This was predominately attributed to purchases of leavened breads (95 mg/day per capita), cheddar style cheeses (57 mg/day per capita), bacon (28 mg/day per capita) and sausages (27 mg/day per capita) (table 1).
Modelled impact of the Australian sodium reformulation programme
It was estimated that if food companies were to reformulate all existing products to the meet the sodium targets this would reduce mean sodium purchases by 50 mg/day per capita, representing an 11.3% reduction in sodium purchases from these 27 food categories (n=4307 foods) and a 3.5% reduction in sodium purchases from all packaged foods and beverages (n=26 728). It was also estimated that the targets would result in a 15% greater reduction in per capita sodium purchases for low-income households compared with high-income households (−7 mg/day, 95% CI −4 to −11 mg/day, p<0.001) (table 2). This greater reduction in sodium purchases for low-income households compared with high-income households was attributable to a greater reduction in sodium across a broad range of food categories, rather than concentrated in specific categories.
Modelled impact of the Australian reformulation sodium programme on changes in total sodium purchases (mg/day per capita), by income level
Comparison of estimated impact of Australian and UK targets
The UK sodium reformulation programme would apply to twice as many products as the Australian programme, covering 9927 unique products and accounting for 45% of all packaged foods and beverages purchased in 2018. More than half of these products (62.0%) already met the UK targets. It was estimated that if food companies were to reformulate all existing products to the UK sodium targets, this would double the impact compared with the Australian targets resulting in a mean reduction of 110 mg/day per capita. This would represent an 8% reduction in total sodium across all packaged foods and beverage purchases.
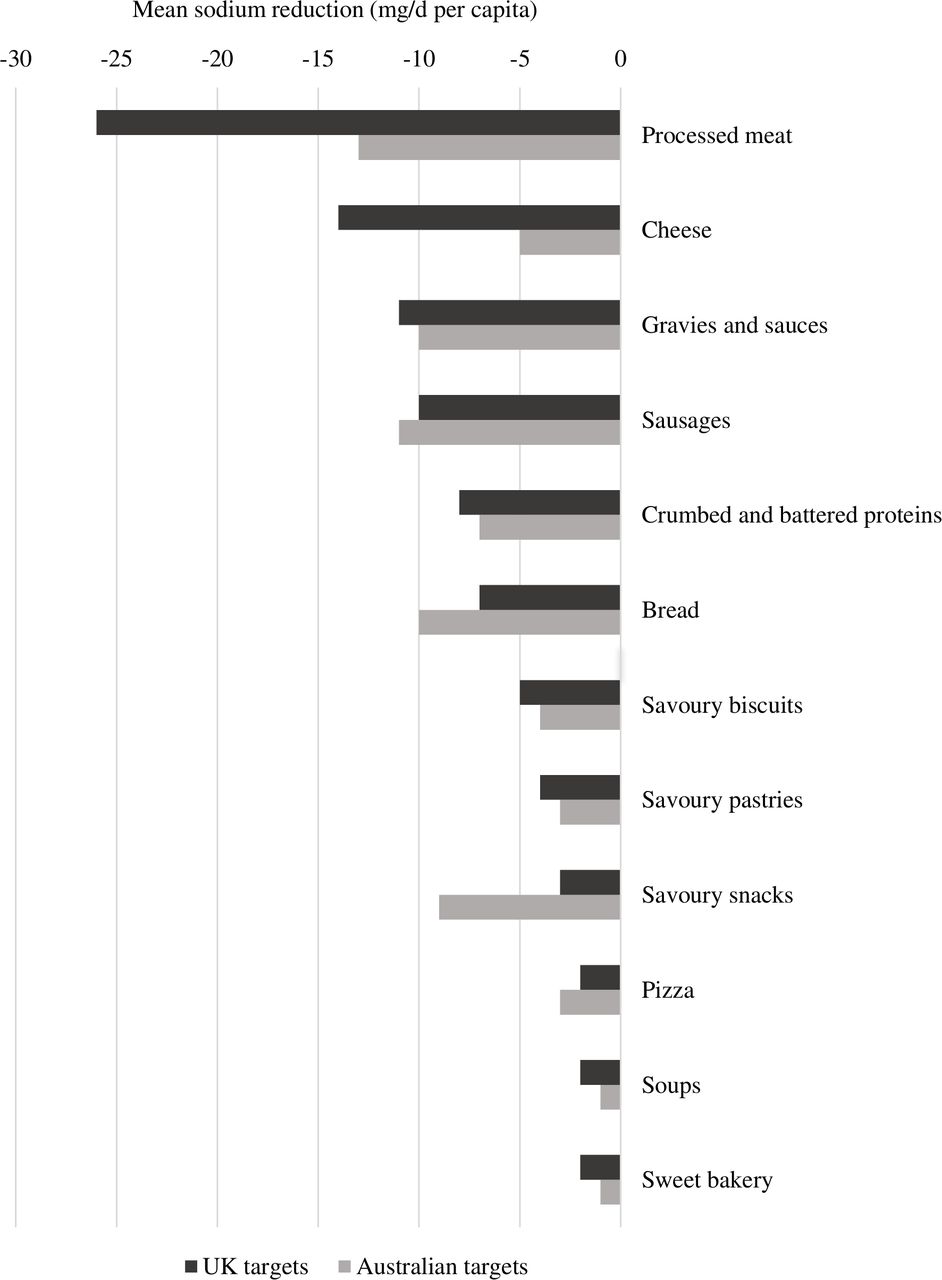
To gain further insight into why the UK targets have greater potential to reduce household sodium purchases compared with Australia, we conducted additional analyses assessing the scope (number of categories with a reformulation target) as well as extent of reformulation required (the level of sodium targets) across the two programmes. In terms of scope, most products targeted within the Healthy Food Partnership reformulation programme were also targeted by the UK reformulation programme, except for bread and cake mixes (n=152 unique products) (online supplemental table 3). The sodium content levels of the targets were largely comparable across the two countries for most food categories (online supplemental table 3). This resulted in similar modelled reductions in mean sodium purchases across food categories included in both the Australian and UK programmes (figure 1). Compared with the Australian programme, the UK targets achieved a slightly greater (3 mg/day per capita) modelled reduction in sodium for the food categories included in both programmes (online supplemental table 3). The UK programme has also set targets for additional food categories that are not covered by the Healthy Food Partnership, such as canned vegetables and table sauces (online supplemental table 4). Almost all of the additional sodium reduction (58 mg/day per capita) come from these extra food categories included as part of the UK programme.

Comparison of the modelled impact of the Australian reformulation programme versus the UK programme on potential reductions to mean sodium purchases (mg/day per capita), across specific food categories. Results are displayed for the products that share both an Australian and UK target across each of the 12 food categories targeted as part of the Australian reformulation programme (collapsed from 27 subcategories). Reductions across the 27 subcategories are displayed in online supplemental table 5. Overall, the UK reformulation programme achieved twice as much of a reduction in mean sodium purchases (50 mg/day vs 110 mg/day).
Impact of reformulation targets on sodium purchases by food category and by food company
Across the 27 food categories targeted as part of the Healthy Food Partnership sodium reformulation programme, the mean reductions were projected to be largest for sausages (7 mg/day per capita), flat breads (5 mg/day per capita), extruded and pelleted snacks (4 mg/day per capita) and leavened breads (4 mg/day per capita) (online supplemental table 5). For 21 of the 27 food categories, mean reductions were estimated to be only 2 mg/day or less per capita.
In 2018, 323 food companies sold products that fell within the sodium reformulation target categories. Together, the top 10 companies contributed to 70% of all sodium purchased from these food categories (table 3). The three largest contributors to sodium purchases were grocery retailers, each contributing 13%–15% of all sodium purchased from these food categories. Across the top 10 companies, approximately 40% of all products purchased by Australian households in 2018 already met the sodium targets, although the compliance rates across companies varied widely, ranging from 10% to 64% (table 3). It was estimated that with full adoption of the targets, 60% (30 mg/day per capita) of the potential reductions to sodium would be achieved by the top 10 food companies.
Impact of the Australian sodium reformulation programme on purchases of sodium across the top 10 food companies that contribute most to sodium purchases
Discussion
The present study demonstrated that if all food companies were to reformulate their products to meet the Healthy Food Partnership sodium targets, this would reduce sodium purchases by 50 mg/day per capita, representing a 3.5% reduction in sodium purchases from packaged foods. Assuming that Australian adults currently consume on average ~3500 mg of sodium per day,6 37 then the change in sodium purchase will likely equate to only ~1.4% reduction in daily sodium consumption. Disappointingly, this suggests that in its present form, the reformulation programme is unlikely to deliver any meaningful reductions to sodium intake for the Australian population, despite a 5-year long process of planning and development.
Our modelling results suggest that one way for the Healthy Food Partnership to substantially enhance its impact on population sodium intake could be to simply adopt the existing UK reformulation targets. Such an approach should be relatively feasible, since the countries have comparable food supplies in terms of types of food available for sale and their nutritional quality38; and we demonstrated that reformulation targets could be readily mapped across countries. Moreover, this approach would have been hugely time-and-cost saving for the government and key stakeholders and would have started delivering health benefits for consumers much sooner. However, it is important to note that even full adoption of these targets would still be insufficient in reducing sodium intakes to recommended levels (considering the Australian population needs to reduce current average sodium intakes by approximately 40% to reach the suggested dietary target of 2000 mg39).
Our study found that mean sodium purchases from packaged foods and beverages (including table salt) equated to 1443 mg/day per capita. Assuming mean sodium intakes are ~3500 mg/day, this suggests that sodium from packaged foods accounts for 41% of sodium intakes. However, similar to dietary intake data, prior research suggests that sales data can underestimate purchases by 10%–20%.40 41 Taking into account of such potential underestimation, this suggests that packaged foods and beverages could account for up to ~50% of sodium intakes. Considering we have accounted for purchases of discretionary salt in our analyses, this suggests that the remaining ~50% of sodium is most likely to come from restaurants, take-away outlets and fresh food markets including bakeries, butchers, green grocers and local markets. This result generally aligns with results from a recent study in Australia which found that just over half (51%) of sodium in the diet is obtained from foods purchased from food stores (eg, grocery/supermarket/convenience stores) followed by 28% from restaurants and take-away outlets and 9% from fresh food markets (with the remaining largely from water and freshly grown/caught food).42 Together, these findings highlight that while a national reformulation programme targeting packaged foods and beverages is undoubtedly important, there is also a strong need for additional initiatives that focus on other aspects of the food supply that contribute to sodium intakes, particularly takeaway foods. This strategy of regulation has already been adopted by the UK through the introduction of reformulation targets for the out-home-sector,13 followed soon by the US Food and Drug Administration who are currently developing sodium targets for restaurant foods.43
Considering sodium reductions have been achieved by a number of manufacturers worldwide in response to sodium targets (such as seen in the UK14) and the fact that technologies exist to meet the functional properties of sodium,44 it is technically feasible for manufacturers to reduce the sodium content of their product lines. A key element to the success of these voluntary targets is effective implementation—since poor compliance by food manufacturers will compound the already small levels of reductions achievable with the current Healthy Food Partnership targets. Prior literature suggests that media pressure, strong political engagement and monitoring of progress need to be present.14 32 Without such measures, there is little incentive for the food industry to comply with the targets, particularly if there is no consequence for non-compliance.45 Whether such accountability measures will be introduced in Australia are yet to be seen, however, they were largely absent in the Food and Health Dialogue (the predecessor to the Healthy Food Partnership), which resulted in mixed levels of compliance across food companies.45–49 If such voluntary efforts fail to result in action, other methods of implementation should be considered, such as mandatory targets, as seen in other countries such as South Africa and Argentina.12
One of likely reasons for the limited impact of the targets, as modelled in this study, is that almost 50% of all relevant products purchased by Australian households in 2018 already met the sodium reformulation targets. However, when the Healthy Food Partnership sodium targets were designed, they were intended to be set at a level so only one-third of products would already have a sodium level at or below the targets. This was to ensure the targets were appropriate and feasible (ie, if approximately one-third of products already meet a target, then it was considered technically feasible for the remaining two-thirds to reformulate).16 There are several potential reasons for why the sodium targets did not achieve this intended aim. First, the targets were set using sodium information from FoodTrack (2015–2017),50 a nutrition composition database with relatively limited market coverage.51 Prior research has shown that the source of sodium content information has an impact on target setting, with FoodTrack resulting in more conservative sodium targets compared with FoodSwitch (which has four times the product coverage).51 Moreover, the reformulation targets were designed without having access to purchase-weighted data to account for consumer purchasing habits.16 Through using a comprehensive nutrition database alongside purchase data, our findings illustrate that more stringent targets are needed to ensure that only one-third of products meet the targets, therefore requiring a greater proportion of products to reformulate.
Prior literature has demonstrated socioeconomic disparities in diet, particularly in regard to sodium intake, which may influence the disproportionate burden of diet-related CVD among disadvantaged socioeconomic groups.19–22 52 53 Although the relatively greater reduction in household sodium purchases for lower socioeconomic groups is very modest and unlikely to be clinically meaningful, our analyses suggest that the Healthy Food Partnership reformulation programme at least has the potential to result in greater relative reductions in sodium purchases for low-income households. The differential impact of the programme according to income level appears to be driven by low-income households purchasing a higher amount of sodium from targeted packaged foods at baseline. Future modelling studies should assess whether further broadening the scope and extent of reformulation of the Healthy Food Partnership reformulation programme could result in reduced inequalities in CVD disease burden between socioeconomic groups.
Regardless of the overall poor impact of the Healthy Food Partnership reformulation programme, our findings highlight the likely critical importance of dominant food companies complying with the reformulation targets to most effectively achieve potential sodium reductions. For instance, prioritising government resources to engage and encourage the top food 10 companies to fully comply with the current reformulation programme (representing just 3% of all companies) is estimated to result in 60% of the total reductions achievable. The supermarket retailers appear particularly crucial in this regard, due to the large volume of private label products that they sell.
A major strength of this study was our use of a comprehensive dataset of packaged food purchases from a representative sample of Australian households. Moreover, we were able to match product-specific sodium content information collected at the time of purchase ensuring our results reflected both contemporary Australian households purchasing habits and accurate nutritional composition. This information allowed us to realistically estimate the potential impact of reformulation on sodium purchases at both the food category and company level. As such, this paper provides a novel assessment of the reformulation programme on sodium purchases and provides important insights into how the targets can be improved, accounting for market share and purchasing habits of Australians. Moreover, our comparison to the UK targets enables us to provide recommendations based on a real-world case study, rather than theoretical recommendations that may not be feasible or realistic.
Key limitations should also be considered. Our results have estimated the impact of reformulation targets on sodium purchases and therefore any comparison and/or translation to intake should be interpreted with caution. Similar to dietary intake data, the Nielsen Homescan dataset is likely to have issues with under-reporting, which has been previously estimated to be around 10%–20% of all purchases.40 41 Such under-reporting likely caused modest underestimates in sodium purchases and consequent reductions. It is also likely we have further underestimated true household sodium purchases due to the unmatched products (products that did not match across the databases), which were dropped from the analysis. Although this underestimation is likely small since only 11% of the products purchased in 2018 were not matched to the FoodSwitch database. Moreover, this study assessed the potential reductions in sodium purchases with full adoption of the targets. We acknowledge that achieving these maximal reductions is optimistic considering previous adoption uptake of voluntary targets in Australia,45–47 and in reality, voluntary compliance with the reformulation programme means its actual impact on population sodium intake is likely even lower than our estimates. It is also possible that errors may have been introduced during the matching across Nielsen and FoodSwitch databases, particularly during the additional matching steps. However, we attempted to minimise the risk of potential error by using the unique barcode to match the majority of products and analysing data from the same time period. Lastly, considering our study analysed packaged food and beverages available in Australia and purchased by Australian households, our findings may not be generalizable to all countries, particularly those with very a different food supply and dietary habits.
In conclusion, using a nationally representative sample of Australian households, we estimated that full adoption of the Healthy Food Partnership reformulation programme could reduce sodium purchases by 50 mg/day per capita, equivalent to 3.5% of sodium currently purchased from packaged foods. Per capita reductions to sodium purchases would likely double if Australia were to expand the scope of the reformulation programme through the inclusion of the additional food categories that are targeted as part of the UK reformulation programme. While a reformulation programme has the potential to substantially reduce sodium intake and CVD burden in Australia, our findings suggest that as its currently designed, the sodium targets developed by the Healthy Food Partnership will not meaningfully reduce sodium purchases.
Data availability statement
The data that support the findings of this study are available from Nielsen and FoodSwitch, but restrictions apply to the availability of these data, which were used under license for the current study, and so are not publicly available.
Ethics statements
Ethics approval
This project was approved by the University of New South Wales Human Research Ethics Committee (approval number HC180965). All participants originally gave informed consent to participate in the Nielsen Homescan Panel including consent for their data to be used for future research purposes.
Acknowledgments
The authors thank Luke Starick and Phil Turnbull from Nielsen for their assistance and provision of Homescan data.
References
Supplementary materials
Supplementary Data
This web only file has been produced by the BMJ Publishing Group from an electronic file supplied by the author(s) and has not been edited for content.
Footnotes
Twitter @daisyhcoyle
Contributors DC, MS, BN, KT and JW designed the research. DC and JW conducted research. SM and MS provided essential databases. MS and DC analysed data. DC and JW wrote paper. DC had primary responsibility for final content. All authors provided critical feedback on the manuscript and read and approved the final manuscript.
Funding This work was supported by an NHMRC Partnership Project (APP1167745) and an NHMRC Centres of Research Excellence (CRE) grant (APP1117300).
Disclaimer The content is solely the responsibility of the authors and does not necessarily reflect the official views of the NHMRC.
Competing interests None declared.
Provenance and peer review Not commissioned; externally peer reviewed.
Supplemental material This content has been supplied by the author(s). It has not been vetted by BMJ Publishing Group Limited (BMJ) and may not have been peer-reviewed. Any opinions or recommendations discussed are solely those of the author(s) and are not endorsed by BMJ. BMJ disclaims all liability and responsibility arising from any reliance placed on the content. Where the content includes any translated material, BMJ does not warrant the accuracy and reliability of the translations (including but not limited to local regulations, clinical guidelines, terminology, drug names and drug dosages), and is not responsible for any error and/or omissions arising from translation and adaptation or otherwise.