Article Text

Abstract
Background The association between intake of fruit and vegetables and their subtypes, and the risk of type 2 diabetes has been investigated in several studies, but the results have been inconsistent.
Objective We conducted an updated systematic review and dose–response meta-analysis of prospective studies on intakes of fruit and vegetables and fruit and vegetable subtypes and the risk of type 2 diabetes.
Design PubMed and Embase databases were searched up to 20 October 2020. Prospective cohort studies of fruit and vegetable consumption and type 2 diabetes mellitus were included. Summary relative risks (RRs) and 95% CIs were estimated using a random effects model.
Results We included 23 cohort studies. The summary RR for high versus low intake and per 200 g/day were 0.93 (95% CI: 0.89 to 0.98, I2=0%, n=10 studies) and 0.98 (95% CI: 0.95 to 1.01, I2=37.8%, n=7) for fruit and vegetables combined, 0.93 (95% CI: 0.90 to 0.97, I2=9.3%, n=20) and 0.96 (95% CI: 0.92 to 1.00, I2=68.4%, n=19) for fruits and 0.95 (95% CI: 0.88 to 1.02, I2=60.4%, n=17) and 0.97 (95% CI: 0.94 to 1.01, I2=39.2%, n=16) for vegetables, respectively. Inverse associations were observed for apples, apples and pears, blueberries, grapefruit and grapes and raisins, while positive associations were observed for intakes of cantaloupe, fruit drinks, fruit juice, brussels sprouts, cauliflower and potatoes, however, most of these associations were based on few studies and need further investigation in additional studies.
Conclusions This meta-analysis found a weak inverse association between fruit and vegetable intake and type 2 diabetes risk. There is indication of both inverse and positive associations between intake of several fruit and vegetables subtypes and type 2 diabetes risk, however, further studies are needed before firm conclusions can be made.
- Diabetes mellitus
Data availability statement
Data are available on reasonable request. Analytical datasets and Stata do-files are available from DA (d.aune@imperial.ac.uk) on reasonable request.
This is an open access article distributed in accordance with the Creative Commons Attribution Non Commercial (CC BY-NC 4.0) license, which permits others to distribute, remix, adapt, build upon this work non-commercially, and license their derivative works on different terms, provided the original work is properly cited, appropriate credit is given, any changes made indicated, and the use is non-commercial. See: http://creativecommons.org/licenses/by-nc/4.0/.
Statistics from Altmetric.com
What this paper adds
In this systematic review and meta-analysis of 23 cohort studies we found that high vs. low intakes of fruit and vegetables combined and fruit were associated with a 7% reduction in risk of type 2 diabetes.
There was suggestive evidence that intakes of apples, blueberries, grapefruit, grapes and raisins were associated with reduced type 2 diabetes risk, while positive associations were observed for intakes of fruit drinks, fruit juice, cantaloupe, potatoes, and some subtypes of cruciferous vegetables.
Diets high in fruit and vegetables may be important for the prevention of type 2 diabetes and it may be important to emphasize specific subtypes to reduce risk.
Introduction
The prevalence of type 2 diabetes has increased rapidly over the past decades, and in 2019, approximately 463 million adults aged 20–79 years were living with diabetes. If current trends continue the prevalence is estimated to pass 700 million by 2045.1 As type 2 diabetes contributes to blindness, neuropathies, nephropathies, cardiovascular disease, cancer and premature mortality,2 3 the increasing prevalence has a considerable impact on public health globally.4
Although several studies have suggested that a high intake of fruit and vegetables is associated with a reduced risk of type 2 diabetes,5–9 associations have often been weak or modest, and several other studies have found no clear association.10–16 The evidence has been slightly more consistent in showing an inverse association between fruit intake and type 2 diabetes,6–10 12–23 than for vegetables.5 6 8 9 11 13–20 22–24 In addition, some studies have suggested that specific types of fruits and vegetables may be more strongly associated with reduced risk of type 2 diabetes than overall fruit and vegetable intake. Inverse associations have been observed between the intake of apples/pears,10 25–27 berries,5 6 8 25 27 green leafy vegetables,8 9 11 yellow vegetables,9 15 root vegetables6 and tomatoes9 and the risk of type 2 diabetes, however, the available data have not been entirely consistent. In contrast, studies on intakes of fruit juice and potatoes and type 2 diabetes risk have tended to show increased risk8 21 28 or no association,11 13 23 29 although one study reported an inverse association with intake of potatoes.30
While several meta-analyses have previously been published on fruit and vegetable intake and type 2 diabetes risk6 11 31–35 most have only analysed a few specific fruit and vegetable subtypes.6 11 23 33 For example, Cooper et al only considered green leafy vegetables and root vegetables,6 Jia et al only considered citrus fruits and cruciferous vegetables,36 Chen et al only considered green leafy and cruciferous vegetables11 and Guo et al only considered apples and pears.31 The most recent meta-analysis by Schwingshackl et al only investigated total fruit and total vegetable intake,34 while a recent umbrella review found moderate evidence of a small inverse association for total fruits and for total vegetables, however, not all subtypes of fruits and vegetables were analysed.37 Sixteen additional cohort studies7 10–12 17–19 21 23 29 38–43 have been published since these meta-analyses came out, thus we conducted a comprehensive and up-to-date systematic review and meta-analysis of prospective observational studies on intakes of fruit and vegetable and subtypes of fruit and vegetables and the risk of developing type 2 diabetes.
Methods
Search strategy
We conducted a systematic search of PubMed and Embase databases (without employing search filters) up to 20 October 2020 for eligible prospective cohort studies examining the association between the intake of fruit and vegetables and risk of type 2 diabetes. Two authors (REH and ME) screened the references in both databases independently. The search strategy used is shown in online supplemental table 1. The reference lists of retrieved articles were also scrutinised. There were no language restrictions.
Supplemental material
Study selection
Studies were included if they had a prospective cohort, a case-cohort or a nested case–control design and investigated the association between the intake of fruit and/or vegetables, subtypes of fruit and vegetables, fruit juices and/or fruit drinks and risk of type 2 diabetes. The participants had to be free from type 2 diabetes at baseline. Multivariable adjusted risk estimates (relative risks (RRs), or ORs, HRs) with their corresponding 95% CIs had to be available in the publication. Intake levels for the different exposures, in addition to total number of cases and person-years, had to be available for the dose–response analyses.
If duplicate reports from the same study cohort were identified, the study with most cases was included. Both the EPIC-InterAct Study6 and the European Prospective Investigation into Cancer and Nutrition (EPIC)-Elderly Greece Study20 were included as Greece is not a part of the EPIC-InterAct Study. ME and REH conducted the literature screening and study selection in duplicate. The excluded studies are listed in online supplemental table 2.
Data extraction
The following data were extracted from each study: the first author’s last name, publication year, geographic location, name of the study, recruitment and follow-up period, sample size, age, sex, number of cases, dietary assessment method including number of food items assessed and whether it has been validated, outcome assessment, exposure, quantity of the exposure, RRs and 95% CIs for the association, and confounders adjusted for in the analysis. We used the RR that reflected the greatest degree of adjustment for confounding variables. Data extraction was done by one of the authors (REH) and double-checked by a second author (ME). Three publications21 43 44 included data from multiple cohorts and results from each cohort were used rather than the pooled results. Standard criteria for the reporting of meta-analyses of observational studies, the MOOSE criteria and the Preferred Reporting Items for Systematic Reviews and Meta-Analyses statement, were followed in this meta-analysis.45 46
Study quality assessment
Two authors (ME and REH) independently assessed all included studies using a modified version of the Newcastle-Ottawa Scale (NOS) to evaluate study quality,47 which allowed a total score from 0 to 8 points, and we considered a total score of 0–3, >3–6 and >6–8 indicating low, medium and high study quality, respectively. The score was modified by (1) deleting the point about representability, which is not really relevant for study quality, (2) giving 0.25 points per confounder that was adjusted for, up to a maximum of 2 points, rather than 1 point for each of two confounders, as studies could have adjusted only for age and sex and still be given maximum score in spite of being prone to confounding and (3) by refining the scoring for the outcome assessment so that studies only using registry linkage scored 0.5 point and those with independent assessment/validated assessment scored 1 point.
Statistical methods
The random effects model by DerSimonian and Laird, which take into account heterogeneity within and between studies, was used to calculate summary RRs and 95% CIs for the association between fruit and vegetable intake and type 2 diabetes.48 A two-tailed p<0.05 was considered statistically significant.
The method of Greenland and Longnecker was used for the linear dose–response analysis and study specific slopes (linear trends) and 95% CIs were computed from the natural logarithm of the RRs across categories of fruit and vegetable intake.49 For studies that did not report the distribution of cases or person-years, this was estimated using the total number of cases or person-years. If studies reported fruit and vegetable intake in ranges and had missing data on median or mean intake for each category of intake, we calculated the average of the upper and lower boundaries of each category which was used as a midpoint in each category. In studies where the highest or lowest category was open ended, the open-ended interval length was assumed to be the same as the adjacent interval. Four studies14 17 50 51 presented data separately for men and women, and a fixed effects model was used to pool the results in order to obtain an overall risk estimate for men and women combined in these studies. For the China Kadoorie Biobank Study by Du et al,7 we estimated missing 95% CIs by using the formula log(RR)±1.96 × SE before transforming the numbers back to non-logarithmic scale. In studies where serving size was specified, this was used. Otherwise, in accordance with other meta-analyses, we used a serving size of 80 g for fruit and vegetable intake,6 34 and 250 mL for fruit juice and fruit drinks.32 For subtypes of fruit and vegetables we used serving sizes based on the pooled analysis by Lee et al 41 (online supplemental table 3). We contacted the authors of two studies22 30 to obtain missing information on cut-off values or median intake on different exposures, CIs and adjustments, and received detailed information from one author.22 The other study30 was excluded. We additionally obtained data on intake of berries overall (results for specific types of berries were reported in the original paper) from one study.21
Non-linear dose–response analyses were conducted using restricted cubic splines with three knots at 10%, 50% and 90% centiles of the distribution, which were then combined using multivariable meta-analysis.52 53 Heterogeneity between studies was evaluated with Q and I2 statistics,54 ranging from 0% to 100%. Subgroup and meta-regression analyses stratified by study characteristics were conducted for fruit and vegetable exposures with at least eight studies in the analysis. Subgroup analyses were conducted stratified by duration of follow-up, gender, geographical location, number of cases, study quality and adjustment for confounding factors to investigate sources of heterogeneity. Publication bias was assessed using Egger’s test55 and funnel plots were inspected for asymmetry when there were at least eight studies in the analysis. A p≤0.1 indicated presence of publication bias. When there was evidence of publication bias, we explored whether this was driven by one or a few outlying studies and conducted sensitivity analyses excluding such studies to see if the test for publication bias was attenuated, and also whether the summary estimate was altered. We also considered using the trim-and-fill method,56 however, no studies were added to the analyses when using this method and thus we only report results from the previously mentioned sensitivity analyses. The robustness of the findings was tested in sensitivity analyses excluding one study at a time from the meta-analysis to clarify whether the results were driven by one very large study or a study with an extreme result. The statistical analyses were conducted using the software package Stata, V.15.1 (StataCorp).
Results
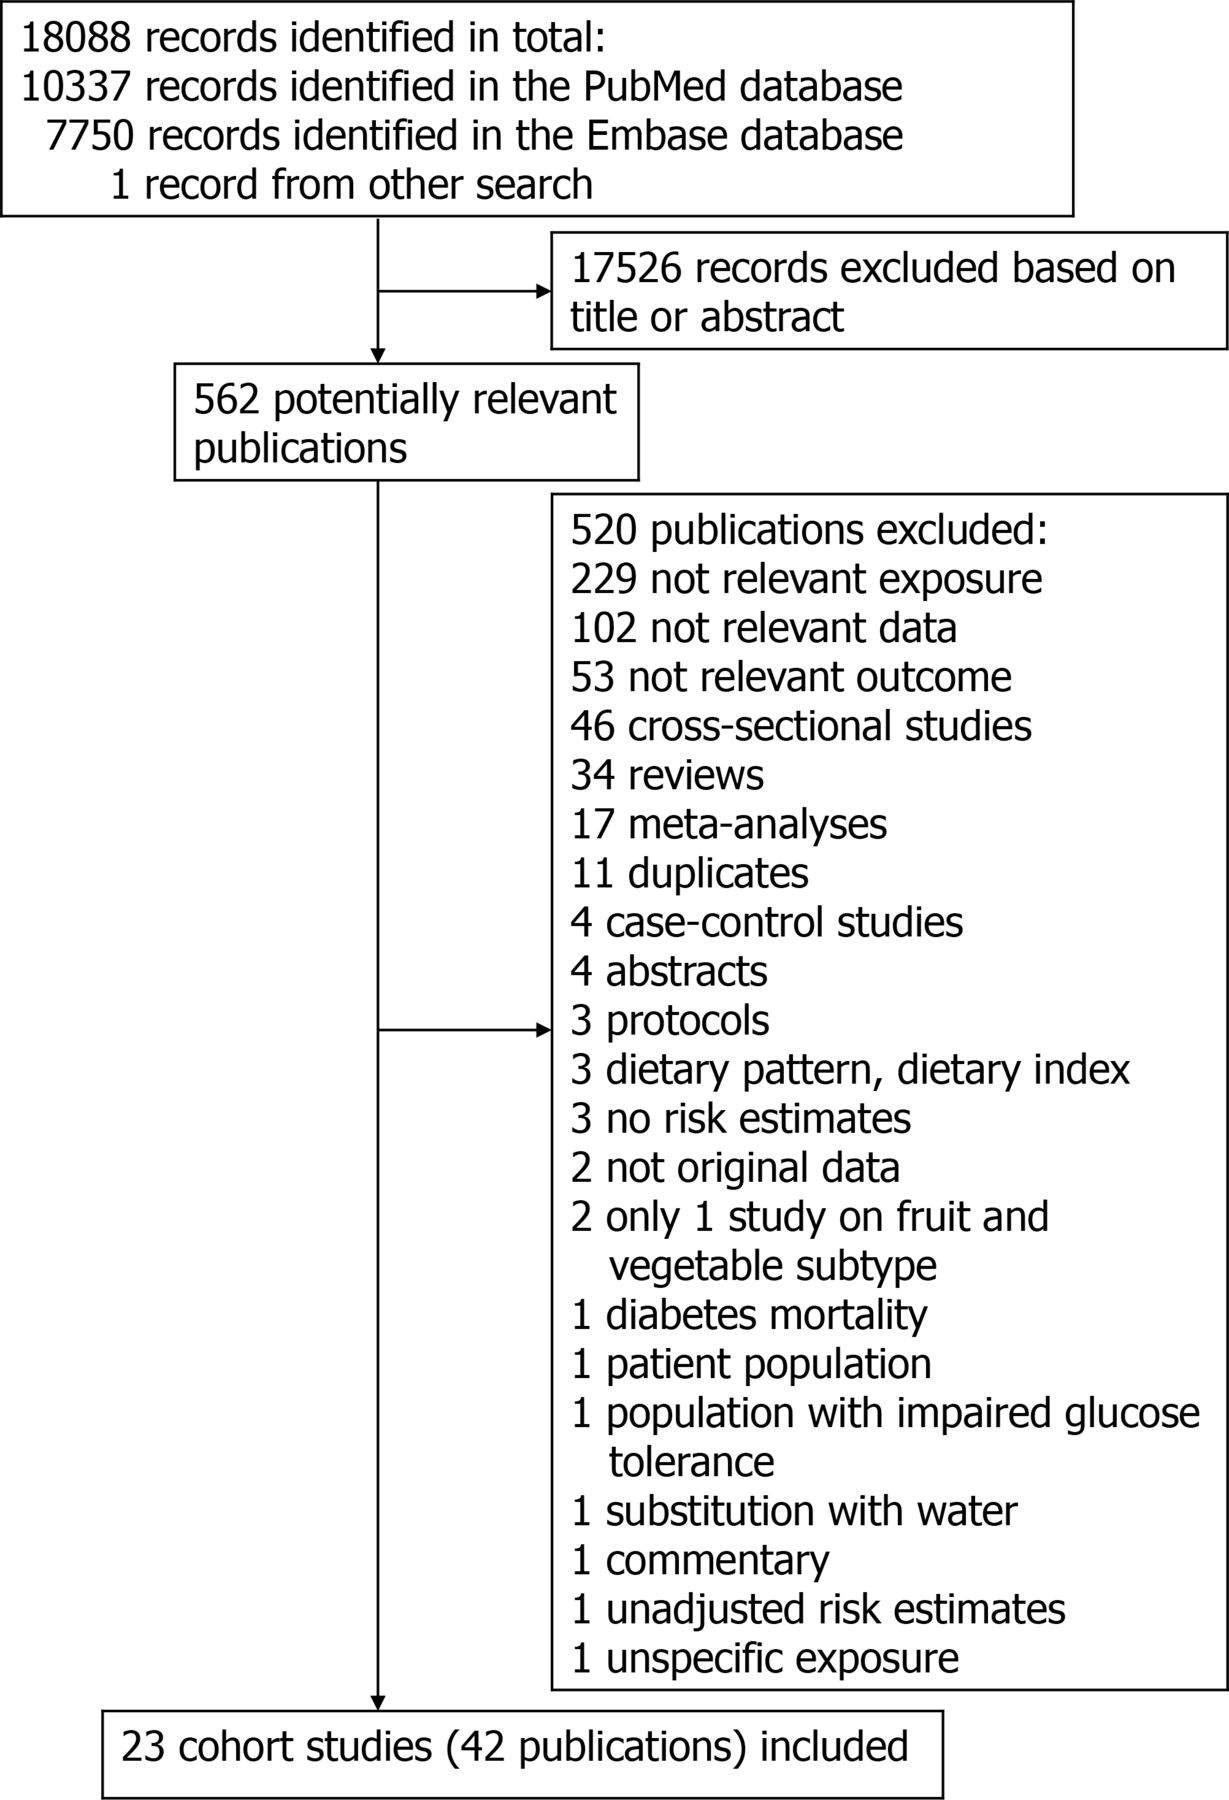
The literature search resulted in a total of 18 088 records with 10 337 records in PubMed, and 7750 records in Embase and one record identified from a separate search. The process of the study selection is shown in figure 1. A total of 17 526 records were excluded because they were irrelevant based on inspection of title or abstract. Full texts of 562 potentially eligible studies were assessed in detail and out of these a total of 42 publications5–26 29 38–40 42–44 50 51 57–67 with data from 23 cohort studies were included in the meta-analysis. Online supplemental table 4 shows the characteristics extracted from the included studies. The follow-up periods ranged from 4 to 30 years. Ten studies were from America, five from Europe, five from Asia and three from Australia. The mean (median) study quality scores were 6.8 (7.0) when evaluated with the modified NOS (online supplemental table 5). Online supplemental figures 1-90 shows the high versus low, linear and non-linear dose–response analyses of fruit and vegetable subtypes and the risk of type 2 diabetes, while online supplemental figures 91-100 shows the influence analyses and online supplemental figures 101-106 shows the funnel plots.
Supplemental material

Flow chart of study selection.
Fruit and vegetables
A total of 10 cohort studies (10 publications)5 6 14–17 22 42 58 60 (29 768 cases, 729 478 participants) investigated the association between total fruit and vegetable intake and type 2 diabetes risk. All the studies were included in the high versus low analysis. The summary RR for high vs low intake was 0.93 (95% CI: 0.89 to 0.98) and there was no heterogeneity between studies (I2=0% and Pheterogeneity=0.37) (figure 2A, table 1). For the linear dose–response analysis, seven5 6 14–16 22 60 studies were included. The summary RR per 200 g/day was 0.98 (95% CI: 0.95 to 1.01, I2=37.8%, Pheterogeneity=0.14) (figure 3A, table 1). There was no evidence of publication bias with Egger’s test, p=0.41 or by inspection of the funnel plots (table 1,online supplemental figure 101). Although the test for non-linearity was not significant, Pnon-linearity=0.13, there was a marginally significant 9%–10% reduction in risk at an intake of 600–700 g/day compared with 0 g/day (figure 3B, online supplemental table 6).
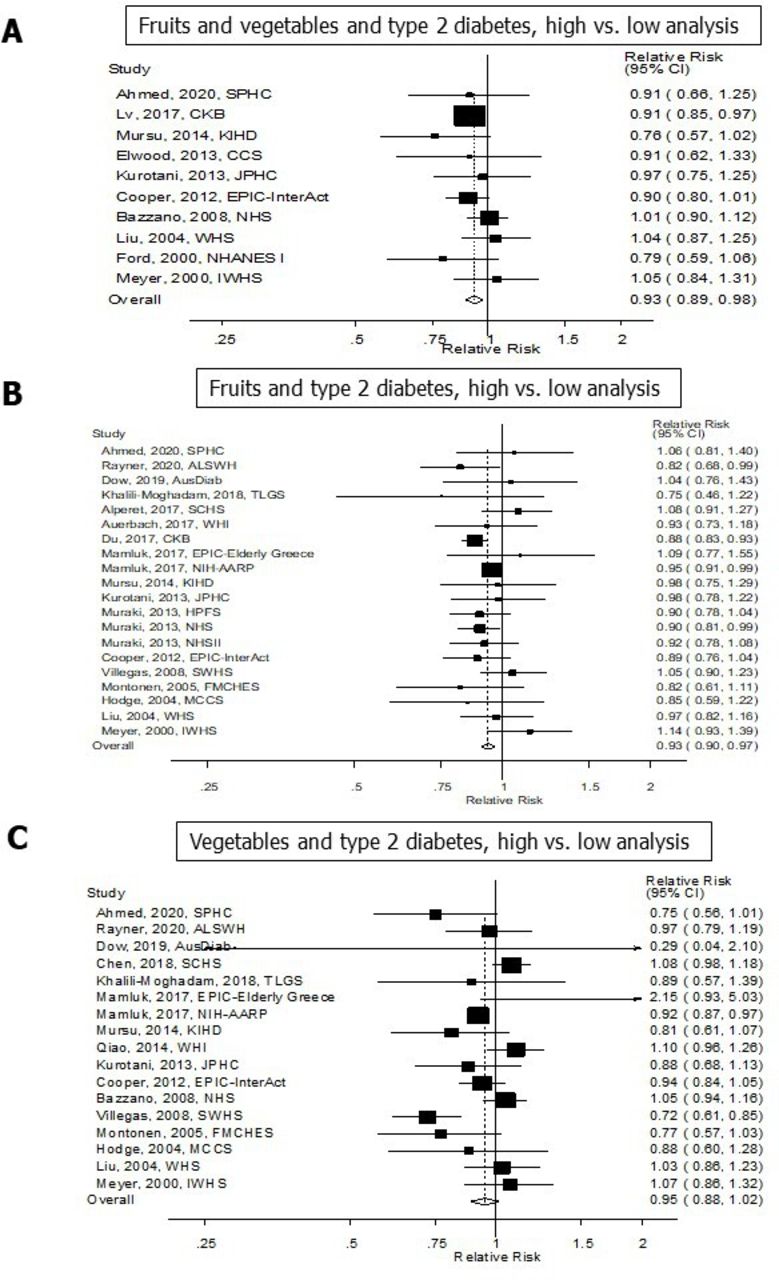
Fruits and vegetables and type 2 diabetes, high versus low analysis.
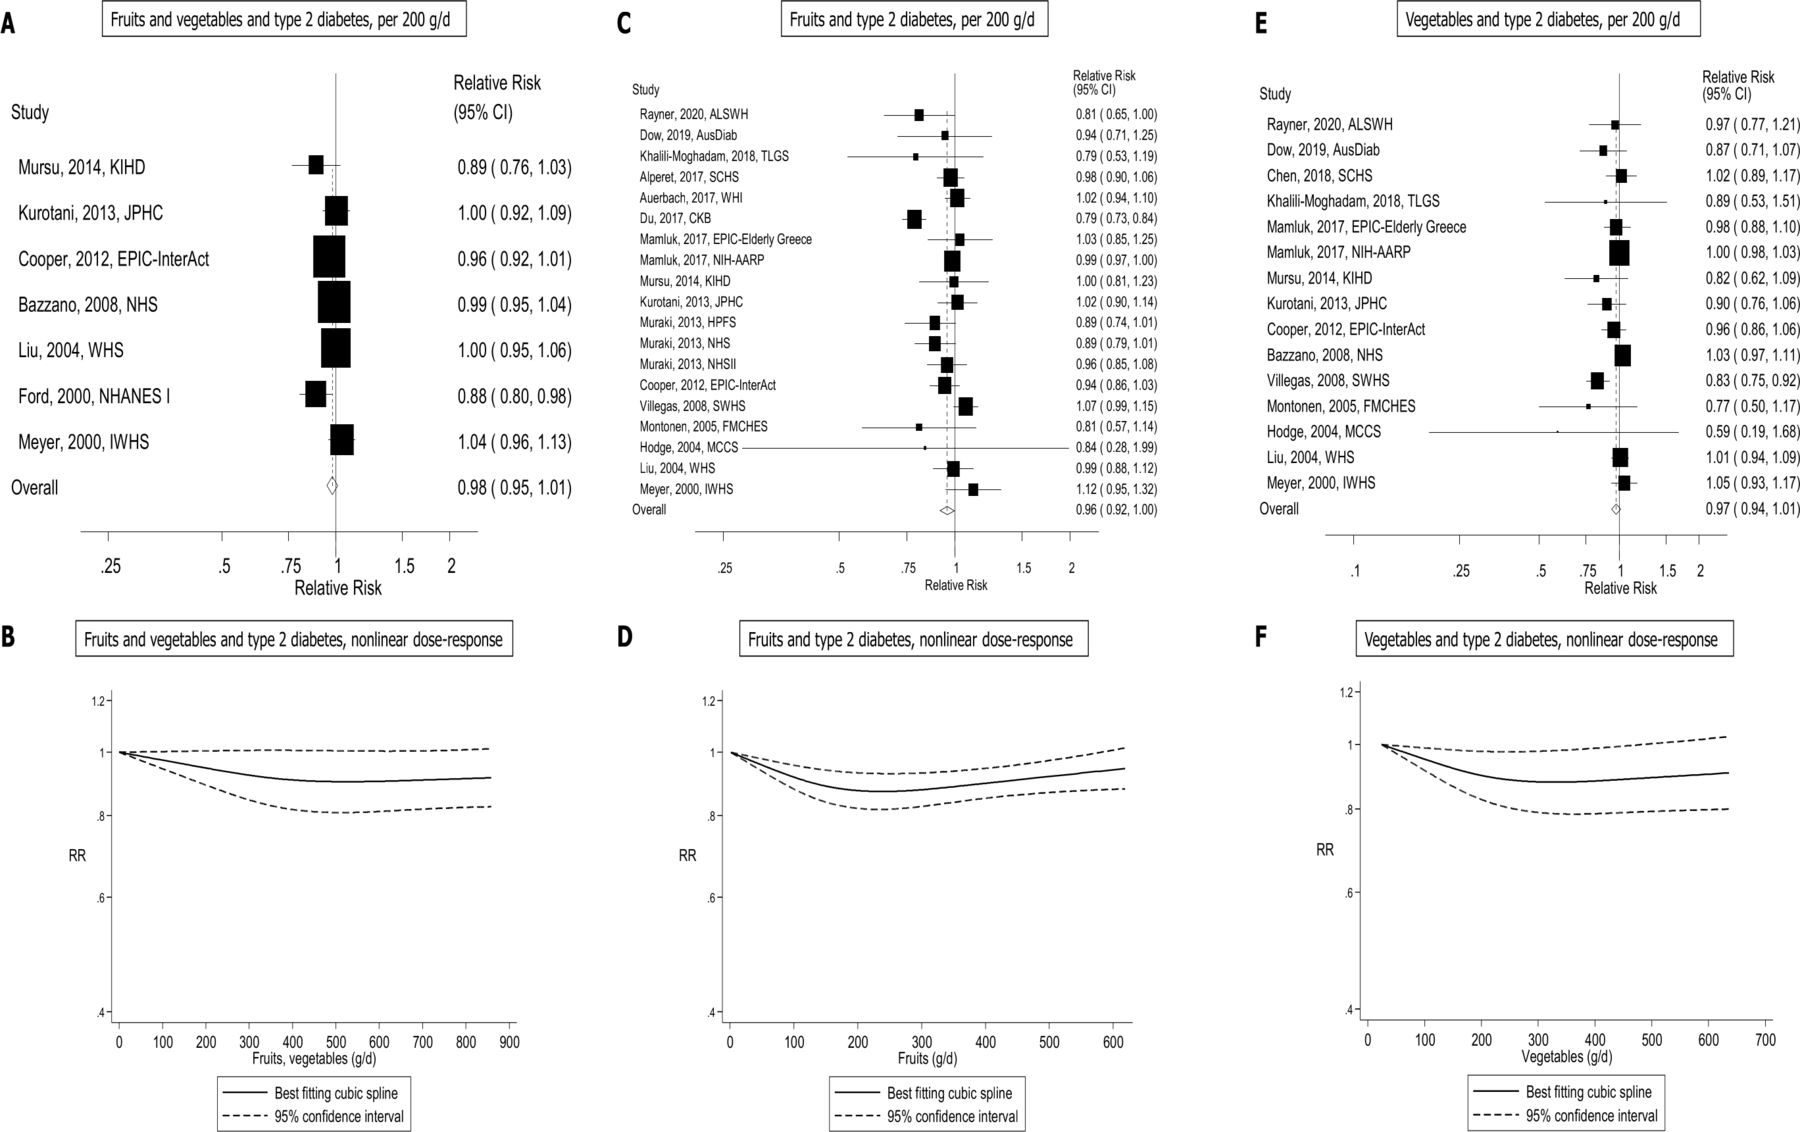
Fruits and vegetables and type 2 diabetes, linear and non-linear dose–response analysis.
Summary relative risks for high versus low and dose–response analyses of main exposures and type 2 diabetes
Fruits
A total of 20 cohort studies (17 publications)6–10 12–23 (81 313 cases, 1 542 306 participants) investigated the association between total fruit intake and type 2 diabetes risk. All of the 20 studies were included in the high versus low analysis and 19 studies6–10 12–16 18–23 were included in the linear dose–response analysis. The summary RR for high vs low intake was 0.93 (95% CI: 0.90 to 0.97) and the heterogeneity between studies was low (I2=9.3% and Pheterogeneity=0.34) (figure 2B, table 1). The summary RR per 200 g/day was 0.96 (95% CI: 0.92 to 1.00, I2=68.4%, Pheterogeneity ≤0.001) (figure 3C, table 1). There was no evidence of publication bias with Egger’s test, p=0.38 or by inspection of the funnel plots (table 1, online supplemental figure 102). There was evidence of a non-linear association, Pnon-linearity=0.001, which showed an 8%–12% reduction in risk at an intake of 100–500 g/day (figure 3D,online supplemental table 6).
Vegetables
A total of 17 cohort studies (16 publications)5 6 8 9 11 13–20 22–24 (52 959 cases, 983 953 participants) investigated the association between total vegetable intake and type 2 diabetes risk. All 17 studies were included in the high versus low analysis. The summary RR for high vs low intake was 0.95 (95% CI: 0.88 to 1.02) with moderate heterogeneity between studies (I2=60.4% and Pheterogeneity = 0.001) figure 2C, table 1). For the linear dose–response analysis, 155 6 8 9 11 13–16 18–20 22–24 were included. The summary RR per 200 g/day was 0.97 (95% CI: 0.94 to 1.01, I2=39.2%, Pheterogeneity=0.06) (figure 3E, table 1). There was evidence of publication bias with Egger’s test, p=0.03, and by inspection of the funnel plots (table 1, online supplemental figure 103). There was evidence of a non-linear association, Pnon-linearity=0.004, and the risk reduction appeared to be steeper for lower intakes. There was a 14% risk reduction was observed at an intake of 300 g/day, with no further risk reduction at intake above this level (figure 3F, online supplemental table 6).
Subtypes of fruits and vegetables
Several studies investigated the association between subtypes of fruits and fruit juices/drinks and type 2 diabetes and results for these are shown in table 2, figure 4, online supplemental table 7-9 and 13, and online supplemental figures 1-51. Inverse associations were observed in the dose–response analyses with summary RRs per 100 g/day of 0.91 (95% CI: 0.88 to 0.95, I2=0%, Pheterogeneity=0.87) for apples, 0.90 (95% CI: 0.83 to 0.97, I2=38.4%, Pheterogeneity=0.18) for apples and pears, 0.90 (95% CI: 0.82 to 0.99, I2=4.6%, Pheterogeneity=0.35) for grapefruit, and per 50 g/day of 0.60 (95% CI: 0.49 to 0.73, I2=0%, Pheterogeneity=0.59) for blueberries and 0.74 (95% CI: 0.66 to 0.83, I2=0%, Pheterogeneity=0.69) for grapes and raisins. Positive associations were observed with summary RRs of 1.18 (95% CI: 1.04 to 1.34, I2=0%, Pheterogeneity=0.82) for cantaloupe, 1.13 (95% CI: 1.01 to 1.27, I2=66.4%, Pheterogeneity=0.007) for fruit drinks, and borderline significant positive associations were observed with summary RRs of 1.08 (95% CI: 1.00 to 1.16, I2=68.7%, Pheterogeneity=0.002) for fruit juice and 1.05 (95% CI: 1.00 to 1.11, I2=0%, Pheterogeneity=0.72) for watermelon. No significant associations were observed for bananas, berries, citrus fruits, oranges, 100% fruit juice, peaches, plums and apricots, prunes, strawberries. Non-linear inverse associations were observed for bananas, Pnon-linearity=0.04, blueberries, Pnon-linearity=0.003, and grapes and raisins, Pnon-linearity=0.01, with steeper reductions in risk at lower levels of intake, while a non-linear positive association was observed for cantaloupe, Pnon-linearity=0.04, with steeper increase in risk at lower levels of intake. The inverse association between apples, apples and pears, grapefruit, prunes and type 2 diabetes appeared to be linear.
Summary relative risks for subtypes of fruits and type 2 diabetes, high versus low and dose–response analyses

Fruit and vegetable subtypes and type 2 diabetes, linear dose–response analysis. RR, relative risk.
Results for vegetable subtypes are shown in table 3, figure 4, online supplemental tables 9-12, and online supplemental figures 52-90. Significant positive associations were observed in the dose–response analyses with summary RRs per 100 g/day of 1.31 (95% CI: 1.08 to 1.58, I2=0%, Pheterogeneity=0.98) for cauliflower, and 1.08 (95% CI: 1.02 to 1.15, I2=55.4%, Pheterogeneity=0.03) for potatoes (total) and the summary RRs per 10 g/day was 1.07 (95% CI: 1.03 to 1.12, I2=63.9%, Pheterogeneity=0.06) for brussels sprouts, and a borderline significant summary RR of 1.03 (95% CI: 1.00 to 1.06, I2=0%, Pheterogeneity=0.93) for kale, mustard and chard greens. No associations were observed for allium vegetables, potatoes (boiled), broccoli, cabbage, cruciferous vegetables, green leafy vegetables, mushrooms, tomatoes and yellow vegetables. Non-linear inverse associations were observed for allium vegetables Pnon-linearity=0.045, and the risk reduction appeared to be steeper for lower intakes, with a flattening of the curve with increasing intakes. Non-linear positive associations were observed for cabbage Pno-nlinearity=0.04, with steeper increase in risk at lower levels of intake, and cauliflower Pnon-linearity=0.03 with a slight increase in risk at increasing levels of intake. The association between brussels sprouts and type 2 diabetes appeared to be linear. There was evidence of publication bias in the analysis of cruciferous vegetables and type 2 diabetes (p=0.006), which remained significant (p=0.05) after exclusion of two apparently outlying studies9 22 (online supplemental figure 104). The association remained non-significant when these two studies were excluded, summary RR=1.06 (95% CI: 0.98 to 1.15, I2=57%), although the direction of the association changed. Although Egger’s test was not significant in the analysis of green leafy vegetables and type 2 diabetes (p=0.46), there was some indication of asymmetry in the funnel plot (online supplemental figure 105), which appeared to be driven by the studies by Cooper et al 6 and Kurotani et al 14 However, the results were not materially altered by exclusion of these two studies, summary RR=0.96 (95% CI: 0.92 to 1.01, I2=78.4%). There was indication of publication bias in the analysis of potatoes (total) and type 2 diabetes (p=0.06), however, the asymmetry in the funnel plot indicated missing positive studies (online supplemental figure 106). Exclusion of one outlying study by Farhadnejad et al 39 attenuated Egger’s test to 0.23, but did not substantially alter the results, summary RR=1.09 (95% CI: 1.04 to 1.14, I2=40.2%).
Summary relative risks for subtypes of vegetables and type 2 diabetes, high versus low and dose–esponse analyses
Subgroup, meta-regression and sensitivity analyses
Subgroup and meta-regression analyses were conducted for fruit and vegetables combined, fruits, vegetables, potatoes (total), cruciferous vegetables and green leafy vegetables (online supplemental tables 14-19). There was no significant heterogeneity between subgroups in the analyses of fruits and vegetables combined, vegetables, green leafy vegetables and total potato intake and type 2 diabetes (online supplemental tables 14, 16, 18 and 19). For fruits, there was significant heterogeneity by whether studies adjusted for family history of diabetes, waist measures and energy intake or not (online supplemental table 15). Significant inverse associations were observed in the studies with adjustment for family history of diabetes, but not among those without such adjustment, while no association was observed among studies with adjustment for waist circumference and a weaker association was observed among studies with adjustment for energy intake compared with the studies with no such adjustment (online supplemental table 15). For cruciferous vegetables, there was significant heterogeneity between subgroups of studies that adjusted for ethnicity and waist circumference or waist-to-hip ratio compared with those that did not adjust for these factors, with a positive association among the studies with adjustment for ethnicity and an inverse association among studies with no such adjustment, and an inverse association among studies with adjustment for waist measures of adiposity compared with no association among those without such adjustment (online supplemental table 17).
The results for fruit and vegetables combined (dose response), fruits (high vs low), vegetables (high vs low, dose response), and cruciferous vegetables (dose response) appeared to be robust in sensitivity analyses excluding one study at a time from the analysis (online supplemental figures 92, 93, 95, 96 and 97). In contrast, the results in the high versus low analysis of fruit and vegetables combined and dose–response analyses of fruits, fruit drinks, green leafy vegetables and total potatoes were sensitive to the influence of individual studies (online supplemental figures 91, 94, 98, 99 and 100).
Evidence grading
Using World Cancer Research Fund criteria for evaluating evidence68 (online supplemental table 20), we considered the overall grading of the evidence to be supportive of a probably causal relationship between fruit intake and lower risk of type 2 diabetes, while the evidence was considered limited-suggestive for fruit and vegetables combined, and limited - no conclusion for vegetables (online supplemental tables 21-22). A detailed justification for this judgement is found in online supplemental table 21. All subtypes of fruits and vegetables were either in the category of limited-suggestive evidence or limited - no conclusion, primarily because of the limited number of studies and/or lack of robustness of the summary estimates in sensitivity analyses (online supplemental table 22).
Discussion
This up-to-date meta-analysis suggests that a high intake of fruit and vegetables combined and fruit is associated with a small reduction in risk of type 2 diabetes, however, some specific types of fruits including apples and pears, blueberries, grapes and raisins were more strongly associated with reduced risk. In the high versus low analyses, we observed a 7% reduction in RR of type 2 diabetes for intake of both fruit and vegetables combined and for total fruit, but the association with the intake of vegetables was not significant. Although the associations were not significant in the linear dose–response analyses, there was evidence of non-linearity in several analyses and there were significant 8%–12% reductions in risk with a fruit intake between 100–500 g/day and 12%–14% reduction in risk with a vegetable intake between 200–400 g/day, and a borderline significant 9%–10% reduction in risk was observed at an intake of 600–700 g/day of fruit and vegetables combined. Several subtypes of fruits were more strongly inversely associated with type 2 diabetes than total fruit intake with 12%–24% reductions in risk in the high versus low analysis, including apples, apples and pears combined, blueberries, grapefruit, grapes and raisins. In contrast, intakes of cantaloupe, fruit drinks, fruit juice, potatoes (total), brussels sprouts, and cauliflower were positively associated with type 2 diabetes risk, and borderline significant positive associations were observed for kale, mustard and chard greens and watermelon. No associations were observed for bananas, berries, citrus fruits, oranges, 100% fruit juice, peaches, plums and apricots, prunes, strawberries, allium vegetables, potatoes (boiled), broccoli, cabbage, cruciferous vegetables, green leafy vegetables, mushrooms, tomatoes and yellow vegetables and type 2 diabetes. However, the analyses of these subtypes were based on relatively few studies and some of the observed associations could partly be due to selective reporting. Further studies on specific subtypes of fruit and vegetables are therefore needed before firm conclusions can be drawn with regard to the association between a number of subtypes of fruits and vegetables and risk of type 2 diabetes.
The current meta-analysis found inverse associations between high versus low intake of fruit and vegetables combined and risk of type 2 diabetes based on eight studies, while previous meta-analyses6 33 found non-significant associations based on five and seven studies, respectively. This meta-analysis is consistent with some,33 34 but not all6 meta-analyses, which found inverse associations with fruit, apples and pears,31 and positive associations with fruit juice,32 and with the lack of association previously reported for total vegetable intake,6 33 34 but in contrast to some that reported inverse associations with green leafy vegetables6 33 and cruciferous vegetables.11 The difference in the findings regarding green leafy vegetables and cruciferous vegetables is likely due to the larger number of studies included in the current analysis than in most previous meta-analyses.
Mechanisms
The observed protective effect of fruit and vegetables on the risk of type 2 diabetes may be explained by their high content of dietary fibre, antioxidants, vitamins, minerals and phytochemicals, such as polyphenols, carotenoids, anthocyanins and quercetin. Antioxidant phytochemicals could reduce type 2 diabetes risk through their antioxidant and anti-inflammatory properties.69 Blueberries, apples and grapes have a high content of anthocyanins and quercetin.70–72 In experimental studies in diabetic rats, anthocyanins have shown anti-diabetic effects through glucose transporter 4 regulation,73 and quercetin has shown protective effects through decreased oxidative stress and protection against beta-cell damage.74 In intervention trials in humans, blueberries, alone or in combination with fibre supplements, have been shown to improve insulin sensitivity,75 reduce blood glucose76 77 and C reactive protein.76
It is also possible that fruit and vegetable intake may reduce type 2 diabetes risk by reducing adiposity and weight gain over time. A pooled analysis of three American cohort studies found inverse associations between increased intake of fruit and vegetables and 4-year weight change and particularly intakes of blueberries, prunes, apples/pears, strawberries, raisins and grapes, grapefruit and cauliflower and squash appeared to be beneficial.78 The stronger inverse association between intake of fruits and 4-year weight change than for vegetables (-0.53 vs −0.25 lb per serving increase) is consistent with the significant inverse association observed for fruit and type 2 diabetes, but not for vegetables in the current analysis, although the difference in the strength of the summary estimates in our meta-analysis was small. In addition, some of the fruit subtypes which were most beneficial in reducing weight gain, including blueberries, apples/pears, raisins/grapes, and grapefruit, were also the fruits that were found to be associated with reduced risk of type 2 diabetes in the current analysis. Most studies included in the current analysis adjusted for baseline body mass index however, few studies conducted analyses with and without adjustment for body mass index to assess potential mediation by adiposity. In addition, no studies tested whether adjustment for weight change during the follow-up, which also potentially could mediate part of the inverse association between fruit and vegetable intake and type 2 diabetes risk, affected the observed associations. Further studies could clarify this question. The increased type 2 diabetes risk observed with intake of fruit juice and fruit drinks may be due to the high glycaemic load (GL) and the added sugar in fruit drinks, as well as the lack of dietary fibre, which reduces satiety and leads to more rapid and larger postprandial increases in blood glucose than for whole fruit.79 Potatoes contain large amounts of rapidly absorbed starch and has high Glycaemic Index (GI) and GL,28 which lead to rapid increases in blood glucose and insulin concentrations, and higher GI/GL is associated with an increased risk for type 2 diabetes.80 Both intake of fruit juices and potatoes has been associated with excess weight gain over time and this could also contribute to an increased risk of type 2 diabetes.81
Limitations
This meta-analysis has some limitations that should be considered when interpreting the results. As this meta-analysis is based on studies from different populations with differences in the (1) amounts and ranges of fruit and vegetable intakes, (2) cooking and preparation methods, (3) dietary patterns, (4) prevalence of confounding factors, (5) rates of type 2 diabetes and (6) the detail of the dietary assessment used, some heterogeneity is expected between studies. Most of the included studies adjusted for lifestyle factors such as overweight and obesity, physical activity and smoking, that are common risk factors for type 2 diabetes, as well as other possible confounding factors. In the dose–response analysis, the heterogeneity was moderate for vegetables and for fruit and vegetables, and high for fruits. However, when exploring the reason for heterogeneity through subgroup and meta-regression analyses, we found little evidence that the results were materially altered whether these confounding factors were adjusted for or not. Nevertheless, relatively few of the available studies adjusted for other dietary factors and residual confounding can therefore not be completely ruled out. We can also not exclude the possibility that confounding from other risk factors could have affected the observed associations.
Most studies used dietary assessment methods relying on self-report, such as food frequency questionnaires (FFQs), to assess fruit and vegetable intake. Although nearly all studies used FFQs that had been validated, measurement errors are known to affect results of epidemiological studies on diet and health and may have biased the observed effect estimates. However, because we only included prospective studies any measurement errors in the assessment of fruit and vegetable intake would most likely have attenuated the observed associations toward the null. None of the studies included in this meta-analysis made any attempts to correct for measurement errors, however, previous studies on fruit and vegetable intake and coronary heart disease and mortality found risk reductions which were twice as strong after correcting for measurement errors compared with the uncorrected risk estimates.82 83 In addition, a recent analysis in the EPIC-InterAct study found much stronger inverse associations between several plasma biomarkers of fruit and vegetable intake, including vitamin C, carotenoids, alpha-carotene, beta-carotene, lycopene, lutein, beta-cryptoxanthin and a composite biomarker score and type 2 diabetes risk with HRs of 0.45–0.79 for the highest vs lowest quintile, than what was observed for fruit and vegetable intake as assessed by FFQ in the same study with HRs of 0.84–0.97.6 84 Since most of the included studies only assessed fruit and vegetable intake at baseline and not during the follow-up, we also cannot exclude the possibility that participants may have changed their intake over time, however, any regression dilution bias would likely attenuate associations toward the null. Several of the included studies based the assessment of outcome on self-reported type 2 diabetes. However, 20the vast majority of the studies either validated or supplemented the self-reported diabetes diagnoses through record linkage, medication use or supplementary questionnaires.
As with any meta-analysis of published studies, we cannot rule out the possibility that publication bias may have affected the observed results. In the current analysis, there was some indication of publication bias with Egger’s test in the analysis of vegetables, total potatoes and cruciferous vegetables, and there was some evidence of asymmetry in the funnel plot for green leafy vegetables, although Egger’s test was not significant in the latter analysis. We found that Egger’s test and/or the asymmetries in the funnel plots in some cases were explained by one or two outlying studies, which when excluded did not materially alter the results.
Because there was a limited number of studies in the analyses for many subtypes of fruits and vegetables and because of the potential for selective reporting of significant results, these findings need to be interpreted with caution. For example, we found no association overall between cruciferous vegetable intake, but for some subtypes of this category including cabbage, cauliflower and kale, mustard and chard greens there were positive associations with type 2 diabetes. However, these latter results were based on data from only three studies (Nurses' Health Study (NHS), NHS II, and Health Professionals Follow-up Study).43 Since the same three studies were the only studies that reported increased type 2 diabetes risk with total cruciferous vegetable intake, which was counter-acted by null or inverse associations in five other studies leading to an overall null association for total cruciferous vegetable intake, it is possible that selective reporting, publication bias and/or chance may explain the positive associations observed for the specific subtypes of cruciferous vegetables. Alternatively, these three studies may have had a better measure of long-term diet because of repeated measurements over time and therefore better been able to detect an association. Further studies are urgently needed to provide firm conclusions on the association between subtypes of fruits and vegetables and risk of type 2 diabetes. One last limitation is that there was no registered protocol for the current meta-analysis.
Strengths
Strengths of the present meta-analysis include the comprehensive search strategy with broad search terms, duplicate screening and assessment of the included studies, the large number of studies included, the large sample size which increases the precision of the effect estimate estimates, and the high study quality of the included studies. We conducted high versus low, linear and non-linear dose–response analyses of fruit and vegetables combined, separately, and across subtypes of fruit and vegetables, and in addition, we conducted detailed subgroup and sensitivity analyses. The detailed dose–response analyses allowed us to clarify the strength and shape of the dose–response relationship between fruit and vegetable intake and type 2 diabetes. The associations were in general consistent when stratified by adjustment for different confounding factors in the subgroup analyses, suggesting that these factors did not substantially affect the results. The prospective design of the included studies minimised the possibility for recall bias and reduced the possibility for selection bias, and the study quality was relatively high across studies. The factors that most frequently contributed to a less than optimal study quality score was a short duration of follow-up and, lack of reporting of participants lost to follow-up.
Public health implications
This meta-analysis provides the most comprehensive and up-to-date summary of the available evidence to date and have important public health implications given the current epidemic of adiposity and diabetes globally.85 The current meta-analysis supports public health recommendations to increase fruit intake for the prevention of type 2 diabetes. Although the overall evidence was weaker for intakes of fruit and vegetables combined, and for vegetables, recommendations should still also emphasise increased intake of vegetables given multiple other health benefits of vegetable intake.86 The findings also suggest that specific types of fruits and possibly vegetables may be more important for the prevention of type 2 diabetes than others, however, further studies are urgently needed on fruit and vegetable subtypes and type 2 diabetes before firm conclusions can be drawn. These findings are partly consistent with a previous meta-analysis, which showed benefits of fruits and vegetables and certain subtypes on risk of cardiovascular disease, cancer and all-cause mortality.86
Conclusion
This study supports existing recommendations to increase the intake of fruit and vegetables for the prevention of type 2 diabetes, but suggest certain subtypes of fruits including apples, blueberries, grapefruit, grapes and raisins may be particularly beneficial, while potatoes and fruit juice may increase the risk. Any further studies should report in more detail associations between subtypes of fruits and vegetables and type 2 diabetes, assess potential mediation by adiposity, adjust for more dietary confounders and report analyses stratified by other risk factors to better be able to rule out residual confounding.
Data availability statement
Data are available on reasonable request. Analytical datasets and Stata do-files are available from DA (d.aune@imperial.ac.uk) on reasonable request.
Ethics statements
Patient consent for publication
Ethics approval
Ethics approval was not needed as the study used already published data.
Acknowledgments
We thank Dr. Jaakko Mursu (PhD, Department of Health Sciences, University of Eastern Finland) for providing online supplemental data from the Kuopio Ischaemic Heart Disease Risk Factor Study and Dr. Qi Sun (Department of Nutrition, Harvard TH Chan School of Public Health and Channing Division of Network Medicine, Department of Medicine, Brigham and Women's Hospital and Harvard Medical School, Boston, Massachusetts, US) and Dr. Isao Muraki (Public Health, Department of Social Medicine, Osaka University of Graduate School of Medicine, Osaka, Japan) for providing online supplemental information from the NHS, NHS II and HPFS.
References
Supplementary materials
Supplementary Data
This web only file has been produced by the BMJ Publishing Group from an electronic file supplied by the author(s) and has not been edited for content.
Footnotes
REH and ME are joint first authors.
Contributors ME and REH had full access to the data, conducted the statistical analyses, wrote the first draft of the manuscript and take responsibility for the integrity of the data and the accuracy of the data analysis. DA contributed towards the statistical analysis, and all authors contributed to the revision of the manuscript.
Funding The authors have not declared a specific grant for this research from any funding agency in the public, commercial or not-for-profit sectors.
Competing interests No, there are no competing interests.
Provenance and peer review Not commissioned; externally peer reviewed.
Supplemental material This content has been supplied by the author(s). It has not been vetted by BMJ Publishing Group Limited (BMJ) and may not have been peer-reviewed. Any opinions or recommendations discussed are solely those of the author(s) and are not endorsed by BMJ. BMJ disclaims all liability and responsibility arising from any reliance placed on the content. Where the content includes any translated material, BMJ does not warrant the accuracy and reliability of the translations (including but not limited to local regulations, clinical guidelines, terminology, drug names and drug dosages), and is not responsible for any error and/or omissions arising from translation and adaptation or otherwise.