Article Text

Abstract
Poor diet is a major risk factor for excess weight gain and obesity-related diseases, including cardiovascular diseases, type 2 diabetes mellitus, osteoarthritis and several cancers. This paper aims to assess the potential impacts of real-world food and beverage taxes on change in dietary risk factors, health gains (in quality-adjusted life years (QALYs)), health system costs and greenhouse gas (GHG) emissions as if they had all been implemented in New Zealand (NZ). Ten taxes or tax packages were modelled. A proportional multistate life table model was used to predict resultant QALYs and costs over the remaining lifespan of the NZ population alive in 2011, as well as GHG emissions. QALYs ranged from 12.5 (95% uncertainty interval (UI) 10.2 to 15.0; 3% discount rate) per 1000 population for the import tax on sugar-sweetened beverages (SSB) in Palau to 143 (95% UI 118 to 171) per 1000 population for the excise duties on saturated fat, chocolate and sweets in Denmark, while health expenditure savings ranged from 2011 NZ$245 (95% UI 188 to 310; 2020 US$185) per capita to NZ$2770 (95% UI 2140 to 3480; US$2100) per capita, respectively. The modelled taxes resulted in decreases in GHG emissions from baseline diets, ranging from −0.2% for the tax on SSB in Barbados to −2.8% for Denmark’s tax package. There is strong evidence for the implementation of food and beverage tax packages in NZ or similar high-income settings.
- dietary patterns
Data availability statement
Data are available upon reasonable request.
This is an open access article distributed in accordance with the Creative Commons Attribution Non Commercial (CC BY-NC 4.0) license, which permits others to distribute, remix, adapt, build upon this work non-commercially, and license their derivative works on different terms, provided the original work is properly cited, appropriate credit is given, any changes made indicated, and the use is non-commercial. See: http://creativecommons.org/licenses/by-nc/4.0/.
Statistics from Altmetric.com
What this paper adds
This study reviews many taxes on unhealthy foods and beverages that have been used in different countries and models them to compare their relative health, cost, and GHG emissions in a high-income country - New Zealand.
The results provide simulation modelling evidence that the implementation of of taxes on unhealthy foods and beverages in New Zealand, or a similar high-income setting, is likely to lead to health gains, health system cost savings, reductions in health inequalities, and modest reductions in GHG emissions.
Introduction
Globally, there is a growing burden of obesity and obesity-related disease.1 2 The number of people living with obesity (defined as a body mass index (BMI) ≥30) tripled between 1975 and 2016,3 and in 2015, there were over 100 million children and 600 million adults living with obesity.4 Furthermore, severe obesity (defined as a BMI ≥35 or BMI >120% of the 95th percentile for age and sex) is increasing in children.5 6
Poor diet (containing energy-dense foods with high levels of sugar and fat) is an important driver of the global obesity epidemic.3 7–9 Moreover, both poor diet and obesity are major risk factors for non-communicable diseases, including cardiovascular diseases, type 2 diabetes mellitus, musculoskeletal disorders (eg, osteoarthritis) and certain forms of cancer (eg, endometrial, breast, ovarian, prostate, liver, gallbladder, kidney and colon).3 7 10 11 Free sugars, including those contained in sugar-sweetened beverages (SSBs), increase the risk of dental caries12; untreated dental caries is one of the most common chronic health conditions.13 The global food system is also a driver of greenhouse gas (GHG) emissions,14 meaning changes in consumer diets (as well as in food production methods) can contribute to reducing GHG emissions—which in turn can mitigate the indirect effects of climate change back onto human health.15 16
In 2015, the WHO published guidelines for sugar intake in adults and children.9 The guidelines strongly recommended reducing the intake of free sugars to less than 10% of total energy intake in both adults and children.9 The WHO has also specifically recommended taxation of unhealthy foods and beverages as a tool to address obesity and non-communicable diseases in children and adults.17 18
To date, at least 40 different jurisdictions (including cities, states and countries) have implemented taxes on SSB.19–21 There are a number of different types of policies that have been implemented around the world to reduce SSB consumption, including excise taxes (eg, Mexico,22 23 the UK,19 20 Saudi Arabia24), import bans (eg, Tokelau25) and bans on unlimited refills (eg, France26). Caps on serving sizes of SSBs have also been considered in some areas (eg, New York City27).
A number of jurisdictions have also implemented taxes on junk food or other products. For example, in addition to an excise tax on SSB, Mexico has implemented an 8% ad valorem tax on non-essential caloric-dense foods with energy density ≥275 kcal/100 g.28–30 In Hungary, taxes on pre-packaged foods high in salt, sugar or caffeine were introduced in 2012.31–33 Denmark introduced a tax of 16 Danish Kroner per kilogram of saturated fat for products exceeding 2.3 g saturated fat per 100 g fat in October 2011.19 21 32 Taxed products in Denmark included meat, dairy products and animal fats, as well as vegetable oils and fats and items containing these products.19 32 However, the tax was abolished in 2013.19 21 32
An increasing number of public health studies have assessed the real-world impact of taxes on purchasing and dietary intake.34 Taxes on food and beverages will have different health impacts by context, and the habits and culture around food and the array of food products available vary by time and place. There is also the fundamental question of how these different policies rank in terms of impact in any given country—a function of the contextual factors, but also the simple percentage change in price caused by the tax and the magnitude of disease attributable to foods and nutrients targeted by the tax. Therefore, this study aims to apply many tax policies used in different countries at different times and compares them for the first time (to our knowledge) in terms of relative health, cost and GHG emission impacts in one high-income country—New Zealand (NZ).
Methods
Identification of real-world taxes
The electronic databases MEDLINE and Scopus were searched for published literature that described real-world food and beverage taxes. Key search terms were sugar(s) OR beverage(s) OR drink(s) OR soda OR pop OR junk food OR saturated fat OR red meat OR processed meat OR salt OR sodium OR ultra(-)processed OR sugar-sweetened OR cola OR carbonated; AND tax(es) OR levy OR levies OR tariff(s) OR excise(s) OR duty OR duties. There were no restrictions on language or publication dates. The literature search was conducted on 26 August 2020.
A total of 1439 articles were identified in the initial search (526 from MEDLINE and 913 from Scopus). Three hundred and eighty-four duplicates were removed. Article titles and abstracts were assessed to determine their relevance to the review. Articles about simulated or proposed taxes were excluded in favour of articles describing real-world taxes that had been implemented. Additional reports and papers were identified through forward and backward citation searching.
The literature revealed a diverse array of real-world taxes from over 40 different jurisdictions (cities, states and countries) (online supplemental table 1). Ten real-world tax packages were selected to be examined in simulation modelling (table 1) based on the varying tax characteristics and modelling feasibility. Sufficient detail was required on the food groups included in each tax. While numerous different SSB taxes have been implemented around the world, only a few SSB taxes were included in this study as examples. Reasons for the exclusion of specific taxes are specified in online supplemental table 1. Tiered taxes (eg, the UK SSB levy, which taxes beverages with different sugar contents at different rates) could not be included due to limitations in the simulation model’s structure. For the selected taxes, when more than one type of tax was implemented by the same jurisdiction, the taxes were modelled together as a single tax package.
Supplemental material
Details of tax packages selected for inclusion
Modelling
A dietary intervention model was used to estimate the impact of price changes on food purchases using a NZ specific price elasticity (PE) matrix, and then consequent changes in dietary risk factors and BMI were estimated. Resulting health gains (in quality-adjusted life years (QALYs), which are calculated from the difference in disease morbidity and mortality between the business-as-usual (BAU) and intervention scenarios) and health system expenditures were estimated using an established proportional multistate life table model (‘DIET PMSLT’).
Price changes on food purchases
The BAU diet, by sex and ethnicity (Māori, the Indigenous population of NZ, 15% of population in 2011; and non-Māori) was extracted from the most recent NZ National Nutrition Survey (2008/2009) and included 338 food categories.35
A 23 by 23 food matrix of own-PEs and cross-PEs was produced using a linear almost ideal demand system from a previously published food PEs matrix for NZ.36 37 Bayesian posteriors for demand equation coefficients were generated by Nghiem et al,38 and applied by Blakely et al.39 There was substantial heterogeneity within the food groups included in the 23 by 23 matrix. Therefore, foods and their PEs were disaggregated to a 338 by 338 food matrix in order to align with consumption data in the NZ National Nutrition Survey (2008/2009) and to capture potential substitution effects.40 Relative changes in quantity purchasing were assumed to be the same as the relative changes in food consumption.
When applying a PE matrix from one context to another (including over time), and for moderate or large taxes, one may breach the econometric assumptions inherent in PEs. This may lead to implausible changes in total food purchasing and therefore implausible changes in modelled energy intake and BMI. One way to address this is to treat all food as a single item with its own total food expenditure elasticity (TFEe), and use this to scale the total household expenditure after a first step application of the PE matrix.
For example, for a TFEe of 0.75 (ie, for each 1% increase in total food prices, consumers increase their expenditure on food by 0.75%) there is a partial compensation, presumably at the expense of some other aspect of the household budget (eg, reduced heating). In this example we evenly rescale all food purchasing to achieve a 0.75% increase in expenditure for each 1% increase in the total price of food. Beverages can be considered an overlapping but separate system to foods. The cross-PE between foods and beverages are less on average than between different foods. Moreover, small changes in cross-PE between foods and beverages can have disproportionate impacts on beverage consumption. One way to handle this issue is to apply a TFEe to foods only, leaving beverages unscaled (see ‘Scenario analyses’ section).
However, the main results in this study are presented without a TFEe, as changes in the price indices from the modelled tax packages were small enough that they were likely to fall within the range that we would expect the PEs to capture naturally (ie, the majority were <2%, which is roughly similar to NZ inflation rates). This approach is similar to that of Cobiac et al’s modelling study of dietary taxes and subsidies in Australia,41 in which the magnitude of a combination of five taxes and subsidies was scaled to have a negligible effect on average weekly food expenditures (defined by a maximum change of 1%), and the expenditure effect of any single tax or subsidy did not exceed 1%. However, the study examined both taxes and subsidies and therefore the change in expenditure or price index could be cancelled out. For this modelling study, focusing on taxes alone, a threshold of 2% was considered acceptable. For taxes with a change in price index over 2%, more attention should be paid to the scenario analysis where TFEe was applied to foods only (see ‘Scenario analyses’ section below).
Changes in diet and risk factors
The nutrient content of each of the 338 food groups was calculated using the NZ food composition tables using the matching schema carried out by the NZ National Nutrition Survey (2008/2009). The nutrient content of all food items consumed within each of the 338 food groups was weighted by the grams of each food item consumed over the total number of grams consumed within each food group for the survey population. Food composition data for energy, polyunsaturated fat and sodium, as well as food group intake data for fruit, vegetables, SSB, red meat, processed meat and nuts and seeds were used as risk factors in the model. Change in BMI was estimated from the change in energy intake.42 The change in dietary risk factors was the difference in food and nutrient intake from baseline to the different tax scenarios modelled.
Epidemiological and expenditure modelling
A dietary proportional multistate life table43 44 was used to estimate the difference in QALYs and health system expenditures between the BAU diet for each sex-by-ethnicity-by-age cohort and selected interventions based on real-world food and beverage taxes. Future all-cause mortality and morbidity, and incidence and case-fatality rates for 18 diet-related diseases were projected. Specifically, the model included coronary heart disease, stroke, osteoarthritis, diabetes and multiple forms of cancer (endometrial, head and neck, kidney, liver, lung, oesophageal, pancreas, stomach, thyroid, colorectal, breast, ovarian and gallbladder), as well as dental caries.40 These chronic diseases, with the exception of dental caries, were included in the model because they were included as related to specific dietary risk factors in the Global Burden of Disease (GBD) study.45 The relative risks of diet to disease associations are presented in online supplemental tables 2–7. The entire NZ population alive in 2011 (n=4.4 million) was modelled out to death or until the year 2121 in the DIET PMSLT. The 2011 population has been used in prior NZ research, and continued use of this population allows for the comparison of interventions across the same cohort. For each disease, the general modelling approach was that raw estimates of prevalence, incidence and case-fatality rate were determined by sex, ethnicity and age group from linked health records for all NZ citizens. Incidence alone was modelled for dental caries. Baseline input parameters, and the uncertainty around the parameters, used in the modelling are presented in online supplemental table 8. Coherent sets of prevalence, incidence and case-fatality rate (and remission for cancers) were then estimated using DISMOD,46 an epidemiological calculator, before inputting as BAU in the DIET PMSLT.
In each annual cycle of the model, disease-specific excess expenditure was assigned to prevalent or incident disease cases and a background health expenditure was assigned to all living simulants. Health expenditure was then calculated under both BAU and intervention scenarios, with the difference ascribed to the respective tax scenarios. Specifically, five types of health system costs were accounted for in the DIET PMSLT model: (i) the annual cost to the NZ health system for being alive and not in the last 6 months of life and not concurrently alive with one of the modelled diseases (all members of the cohort are assigned this cost; it is the base cost); (ii) excess cost for being in the last 6 months of life if dying of a disease other than one of the modelled diseases; (iii) excess cost for being in the first year of diagnosis of a diet-related disease, linked to disease incidence; (iv) excess cost for being alive with a diet-related disease (although neither in the first year of diagnosis nor in the last 6 months of life if dying of that disease), linked to disease prevalence; and (v) excess cost for being in the last 6 months of life if dying of a diet-related disease, linked to disease mortality. These costs were sourced from the NZ HealthTracker database for all diseases except diabetes and dental caries; diabetes was sourced through the Virtual Diabetes Register and dental caries through a weighted estimate of published treatment costs, which was linked to the incidence of dental caries. Further details and equations for how these costs were calculated are described in a technical report.47 The intervention cost is the cost of a law (NZ$3.5 million, 95% UI NZ$2.0 to NZ$6.2 million48).
To generate intervention effects, the price induced changes in diet were translated into changes in dietary risk factors (food groups and nutrients). A potential impact fraction (PIF) was calculated using the BAU and intervention dietary risk factor levels, and relative risks (from the GBD) of the dietary risk factor onto paired diseases. These PIF resulted in changes in disease incidence rates that over time impacted total mortality and morbidity rates in the population. Monte Carlo simulation (2000 iterations) was used to estimate uncertainty intervals for the QALY and health system cost estimates. Time lags, with uncertainty, were applied to the PIF to reflect a more realistic estimate of how long it takes for changes in risk factor exposure to impact on disease incidence: 1–5 years for cardiovascular disease, diabetes and osteoarthritis; and 10–30 years for cancers. QALYs and costs are presented discounted at 3% per year in line with recommendations,49 and in accordance with prior NZ research.
Checking and validation of the epidemiological aspects of the DIET PMSLT is described in a separate technical report.40
GHG emissions
A NZ-specific food emissions database assembled and described by Drew et al 50 was used to estimate the total change in daily per capita diet-related emissions associated with each tax package. GHG emissions were based on NZ-specific life cycle-assessments where possible (a database that provides per-kilogram cradle to point-of-sale emissions for food groups in the UK51 was used when NZ-specific estimates were unavailable, in approximately 75% of food groups), and were estimated for each of the 338 food groups in the dietary intervention model. When a tax changes purchases of these food groups, this change flows through to the change in GHG emissions associated with daily consumption.
Scenario analyses
In a scenario analysis, the model was also run with total food expenditure (but not beverages) constrained using a TFEe in order to avoid potential underestimation or overestimation of post-intervention food purchasing.52 The TFEe (0.75) was derived from NZ studies.53 54 Results for this scenario are presented in online supplemental table 9 and are shown in comparison with the results without a TFEe adjustment in online supplemental figure 1.
In addition, an equity adjustment was applied to the results that set background morbidity and mortality rates for Māori to non-Māori values. This modelling technique is routinely used to avoid the undervaluation of health gains and to identify potential health equity impacts for Māori.55
Results
Table 2 shows the change in dietary risk factors, and price index post-tax, while table 3 shows the change in the consumption of different food groups. Changes in dietary risk factors were largely in the expected direction. All of the modelled taxes that targeted SSB (ie, American Samoa, Barbados, Bermuda, Dominica, Finland, the Gulf Cooperation Council, Mexico, Norway and Palau) achieved decreases in SSB consumption. Additionally, the modelled taxes that targeted sugary foods and sweets (ie, Denmark, Dominica, Finland, Mexico and Norway) each achieved a decrease in the consumption of sugar and sweets (table 3). Denmark and Mexico’s tax packages targeted a broader array of foods than the other taxes modelled and therefore resulted in changes in consumption for more food groups. For example, there was an increase in the consumption of ‘other drinks’ associated with Denmark’s tax package. This change largely represents an increase in water consumption due to small cross-PEs with multiple other food categories. All of the tax packages reduced BMI and increased the total food price index (table 2).
Change in food price index and dietary risk factors* used for health and health system costs modelling for tax policies
Change in daily food group consumption for tax policies
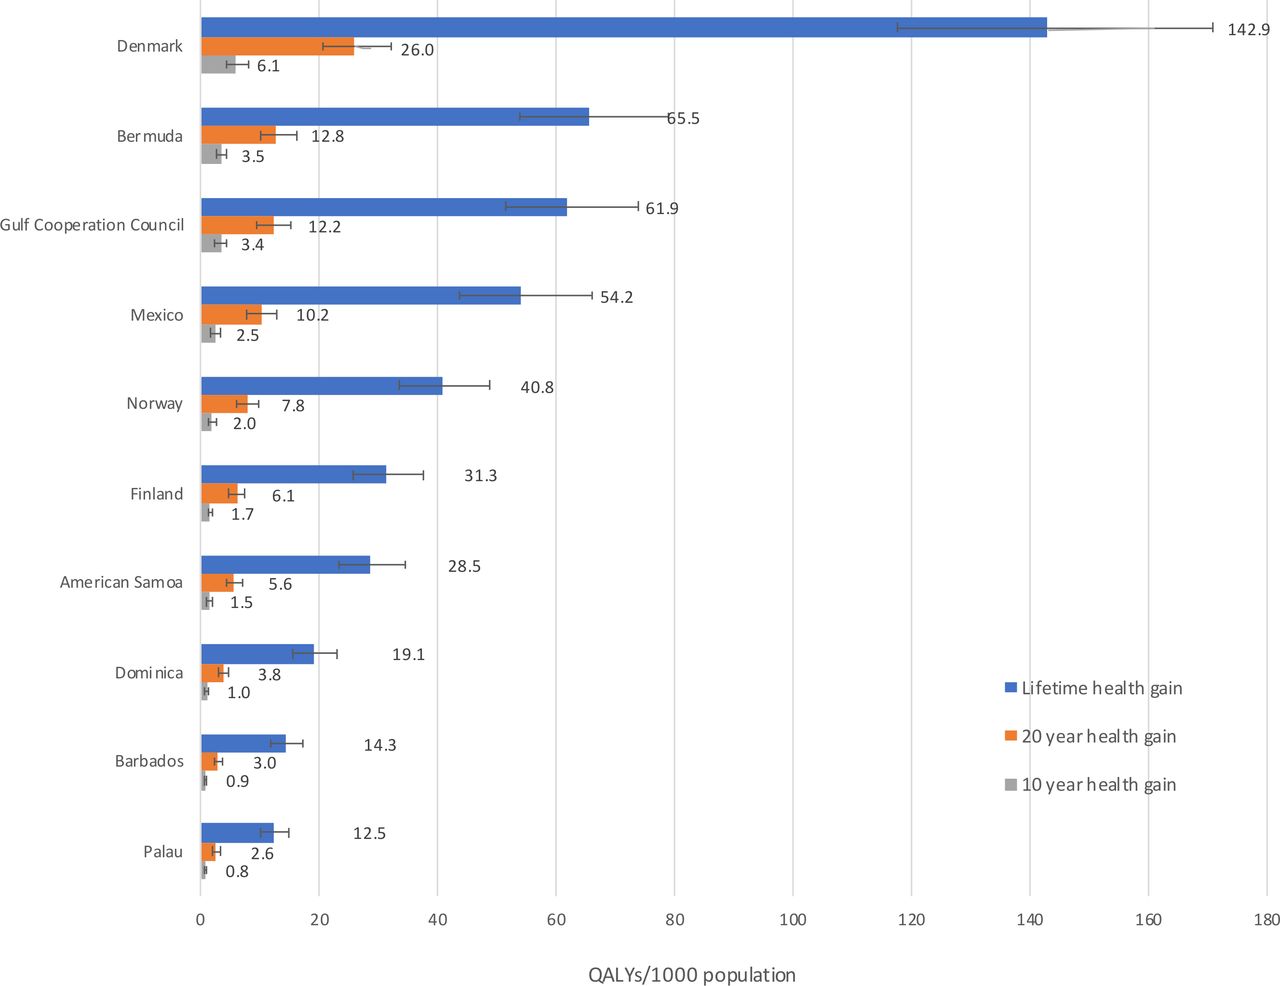
Figure 1 shows health gains expressed as QALYs per 1000 in the population for the tax interventions at a 3% discount rate over the remaining lifespan of the NZ population, as well as at 10 years and 20 years post intervention. QALYs ranged from 12.5 (95% uncertainty interval (UI) 10.2 to 15.0; 3% discount rate) per 1000 population for the import tax on SSB in Palau and 14.3 (95% UI 11.7 to 17.4) per 1000 population for the ad valorem tax on SSB in Barbados to 65.5 (95% UI 53.9 to 78.8) per 1000 population for the ad valorem tax on SSB in Bermuda and 143 (95% UI 118 to 171) per 1000 people for the excise duties on saturated fat, chocolate and sweets in Denmark.

Health gains in QALYs per 1000 population for tax policies at a 3% discount rate with 95% uncertainty intervals in 2011. QALYs, quality-adjusted life years.
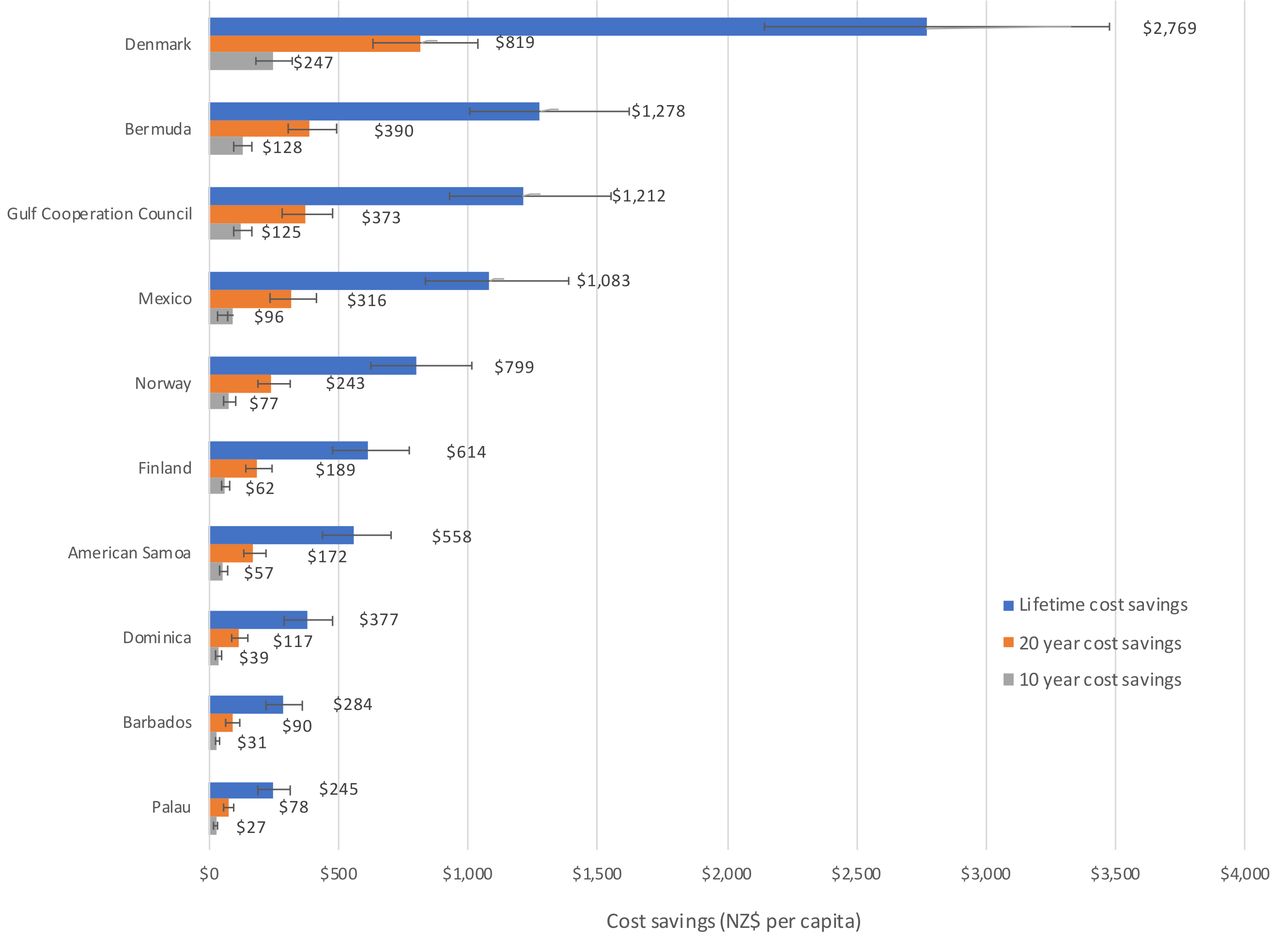
Figure 2 shows per capita health system expenditure savings (3% discount rate; lifetime horizon, 10-year impact and 20-year impact post intervention). Reductions in health system costs reflected the patterns of health gain, with health expenditure savings ranging from NZ$245 (95% UI 188 to 310) per 1000 population for the Palau import tax to NZ$2770 (95% UI 2140 to 3480) per 1000 population for Denmark’s excise duties.

Health system expenditure savings per capita for tax policies at a 3% discount rate with 95% uncertainty intervals. Cost savings are in 2011 NZ dollars. NZ, New Zealand.
Table 4 shows estimated QALYs gained by ethnicity-sex groups and cost savings, as well as results in per capita terms (3% discount rate, lifespan horizon). Absolute health gains were higher in men compared with women. When considering ethnic inequalities, Māori make up only 15% of the total population in NZ, but approximately one-third of QALYs gained occurred in the Māori population and per capita health gains were consistently higher for Māori than for non-Māori across all tax interventions. The ratios of age-standardised per capita QALYs for Māori versus non-Māori ranged from 1.5 for the excise duties on saturated fat, chocolate and sweets in Denmark to 3.2 for the Gulf Cooperation Council ad valorem excise tax on carbonated beverages and energy drinks. Health gains for Māori increased by between 24.6% and 29.3% with the application of an ‘equity adjustment’ (ie, non-Māori mortality and morbidity rates used for Māori).
Health impacts (in QALYs) and health system costs for tax policies, for the NZ population alive in 2011 (lifetime horizon) with 3% discount rate
Table 5 shows the estimated total change in per capita and total daily GHG emissions associated with each tax package. In the main analysis, all of the modelled taxes resulted in potential GHG emission savings. Following the pattern of health gains and cost-savings, Denmark’s tax package resulted in the largest decrease in GHG emissions, followed by Bermuda’s tax on SSB. These results reflect the small changes in consumption across various food groups (table 3).
Estimated change in GHG emissions associated with tax policies per day
Discussion
Main findings and interpretation
The potential impacts of real-world food and beverage taxes on change in dietary risk factors, health gains, health system costs and diet-related GHG emissions in NZ were assessed. The lowest health gains (in QALYs) were 12.5 (95% UI 10.2 to 15.0; 3% discount rate) per 1000 population for the import tax on SSB in Palau and 14.3 (95% UI 11.7 to 17.4) per 1000 population for the ad valorem tax on SSB in Barbados, both of which just impacted on SSB intake (table 3) with small estimated resultant changes in population BMI (table 2). The greatest health gains were 143 QALYs (95% UI 118 to 171; TFEe adjusted=57.9) per 1000 population for the excise duties on saturated fat, chocolate and sweets in Denmark, which impacted on the intake of many food groups (table 3) with a larger resulting change in population BMI (table 2). Health expenditure savings ranged from NZ$1.1 billion (95% UI 0.8 to 1.4 billion) to NZ$12.2 billion, (95% UI 9.4 to 15.3 billion), respectively. Most of the estimated health impact of the real-world taxes was through reductions in BMI, which accounted for approximately 80% or more of the total results.
All of the modelled taxes that targeted SSB (ie, American Samoa, Barbados, Bermuda, Dominica, Finland, the Gulf Cooperation Council, Mexico, Norway and Palau) achieved decreases in SSB consumption. Different definitions of SSBs for each tax policy played a role in the variation in the amount of health gain seen. Some interventions only targeted carbonated beverages (eg, Palau), while other interventions expanded the definition to include energy drinks, sports drinks, fruit juices and/or other non-alcoholic beverages (eg, American Samoa). Generally, the wider the definition of SSBs used, the larger the health gains associated with the tax policy. However, for certain tax policies, the definitions of food groups or beverages were not clearly detailed in the literature. For example, it was unclear whether the SSB taxes in American Samoa and Dominica included milkshakes or flavoured milks. Therefore, for this study, it was assumed that such beverages were not included in the respective taxes, as noted in table 4. Health gains would have been slightly higher if these beverages had been included.
The modelled taxes that targeted foods (ie, Denmark, Dominica, Finland, Mexico and Norway) all included sugary foods and sweets in their targets, and each achieved a decrease in the consumption of sugar and sweets (table 3). Mexico’s junk food tax also targeted a number of other food groups, including salty snacks. When modelled, the tax package achieved a small decrease in daily sodium intake (table 2) as well as a decrease in the consumption of snacks (table 3). Generally, Denmark and Mexico’s tax packages targeted a broader array of foods than the other taxes modelled and therefore resulted in changes in consumption for more food groups. However, both tax packages might also result in unfavourable changes in a number of dietary risk factors through substitution effects. For example, Mexico and Denmark’s tax packages resulted in small decreases in daily vegetable intake and Denmark’s tax package resulted in a small increase in SSB consumption (table 2). In addition, Denmark’s saturated fat tax had a very small impact on red and processed meat intake because the tax level on specific food groups within these larger meat categories were quite low.
All of the modelled tax policies were cost-saving and would potentially result in higher health gains for Māori than for non-Māori (ie, reduce inequalities for a population with higher dietary-related diseases). Assuming that the modelled tax interventions are equally effective for Māori and non-Māori, the estimated age-standardised health gain ranged from 1.5 times higher for Māori than non-Māori for the excise duties on saturated fat, chocolate and sweets in Denmark to 3.2 times higher for the Gulf Cooperation Council ad valorem excise tax on carbonated beverages and energy drinks. We suggest that this inequality reduction would apply to other societies for social group comparisons where disadvantaged populations have higher rates of dietary-related diseases.
Previous studies have raised concerns that taxing certain food products may result in an adverse impact on health through substitution effects between food groups. For example, it has been suggested that a standalone tax on saturated fat (eg, Denmark’s excise duty) may result in increased cardiovascular disease and cancer deaths through increased salt intake.56 57 While in this modelling study Denmark’s tax package resulted in a small decrease in estimated daily sodium intake, the simulations suggest that there may be other small adverse substitution effects (ie, decreased vegetable intake; table 2), although the results suggest that net health gains are still likely. By comparison, a study that measured the effect of randomly assigned food price variations on consumer purchasing in NZ, found that a saturated fat tax (analysed using an average of low and high price change options: NZ$2 per 100 g or NZ$4 per 100 g) resulted in important substitution effects, including an increase in fruit and vegetable purchases as a percentage by weight of all food purchases (4.0%, 95% CI: 0.9% to 7.1%), but also an increase in sugar as a per cent of total energy (5.0%, 95% CI: 2.1% to 7.9%).58 A previous health economic modelling study that used an earlier version of the same PMSLT model used in the current study to compare the effects of food subsidies and taxes in NZ also found substitution effects for a saturated fat tax (set at a level to achieve a 3.4% increase in the food price increase, equating to US$1.27 per 100 g saturated fat), with beneficial increases in fruit and vegetables and a decrease in salt, as well as a deleterious reduction in polyunsaturated fatty acids (PUFA).39 Additionally, an 8% junk food tax (designed to emulate the junk food tax implemented in Mexico) had modest substitution effects, including a beneficial increase in vegetables and decreases in saturated fat and sugar, along with a deleterious reduction in PUFA.39 While our simulation model was unable to account for substitutions within a food group, such as switching to a cheaper version of a product within the same food group with a worse nutrient profile (eg, switching to a higher sugar variety of SSB under a volume-based tax measure as compared with tax based on sugar content), the disaggregation to 338 food groups is a strength of the model and helps to limit the possibility of such substitutions within food groups.
A strength of modelling real-world tax policies is that, in some cases, it is possible to compare the modelled results to actual post-tax changes in consumption of targeted foods and beverages. In Mexico, a study that used time series data on the weekly purchases of Mexican households to estimate changes in the purchase of calories from taxed foods and beverages associated with the introduction of the tax package, reported an 8.5% decrease in the purchase of calories from taxed beverages and a 5.4% decrease in the purchase of calories from taxed foods from 2013 (pre-tax) to 2014 (post-tax).59 However, the study also reported a 3.7% increase in the purchase of total calories, along with increases in the consumption of certain nutrients including a 5.8% increase in sodium (figure 3) over the same period after accounting for time trends,59 likely due to substitution effects. The study used an event study design,59 which exploits the exact date on which the taxes came into effect, but only allows for the examination of short-term changes in calorie consumption. A more recent study, which used longitudinal data from Mexican households in fixed effects models to estimate changes in kilocalories (Kcal) of beverage purchases, observed a reduction of 18 Kcal per capita per day (−21%) from purchases of taxed beverages from 2012 to 2016 (figure 3).60 Several other studies have also reported similar decreases in per capita purchases or consumption of taxed food and beverages in Mexico.29 30 61 In line with these reported post-tax changes, the simulations in our study suggest that a decrease in SSB intake (−13.0 g per capita per day (−1.7%)) and a very small decrease in sodium intake (−0.02 g/day (−0.001%)) might be expected if Mexico’s tax package was implemented in NZ (figure 3). The model also suggests a reduction in energy intake of 14 Kcal per capita per day (population weighted (−12.1%)) from purchases of taxed beverages (figure 3).

Real-world versus simulation estimates for New Zealand for post-tax changes in purchases or consumption of selected foods and beverages. SSB, sugar-sweetened beverages; TFEe, total food expenditure elasticity.
Following the implementation of the excise tax on saturated fat in Denmark in 2012, it was estimated that consumption of butter, margarine and cooking oils decreased by 5.5%, 8.2% and 5.5%, respectively.32 Consumption of margarine and cooking oils also decreased in 2013 by 0.4% and 2.5%, respectively, while consumption of butter increased by 1.9%.32 By contrast, the consumption of olive oil and vegetable oils increased in both 2012 and 2013.32 From 2010 to 2013, Denmark also saw annual decreases in the consumption of confectionery and chocolate, which were also subject to the excise tax.32 The simulations in our study indicated a 1.3 g/day decrease in the consumption of butter and margarine (representing decreases of 35% for butter and 3% for margarine), no change in the consumption of fat and oils and a 3.3 g/day decrease (−13%) in sugar and sweets might be expected for Denmark’s tax package (table 3; figure 3).
In Finland, decreases in the consumption of confectionery, ice cream and SSB were observed after the implementation of excise duties in 2011.32 Confectionery consumption decreased by an average of 1.4% from 2011 to 2013.32 Ice cream consumption decreased by an average of 1.3% in 2011 and 2012, but then increased by 1.4% in 2013.32 SSB consumption decreased by an average of 1.6% from 2011 to 2013.32 The simulations in our study also suggest a decrease in SSB intake (−18.0 g/day (−4.8%) per capita) and in the consumption of sugar and sweets (−1.0 g/day (−3.8%) per capita) (table 3; figure 3).
The typical NZ adult’s diet-related GHG emissions are approximately 6.6 kg of carbon dioxide equivalents per day.50 In the main analysis, all of the modelled taxes resulted in small decreases in emissions from baseline diets, ranging from −0.2% for the tax on SSB in Barbados to −2.8% for Denmark’s tax package. This suggests that the tax policies designed principally to decrease consumption of SSB and junk food offer only a modest benefit in terms of emissions savings.
Study strengths and limitations
A strength of this study is the use of the established DIET PMSLT model,39 62 which is based on high quality disease-specific epidemiological and costing data. PMSLT modelling has been widely used in NZ and Australia to assess different health interventions, which readily allows for comparison across studies. However, a weakness of this approach is that it only examines health system costs, rather than examining the costs associated with a wider array of potential impacts (eg, income loss), although the model was adapted to allow for an assessment of the change in GHG emissions associated with each tax package.
The model did not include the potential impact of food reformulation by manufacturers to avoid costs that may arise as a result of tax implementation. Additionally, in this study we assume a 100% tax pass-through rate. However, in reality the pass-through rate may be higher or lower than 100%, although a 100% pass-through rate for SSB taxes is a reasonable assumption24 63. This study also does not consider cross-PE between foods and other health-related goods. Theoretically, people could choose to increase expenditure to continue purchasing unhealthy foods and decrease expenditures that are beneficial to health (eg, home heating costs, gym memberships). However, as the changes in total food prices are small, such effects are unlikely to change the direction of health impacts resulting from the modelled tax scenarios. Additionally, we assume that changes in purchasing equal changes in consumption. However, this may not hold true in reality. For example, large quantities of food are regularly wasted by consumers, and households may ‘absorb’ changes in food prices by changing patterns of food waste. Such effects warrant further research.
Due to the structure of the model, we were unable to include tiered taxes in this study (eg, the SSB levy in the UK, which targets beverages based on sugar content). We were also unable to include certain taxes if the targeted foods or beverages did not align with the food groups used in the model (eg, Hungary’s junk food tax).
The application of PE matrices from one context to another in which food consumption patterns and prices differ can challenge the assumptions that are inherent in PE matrix estimation and can result in either overestimation or underestimation of post-intervention total food purchasing.39 Therefore, total food expenditure can be constrained using a TFEe, which uniformly rescales all food purchasing such that total post-intervention food purchasing equals total pre-intervention food purchasing scaled to match the expected change in food expenditure.39 In this study, the model was run without a TFEe adjustment (main analysis) and again with a TFEe adjustment for foods (see online supplemental table 9). In particular, the results for Denmark’s tax package, which targeted saturated fat, chocolate and sweets, varied widely based on whether or not a TFEe adjustment was applied (see online supplemental figure 1). Specifically, Denmark’s tax package would potentially result in large health gains, ranging from 57.9 QALYs per 1000 population with a TFEe adjustment for foods to 142.9 QALYs per 1000 population without a TFEe adjustment. The difference in QALYs gained is largely due to a difference in BMI, because the estimated reduction in energy intake and therefore BMI is decreased when a TFEe is applied. The TFEe adjustment attempts to estimate how the population’s energy intakes will respond to the implementation of these tax packages based on the conservative assumption is that the population substitutes some of the products consumed to maintain the majority of their baseline energy intake.52 However, in either scenario there would be health gains and health system cost savings.
Potential implications
Real-world food and beverage taxes offer the potential to improve population health and reduce healthcare expenditures. These results are likely applicable to similar contexts: high-income countries with similar dietary patterns, burden of disease, consumer behaviours and other population characteristics. However, implementation of food and beverage taxes requires consideration of factors beyond simulation results, including social and political acceptability, environmental impacts and the practicalities of tax administration. Furthermore, robust monitoring and evaluation of real-world tax policies is critical for the evaluation of effectiveness.
Conclusion
There is simulation modelling and natural experiment evidence that the implementation of taxes on unhealthy foods and beverages in NZ, or in similar high-income settings, will lead to health gains and reductions in health inequalities. However, there are a number of other factors that require consideration in decisions on food and beverage taxes, including social acceptability, food industry perspectives, the costs of implementation and the complexities of administration.
Data availability statement
Data are available upon reasonable request.
Ethics statements
Patient consent for publication
Ethics approval
This study does not involve human participants.
References
Supplementary materials
Supplementary Data
This web only file has been produced by the BMJ Publishing Group from an electronic file supplied by the author(s) and has not been edited for content.
Footnotes
Contributors CC led the conceptualisation and design of the study. TB, AM, NN and CNM contributed to the conceptualisation and design of the study. CC, TB, NN and AM contributed to building the models. ACJ contributed to the inclusion of dental caries in the model. LG conducted the literature review. CC led and LG contributed to the selection of tax policies to model. CC led and LG contributed to the analysis, and all authors contributed to the interpretation of results. LG led and all other authors contributed to the drafting and revision of the manuscript.
National nutrition survey data (2008/09) was acquired from the University of Otago's Life in New Zealand Research Group who conducted the survey (through personal communication; Blakely, Smith and Parnell, 2014). Access to the data used in this study was provided by Statistics New Zealand under conditions designed to keep individual information secure in accordance with requirements of the Statistics Act 1975. The opinions presented here are those of the authors and do not necessarily represent an official view of Statistics New Zealand.
Funding This work was funded by the Health Research Council of New Zealand (Programme grants 13/724 and 16/443).
Competing interests None declared.
Provenance and peer review Not commissioned; externally peer reviewed.
Supplemental material This content has been supplied by the author(s). It has not been vetted by BMJ Publishing Group Limited (BMJ) and may not have been peer-reviewed. Any opinions or recommendations discussed are solely those of the author(s) and are not endorsed by BMJ. BMJ disclaims all liability and responsibility arising from any reliance placed on the content. Where the content includes any translated material, BMJ does not warrant the accuracy and reliability of the translations (including but not limited to local regulations, clinical guidelines, terminology, drug names and drug dosages), and is not responsible for any error and/or omissions arising from translation and adaptation or otherwise.