Article Text

Abstract
Front-of-pack labelling (FoPL) aims to promote healthier diets by altering consumer food purchasing behaviour. We quantify the impact of the voluntary Health Star Rating (HSR) FoPL adopted by New Zealand (NZ) in 2014, on (i) the quantity of foods purchased by HSR scores and food groups and (ii) the quantities of different nutrients purchased.
We used Nielsen HomeScan household purchasing panel data over 2013–2019, linked to Nutritrack packaged food composition data. Fixed effects analyses were used to estimate the association of HSR with product and nutrient purchasing. We controlled for NZ-wide purchasing trends and potential confounding at the household and product level.
In 2019, HSR-labelled products accounted for 24% (2890) of 12 040 products in the dataset and 32% of purchasing volume. Of HSR-labelled products, 1339 (46%) displayed a rating of 4.0–5.0 stars and 556 (19%) displayed a rating of 0.5–2.0 stars.
We found little or no association between HSR labelling and the quantities of different foods purchased. Introduction of HSR was, however, associated with lower sodium (−9%, 95% CI −13% to −5%), lower protein (−3%, 95% CI −5% to 0%) and higher fibre (5%, 95% CI 2% to 7%) purchases when purchased products carrying an HSR were compared with the same products prior to introduction of the programme.
Robust evidence of HSR labelling changing consumer purchasing behaviour was not observed. The positive effect on nutrient purchasing of HSR-labelled foods likely arises from reformulation of products to achieve a better HSR label.
- nutrition assessment
Data availability statement
Data are available on reasonable request. Data may be obtained from a third party and are not publicly available. Because of commercial and legal restrictions to the use of copyrighted material it is not possible to share data openly which reveal the product or supermarket names, but unredacted versions of the dataset are available with a licensed agreement that they will be restricted to non-commercial use. For access to Nutritrack, please contact The National Institute for Health Innovation at the University of Auckland at enquiries@nihi.auckland.ac.nz. For access to Nielsen HomeScan, please contact Nielsen at +64 9 970 4188.
This is an open access article distributed in accordance with the Creative Commons Attribution Non Commercial (CC BY-NC 4.0) license, which permits others to distribute, remix, adapt, build upon this work non-commercially, and license their derivative works on different terms, provided the original work is properly cited, appropriate credit is given, any changes made indicated, and the use is non-commercial. See: http://creativecommons.org/licenses/by-nc/4.0/.
Statistics from Altmetric.com
WHAT IS ALREADY KNOWN ON THIS TOPIC
Front-of-pack labelling (FoPL) on food encourages industry reformulation towards healthier foods; however, it is less clear what effect it has on consumer purchasing of healthier foods.
WHAT THIS STUDY ADDS
This study finds no direct impact of the Health Star Rating FoPL used in New Zealand and Australia on household food purchasing.
However, because of industry reformulation of foods in response to the Health Star Rating, the Health Star Rating label was associated with net changes in nutrients purchased: 9% lower sodium, 3% lower protein and 5% higher fibre.
HOW THIS STUDY MIGHT AFFECT RESEARCH, POLICY OR PRACTICE
FoPL is justified, and should arguably be mandatory, given it alters product composition to be healthier and consumers have a right to clear information on the healthiness of foods.
The direct impact of FoPL, in this case the voluntary Health Star Rating system used in Australasia, on consumer purchasing behaviour appears negligible.
Introduction
Front-of-pack nutrition labelling (FoPL) is believed to be a low-cost method to promote healthier diets and prevent non-communicable diseases.1 The net effect of FoPL can arise through two mechanisms. The first is consumer-led purchasing behaviour as they choose healthier foods. The second is industry-led reformulation towards healthier products to achieve a better FoPL rating.
Empirical evidence on FoPL impacts on purchasing include a 2018 Cochrane meta-analysis,2 which found that labels reduced energy intake per meal by 47 kcal (95% CI −15 to –78; n=1877 pooled observations) in real-world studies, with supportive evidence from controlled experimental settings (MD −50 kcal, 95% CI −104 to 4, n=1705). However, the quality of evidence was low, and much evidence for grocery store settings was of very low quality. Another systematic meta-analysis, based primarily on interventions done in restaurants, cafeterias and experimental settings, found labels reduced energy intakes by −6.6% (95% CI –8.8% to 4.4%; n=31 studies), total fat by −10.6% (95% CI –17.7% to –3.5%; n=13) and increased vegetable consumption by 13.5% (95% CI 2.4% to 24.6%; n=5).3 A third review published in 2020 determined that FoPL had limited effects on consumer behaviour.4 New observational evidence has emerged that postdates the systematic reviews above. This includes a study of the Dutch Choices label,5 which highlights eligible healthier products, found that increasing label adoption led to an increased household volume share of purchases for dairy products and sauces that adopted the label, but an insignificant or negative purchasing effect for cereals, fats and oils. Another observational study on Chile’s Law of Food Labelling and Advertising6 which mandates warning labels on unhealthy options found that the volume of high-sugar beverage purchases fell by −23.7% (95% CI −23.8% to −23.7%) or −22.8 mL/capita/day (95% CI −22.9 to –22.7) when the products compulsorily displayed warning logos. However, this study may have been confounded by advertising restrictions and school sales policies that were implemented concomitantly.
Most labelling studies do not include specific efforts to estimate the effect on reformulation. One of the above systematic reviews3 found labelling reduced product sodium contents by 8.9% (95% CI −25.7% to −0.2%, meta-analysis of four studies) and artificial trans-fat content by 64.3% (95% CI −91.1% to −37.5%, n=3), but there were only a handful of studies available for analysis. Observational studies found associations of labelling with reformulation of foods to healthier compositions for mandatory Canadian trans-fat labelling7 and the Dutch choices label.8 No anticipatory reformulation by industry was noted for the 2016 Chilean Law of Food Labelling and Advertising.9
To our knowledge, only a single observational household panel study has analysed the association of FoPL on nutrient purchasing including assessment of both the effects on food choices and food reformulation. This UK study,10 analysing the effect of adoption of voluntary FoPL by grocery chains on their own-brand products over 2006–2008, found that households reduced their monthly caloric purchasing by 588 kcal (95% CI 515 to 661), saturated fat by 14 g (95% CI 12.3 to 15.7), sugars by 7 g (95% CI 6.1 to 7.9) and sodium by 0.8 mg (95% CI 0.66 to 0.94).
Across the studies above, there is considerable heterogeneity: in FoPL design (eg, summary indicator systems vs colour-coded nutrient-based systems); objectives (targeting healthy foods, unhealthy foods or all foods) and application (for instance, settings may include cafeterias, fast food restaurants and grocery stores).
Australia and New Zealand (NZ) adopted the voluntary Health Star Rating (HSR) nutrition label in 2014.11 Illustrated in figure 1, it is a summary graded label, representing the nutritional profile of packaged foods with a score from 0.5 to 5 stars presented in increments of 0.5 stars. This nutritional profile calculation is based on the density of four negative components (sodium, energy, sugar and saturated fat), and two positive components (fibre and protein). This distinguishes it from labels only displayed on healthy products such as Dutch Choices; or those displayed only on unhealthy products, such as Chile’s warning labels. Two randomised controlled trials, not included in the above systematic reviews, found no statistically significant effects of HSR relative to control labels (Nutrition Information Panels (NIPs)) in changing the average healthiness of food purchases.12 13 But in contrast to experimental studies, product adoption of HSR is voluntary. HSR adoption varies with product healthiness—healthier products are more likely to voluntarily display HSR.14 Furthermore, experimental studies cannot usually gauge industry reformulation in response to labelling. Observational evidence, therefore, is important to gauge the effectiveness of HSR in driving healthier purchasing.
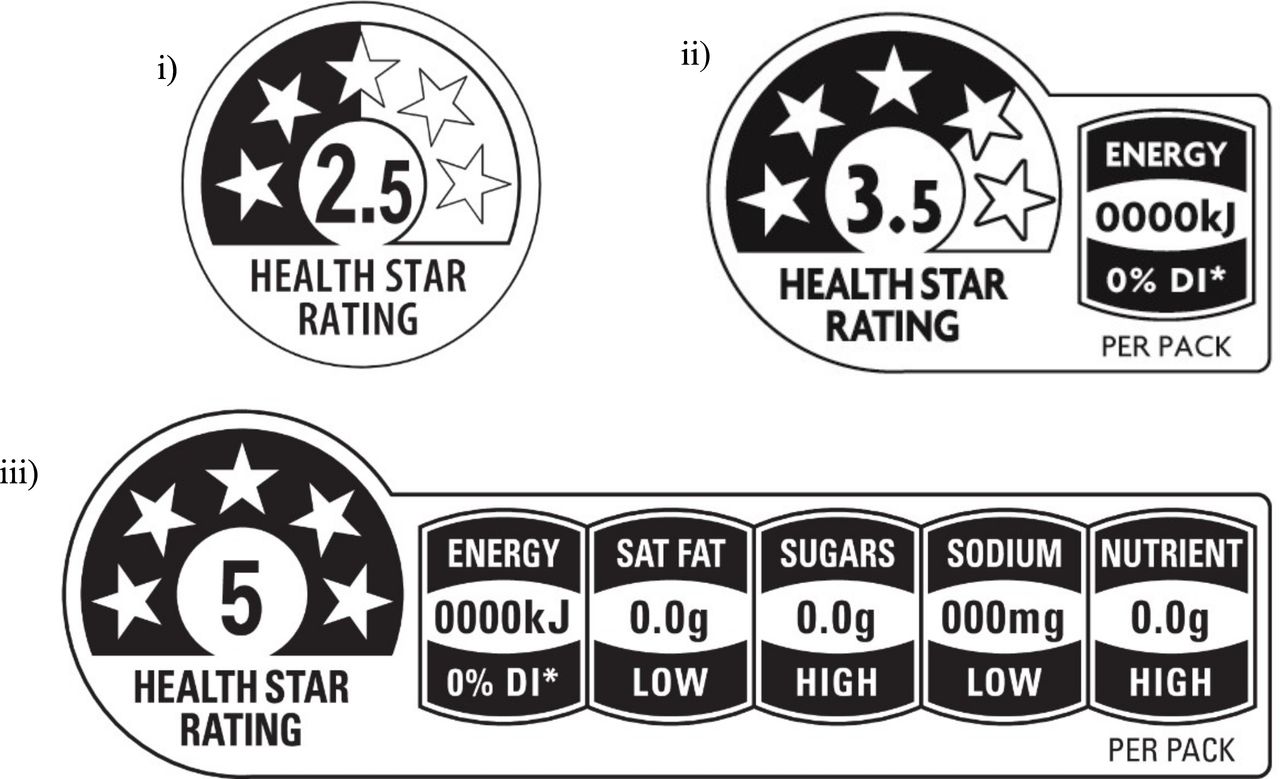
Examples of Health Star Rating configurations. Clockwise from top left: (i) Health Star Rating icon only, (ii) Health Star Rating and energy icons, (iii) Health Star Rating, energy, three prescribed nutrients, high and low indicators and optional nutrient.
We, therefore, use observational data to address two research questions. First, what is the association of HSR with product-level consumer purchasing and does this association change with the star rating displayed and product category? Second, what is the impact of HSR on nutrient purchasing (energy, sodium, sugars, saturated fat, fibre and protein). This second question builds on the first research question by also capturing potential effects of industry-led product reformulation consequent on HSR introduction, which we have reported in previous research.15 Our use of household panel data allows us to gauge the real-world effects of a voluntary FoPL on household food purchasing behaviours while also considering industry response to the voluntary HSR system. Previous experimental studies have been unable to assess real-world responses to a voluntary label.
Methods
Conceptual overview
We used linked product nutrition and purchasing data to perform our analyses. Nutrient purchasing is the volume purchased of each product, in grams or millilitres, multiplied by the nutrient density (say, sodium per g or millitre). Therefore, if HSR induces an x% change in consumer purchasing and y% change in nutrient density through reformulation, the overall change in nutrient purchasing is (x+y+xy/100)%.
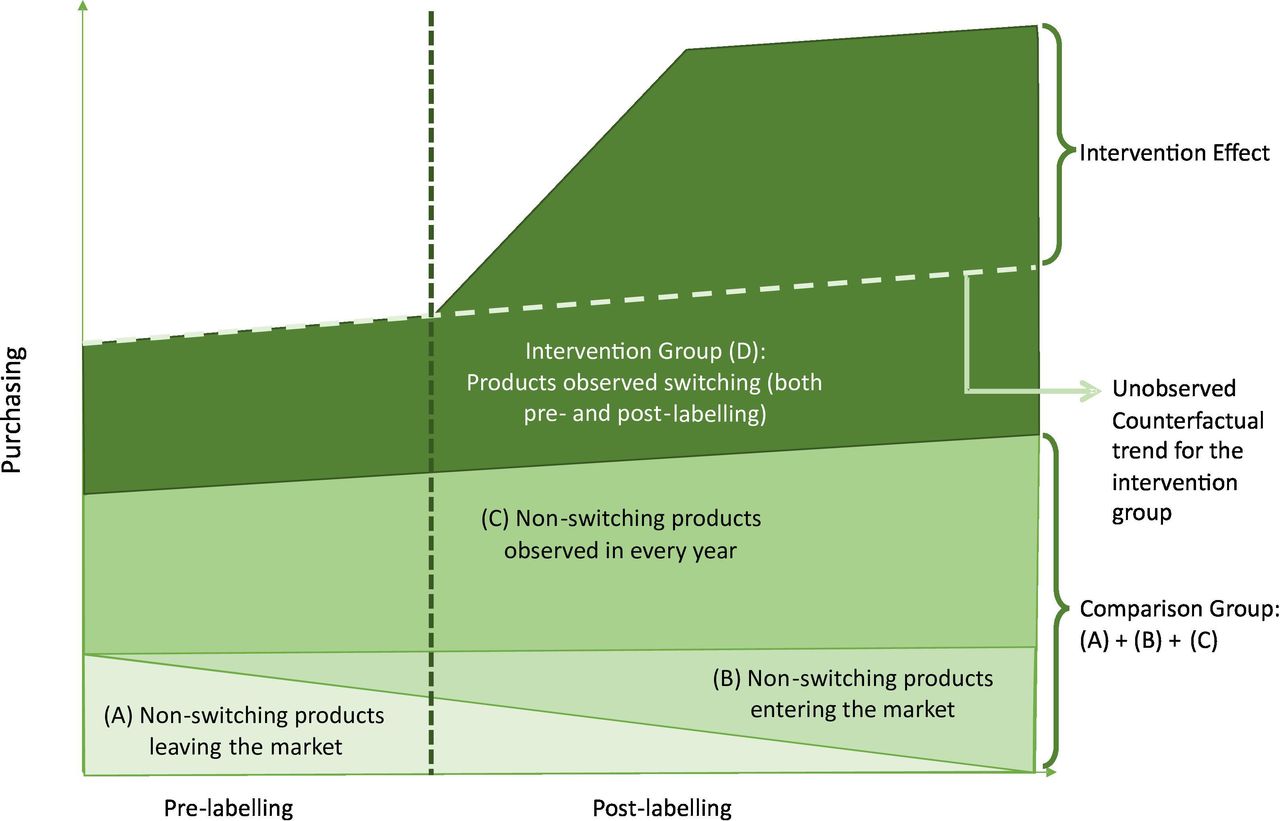
We use fixed effects to calculate the difference-in-differences estimate of the impact of HSR labelling on purchasing. This method estimates the change before-labelling and after-labelling for products in the intervention group, relative to a comparison group that captures potentially confounding market-wide purchasing trends. Our intervention group is the set of products that adopted the HSR label with at least one observation both before-labelling and after-labelling. The comparison group is the set of all products with at least two observations that do not switch (either HSR labelled or non-HSR labelled at both timepoints). The effect of HSR labelling is calculated after assuming that the intervention group would experience the same background trends in purchasing as the comparison group, had it not been labelled (the ‘parallel paths assumption’). A simplified illustration of the differences-in-differences strategy is plotted in figure 2.

Conceptual diagram of empirical methodology.
Additional sensitivity checks were performed, modifying the comparison group as well as on the sensitivity of our results to a weaker ‘parallel trends’ assumption. These are outlined in the section on robustness checks and sensitivity analyses, and in online supplemental appendices I and II.
Supplemental material
Data
We used Nielsen HomeScan data over 2013–2019, which is a continuous open cohort consumer panel survey of roughly 2500 households in major urban and secondary urban sites in NZ. The panel is sampled from 92% of NZ’s population. Products are indexed using the Universal Product Code barcode assigned to each individual Stock Keeping Unit (SKU), while the sampling unit is the household. Participating households regularly record all purchases of grocery goods, except tobacco, spirits and other non-food merchandise, using an electronic scanner or smartphone app on unpacking purchases at home.
Food composition data were obtained by linking HomeScan to Nutritrack packaged food composition and labelling data16 for the period 2013–2019. Nutritrack uses trained fieldworkers to collect on-pack labelling information (including whether the product was displaying HSR) and nutrient information mandatorily displayed on back-of-package NIPs for products sold at four major supermarkets (NewWorld, 4Square, Countdown, PAK’nSave) in Auckland, NZ. Annual data collections occur between February and April. Due to the February–April collection period in Nutritrack, HomeScan purchases were aggregated to a yearly level with the year starting on 1 October of the year prior, to 30 September of the current year. HomeScan food products were then linked to Nutritrack using product barcodes in the corresponding year. Excluding fresh food and alcohol, roughly 80% of HomeScan purchases were able to be matched to product labelling and composition data. These 25 604 products represented 85% of the observations in Nutritrack, but only 50% of 51 309 products in HomeScan. This highlights that although most household food purchases are captured, many products consumed at low levels are excluded from our sample. Excluded products also include omissions in Nutritrack—bulk bin products, seasonal products like easter eggs and specialty goods. We excluded herbs and spices, which are not intended to display HSR. We also imputed the difference in ratings between matched and unmatched foods, which was 0.04 stars. Online supplemental appendix III details further information about the difference between matched and unmatched foods.
Exposure
The exposure of interest was whether each food product displayed the HSR label in each annual wave as ascertained from the linked Nutritrack data. The exposure  captured the display of the HSR logo on product
p
at time
t
. We used the displayed HSR rating to calculate a categorical exposure variable
captured the display of the HSR logo on product
p
at time
t
. We used the displayed HSR rating to calculate a categorical exposure variable  (0=unlabelled, 1=0.5–1.5, 2=2.0–3.5, 3=3.5–5.0 stars) for products with low (least healthy), moderate and high (most healthy) HSR scores.
Healthiness of foods
Our research questions require stratifying food products by the level of healthiness (ie, we hypothesised that the effect of adopting an HSR label might vary by the healthiness of the food product). We use the categorical variable based on the displayed rating (above) for these analyses because these are the ratings observed by consumers. For summary statistics on unlabelled products and for sensitivity checks on matching products by healthiness, we imputed an HSR score for all products, based on the back-of-package NIP mandatorily displayed on products and the publicly available HSR algorithm.17
Outcome
Our primary outcome was the quantity purchased of product
p
by a household
h
at time
t
, in grams or millilitres  .
.
To address research question 2, nutrient purchasing for energy, sodium, sugar, saturated fat, protein and fibre was calculated by multiplying the quantity with the nutrient density (per 100 g or mL), collected through Nutritrack. As is common in the literature,6 10 since the quantity purchased is right-skewed we use the log of the quantity  or nutrient purchased
  as the preferred outcome.
Covariates
Time-varying confounders
At the household level, these included the number of adults and children; and categorical variables for household income in $NZ (≤12 000, 12 001–22 000, …, ≥140 000), buyer’s age (under 25, 25–29, 30–34, 34–39, 40–49, 50–65, 65+ years) and household type (adult-only households, young families, older families).
At the product level, we included the average purchase price and the average proportion of purchases for which the product was on promotion. Competition among products in each food category may be linked to changes in purchasing; we therefore adjusted for the number of SKUs in each subminor category at each wave as a proxy for competitiveness. Similarly, changes in brand size (eg, the range of unique products sold under a single brand name) may influence purchasing; we therefore adjusted for the number of unique products in the same brand per time.
Econometric method
We use a difference-in-difference design to analyse the association of labelling on our outcome measures. The methodology is detailed in online supplemental appendix I.
Robustness checks and sensitivity analyses
We undertook several robustness checks, varying the outcome measure and testing the stability of our difference-in-differences methodology to changes in the comparison group and weakening the assumptions underlying the estimator—producing more robust estimates. These are discussed in online supplemental appendix II.
Role of the funding source
The funder had no role in any aspect of the study. The corresponding author had full access to all the data and the final responsibility to submit for publication.
Results
Summary statistics
Table 1 highlights the characteristics of the 11 434 unique products in 2019, of which 25.2% displayed HSR ratings. HSR-labelled products were likely to be healthier: 43.5% have ratings of 4.0–5.0, compared with 26.0% of all products (using imputed HSR ratings on all products), and only 12.0% of HSR-labelled products display ratings between 0.5 and 2.0 compared with 15.7% of all products.
Product-level summary statistics for the merged HomeScan-Nutritrack data, for HSR-labelled and unlabelled products over the last year observed (2019)
HSR displaying products were more likely to be cereals, convenience goods, sauces and fruit and vegetable, meat and seafood products. Confectionary, sugars and honey and non-alcoholic beverages were three categories less likely to display HSR. In an unadjusted analysis, HSR-labelled goods have larger package sizes compared with unlabelled goods (460/mL vs 393 g or mL) while selling at lower prices ($NZ4.0 vs $NZ4.9). HSR labels are also more likely to be adopted by brands with a larger number of products. This partly reflects store-branded foods leading the HSR adoption in supermarkets, which is common with voluntary FoPL.18 Online supplemental table A contains further baseline characteristics of HSR-labelled products we observe switching (in the year before they were labelled) to assist in the interpretation of results.
Figure 3 summarises HSR adoption trends over 2013–2019 by the score displayed, as the number of unique products (left) and percentage purchasing or volume share (right). HSR-labelled products account for 32% of volume share, while accounting for only 24% of unique products. This over-representation is greater for products with higher HSR ratings. In 2019, products with ratings of ≥3.5 stars account for 75% of the volume share of HSR-labelled product purchasing, while those with ≤1-star account for 6%.

Adoption of Health Star Rating (HSR) by rating in the merged HomeScan-Nutritrack dataset 2013–2019, as per cent of unique products; and as per cent overall New Zealand-wide purchasing in g or mL.
To explore changes in purchasing over time, figure 4 shows just those 3109 products that adopted an HSR at some point in the observation period and that were observed (ie, available to purchase) in all years (ie, a subsidiary ‘balanced’ panel). The volume share by HSR category is stable, suggesting (prior to econometric analyses) that there is no marked impact of HSR on puchasing.

Percentage purchasing (using grams and millilitres) over time of products adopting the Health Star Rating (HSR) during the study period, for these products observed in each year over 2013–2019 (ie, including before they adopted the HSR), by the mean HSR rating eventually displayed on product packaging.
Econometric analyses
Change in consumer purchasing
Table 2 presents the fixed effects estimates of the overall percentage change in purchasing coincident on displaying an HSR label. There is no association overall (0.1% change overall, 95% CI −1.0% to 1.2%), and no association within any stratum of HSR score.
Changes in the household purchasing for HSR-labelled products, compared with non-HSR-labelled products (2 565 184 observations of purchases)
Stratification by food group
We also analysed changes in the log of purchasing for products in 43 food groups that adopted HSR. The results are tabulated in online supplemental table B and plotted in figure 5. Across products, no clear pattern of healthier purchasing is observed. Only three food groups had a statistically significant (5% level) difference from a zero per cent change; cheeses saw a large statistically significant positive association in postlabelling purchasing, while breads and desserts had negative associations (indicated in figure 4 by solid borders). A significant change for 3 out of 43 food groups is consistent with chance.
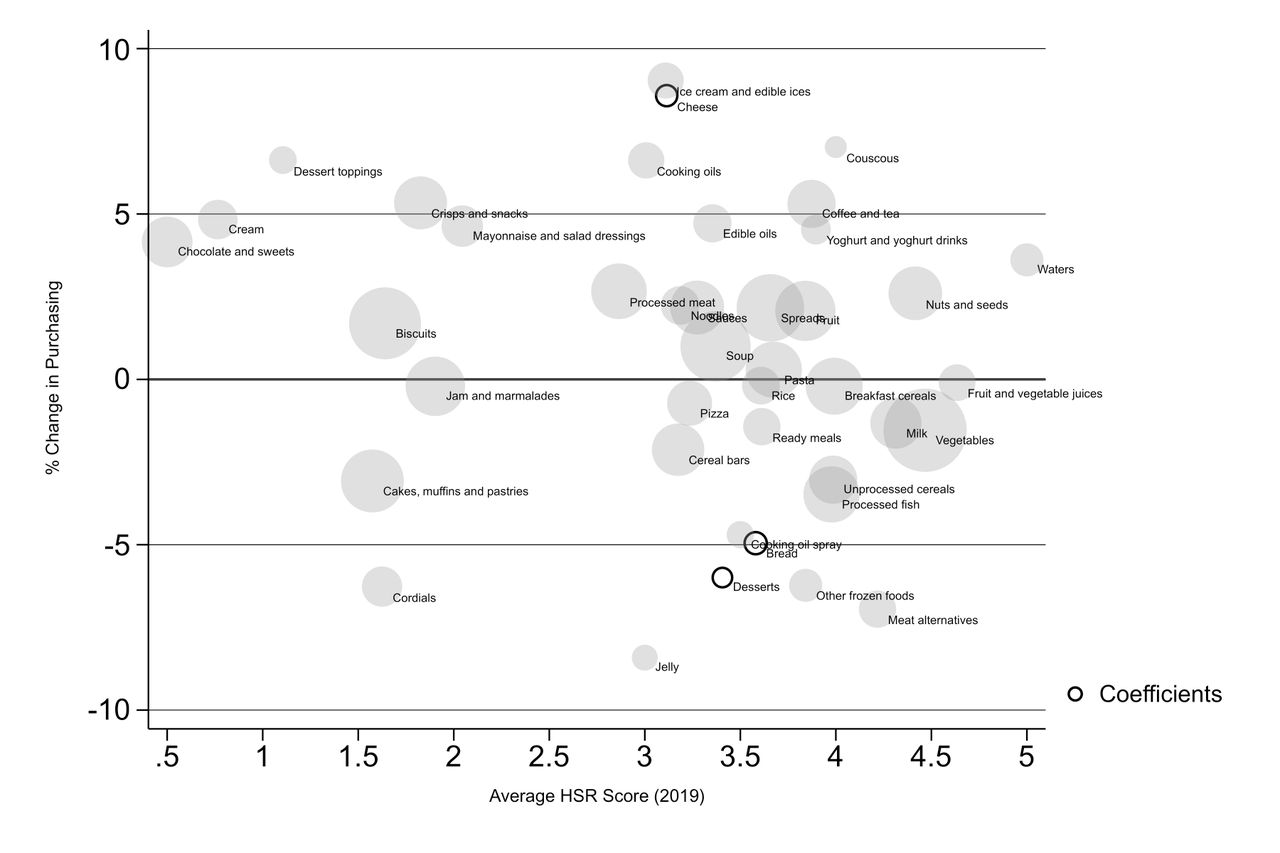
Health Star Rating (HSR)-linked per cent change in purchasing versus the mean HSR score displayed by category products in 2019. Markers scaled to 1/SE of the coefficient. The three solid outline circles had coeffficients from the fixed effects regression with 95% CI that excluded the null. The figure shows 42 food groups; 1 group (sugars, 22.5% increase) was removed as an outlier for clarity.
Changes in nutrient purchasing
Figure 6 presents the changes in nutrient purchasing (the joint effect of purchasing and reformulation changes), for the six key nutrients used to calculate the HSR score. Online supplemental appendix IV presents the change within 15 food groups. Care should be taken in the interpretation of food group-specific results due to several outlier results. Compared with non-labelled products, HSR-labelled products saw an 8.5% (95% CI: −13% to −5%) reduction in the quantity of sodium purchased, with a 2.5% (95% CI −4.7% to −0%) reduction in protein and a 4.9% (95% CI 2.2% to 7.5%) increase in fibre purchasing. No statistically significant change was observed in the quantity of energy, saturated fat or sugar purchased, although all three were reductions. There was no evidence of statistically significant heterogeneity of effect sizes by HSR score.

Per cent changes and 95% CI in the product-level log of nutrient purchasing for Health Star Rating (HSR)-labelled products, compared with non-HSR-labelled products. All estimates control for household, product and time fixed effects. Other covariates include household characteristics (number of adults, number of children, main buyer sex, main buyer age, household type, household income) and product characteristics (mean selling price, % purchases made on when the product on promotion, number of products in brand portfolio and number of products in HomeScan product category).
Robustness checks
The results of our robustness checks were similar to the results from the econometric analyses (online supplemental table appendix II). The one exception was a modest increase in volume share of 0.009% (95% CI 0.002 to 0.017) for adoption of HSR.
Discussion
Summary of key findings
We found no evidence of an association between HSR labelling, a comprehensive graded summary FoPL system on packaged food products, with the quantity purchased by households. However, given HSR adoption was associated with product formulation changes, there were effect of HSR introduction on nutrient purchasing with significant declines in sodium and protein purchases and a rise in fibre purchases.
Comparison with previous studies
Our study’s null finding for effects mediated by consumer choice aligns with findings from two randomised trials12 13 that also found no effect of HSR on purchasing, relative to back-of-package NIPs.
Nutrition labelling, though, can also drive healthier population diets through industry-led product reformulation. Our previous study on HSR-led reformulation14 found evidence of HSR labelling being associated with a 16.1 mg/100 g or mL (95% CI −25.3 to −6.8) decline in sodium density in NZ products, a −0.2 g/100 g or mL (95% CI 0.3 to 0.1) reduction in sugar density and a 0.04 g/100 g or mL (95% CI 0.01 to 0.08) increase in fibre density; although these results were not volume-weighted, in contrast to this current study which implicitly weights for household purchasing. The study found much of the reformulation effect arises from the adoption of HSR on less healthy products, rather than already healthy products.
Consumer panel data have been used increasingly to analyse the impact of FoPL on consumer purchasing. A study on the Dutch Choices FoPL5 found adoption of the label was associated with an increase in the volume share of labelled products in some but not all categories. Supplementary analyses for our study found that high rating (healthier) HSR-labelled products have a higher prelabelling volume share of purchases than unlabelled and low rating products. This underscores the importance of using methods such as fixed effects to account for confounding.
HSR has important contextual differences from other FoPL. It is a comprehensive summary graded indicator offered on both unhealthy and healthy products, in contrast to Dutch Choices which can only be displayed on healthier products (although voluntary adoption of the HSR sees it mostly displayed on healthy foods). HSR was adopted by both private label and own-brand products.
Strengths and limitations
Our study is the first quasi-experimental study analysing purchasing associations with a summary graded label, generating important evidence for policymaking. We use nationally representative consumer panel data, linked to annually updated labelling and nutrient composition information on non-seasonal packaged products sold in four major urban supermarket stores in Auckland, NZ. This analysis of 25 604 unique products constitutes the most comprehensive dataset for analysing the HSR scheme in NZ. However, the Nutritrack food composition dataset when linked to HomeScan panel data did not cover all purchases (around 85% of the purchases, and 80% of the volume share had linked formulation data). If the association of reformulation with the HSR was markedly different among the 15% of non-covered purchases, then our findings may be biased—but this seems unlikely.
Second, our analyses may be confounded by promotion changes concomitantly implemented with the introduction of HSR labelling. While we control for pricing, changes in product marketing that do not occur in-store, say TV or online advertising, targeted supermarket specials, etc may residually confound the analysis. Our result of an insignificant effect of HSR on consumer purchasing, therefore, does not control for any promotional advertising coinciding with HSR labelling.
Conclusions
We studied the effect of HSR on household food purchases in NZ, finding little or no changes in consumer purchasing behaviour. Industry-led product reformulation is therefore the primary mechanism for HSR to drive healthier purchasing in the context of current low levels of label adoption. Mandatory adoption of HSR,15 consumer education campaigns19 and additional features such as warnings for high levels of negative nutrients or colour-coding20 may increase the ability of HSR to change consumer purchasing behaviours and support healthier diets.
Data availability statement
Data are available on reasonable request. Data may be obtained from a third party and are not publicly available. Because of commercial and legal restrictions to the use of copyrighted material it is not possible to share data openly which reveal the product or supermarket names, but unredacted versions of the dataset are available with a licensed agreement that they will be restricted to non-commercial use. For access to Nutritrack, please contact The National Institute for Health Innovation at the University of Auckland at enquiries@nihi.auckland.ac.nz. For access to Nielsen HomeScan, please contact Nielsen at +64 9 970 4188.
Ethics statements
Patient consent for publication
Ethics approval
Not applicable.
Supplementary materials
Supplementary Data
This web only file has been produced by the BMJ Publishing Group from an electronic file supplied by the author(s) and has not been edited for content.
Footnotes
Contributors LB led the analyses, interpretation and write-up. CN-M and BN contributed to study design and securing funding, interpretation and write-up. KES and CLS contributed to econometric analyses, interpretation and write-up. TB led the initial study design and funding bids, and oversaw all aspects of analyses, interpretation and write-up. TB acts as guarantor for this study.
Funding Health Research Council of New Zealand Programme Grant 18/672.
Competing interests No, there are no competing interests.
Provenance and peer review Not commissioned; externally peer reviewed by Dr Sinne Smed, University of Copenhagen, Denmark.
Supplemental material This content has been supplied by the author(s). It has not been vetted by BMJ Publishing Group Limited (BMJ) and may not have been peer-reviewed. Any opinions or recommendations discussed are solely those of the author(s) and are not endorsed by BMJ. BMJ disclaims all liability and responsibility arising from any reliance placed on the content. Where the content includes any translated material, BMJ does not warrant the accuracy and reliability of the translations (including but not limited to local regulations, clinical guidelines, terminology, drug names and drug dosages), and is not responsible for any error and/or omissions arising from translation and adaptation or otherwise.