Article Text

Abstract
Introduction Home parenteral nutrition (HPN) is essential for patients with intestinal failure requiring long-term nutritional support. The Amerita Quality Improvement Project for HPN Patients (QIP-PN) explored the effect of a physician nutrition expert (PNE)-led multidisciplinary nutritional support team (MNST) on HPN care for patients under its service.
Objective To determine an MNST effect on adherence to protocols, outcomes and quality of life (QOL) in HPN.
Methods The study was divided into three phases: data review (phases 1a and 1b), observation (phase 2) and intervention (phase 3). Seven Amerita locations were selected as ‘study branches’ (population), from which all study patients and controls were drawn. The quality improvement project employed a quasi-experimental case-matched control group (control) design. Data were collected on demographics, treating physicians PNE status, HPN care variables, recommended interventions, quality-of-life assessment, adverse outcomes and hospitalisations. Paired t-test compared continuous data between phases 2 and 3. Comparisons between study and control groups used a negative binomial regression model.
Results Thirty-four patients were reviewed in phase 1a and 197 in phase 1b. Forty study patients completed phase 2 and progressed into phase 3, of whom 30 completed ≥60 therapy days. Patients were lost to follow-up if they discontinued HPN for any reason. Improvements in weight, body mass index and QOL were seen in the study patients during intervention. Recommendations made and accepted by treating physicians differed based on PNE status. Study patients had fewer adverse outcomes and related hospitalisations than controls.
Conclusion MNST recommendations improved clinical, biochemical parameters and patients’ self-reported overall health. MNST input reduced adverse outcomes, hospitalisation and the length of stay at the hospital. This study highlights the potential for MNST to have a significant impact on the quality and overall cost of HPN management.
- Nutrition assessment
- Nutritional treatment
- Malnutrition
- Inflammatory bowel disease
- Precision nutrition
Data availability statement
Data are available on reasonable request. Data are available in the form of multiple linked spreadsheets.
This is an open access article distributed in accordance with the Creative Commons Attribution Non Commercial (CC BY-NC 4.0) license, which permits others to distribute, remix, adapt, build upon this work non-commercially, and license their derivative works on different terms, provided the original work is properly cited, appropriate credit is given, any changes made indicated, and the use is non-commercial. See: http://creativecommons.org/licenses/by-nc/4.0/.
Statistics from Altmetric.com
WHAT IS ALREADY KNOWN ON THIS TOPIC
Proper home parenteral nutrition (HPN) surveillance requires nutritional support team (NST) monitoring. In the USA, NST monitoring of HPN patients is often performed without the input of a physician nutrition expert (PNE). This study was needed to examine whether a PNE-led multidisciplinary NST (MNST) could improve measurable parameters of HPN care.
WHAT THIS STUDY ADDS
The study demonstrated that MNST recommendations improved clinical and biochemical parameters along with patients’ self-reported overall health. Furthermore, MNST input reduced adverse outcomes, hospitalisation and hospital length of stay.
HOW THIS STUDY MIGHT AFFECT RESEARCH, PRACTICE OR POLICY
MNST input has the potential to significantly impact the quality, outcomes and overall cost of HPN management.
Introduction
Home parenteral nutrition (HPN) is a life-sustaining therapy for >25 000 US individuals (7.9/100 000) with intestinal failure (IF).1–3 HPN affords these patients functional lifestyles; avoiding hospital confinement4 5 while reducing overall cost of care.6 Appropriate HPN surveillance requires monitoring by a nurse, pharmacist and dietitian, who comprise a nutrition support team (NST).5 7–19 At advanced centres, NSTs may also include physician nutrition experts (PNE).20
US HPN patients are typically serviced by a home infusion company, whose NST members assist referring physicians in HPN management. The input of a PNE is not required to provide HPN.21 Implementation of HPN standards22–25 may rely on the treating physicians.26–28 This is concerning because the majority of HPN patients are managed by physicians without nutrition certification (internal data, Amerita].
This investigator-initiated study explored opportunities for quality improvement (QI) in HPN. Our objective was to determine the effect of a multidisciplinary NST (MNST), including a PNE, on adherence to protocols, outcomes of HPN care variables and quality of life (QOL) in HPN.
The primary hypothesis was that MNST intervention would improve HPN care variables. Another hypothesis was that MNST intervention would decrease adverse events such as unplanned hospitalisations. In this report, we detail our findings on MNST intervention on QI for HPN management.
Methods
Amerita, a national home infusion organisation (Amerita), established a QI project for HPN patients (QIP-PN). A MNST was created, consisting of a PNE, certified nutrition support clinicians (CNSC; Registered Dietitian (RD), Registered Nurse (RN), Registered Pharmacist (RPh)) and administrators. The QIP-PN study protocol examined multiple aspects of care for all HPN patients serviced by the organisation. The study Oversight and Safety Committee consisted of three non-affiliated PNEs.
Study design
Seven Amerita locations were selected as ‘study branches’ based on their case-load of long-term (>90 days) HPN patients. Amerita branches provide a variety of home infusion services other than HPN (ie, intravenous antibiotics, biologicals). The number of HPN patients at any given Amerita branch varies based on referral sources. Study branches were selected because they had a higher percentage of long-term HPN patients than non-study branches. Study branches tended to have more experienced HPN nurses, pharmacists and dietitians
All patients in the study were drawn from the population of long-term HPN patients at the study branches. As part of a QI project rather than a randomised controlled study, we employed a quasi-experimental design with a case-matched control group. The case-matched control group patients were randomly selected from long-term HPN patients at the study branches. This enabled us to compare MNST interventions to usual care.
The study was divided into three phases. Feasibility testing was conducted in phase 1a, in which patients at the study branches were randomly selected to determine that study parameters (table 1) could be extracted from medical records.
Study parameters examined in patients during phases 1a, 2 and 3
HPN complications rates were collected in phase 1b as part of QI HPN outcome reporting. This data established the baseline complication rates for comparison to actively enrolled patients in phases 2 and 3. Acquisition of this data also permitted us to create a case-matched control group from within the phase 1b patients with similar characteristics to the study group.
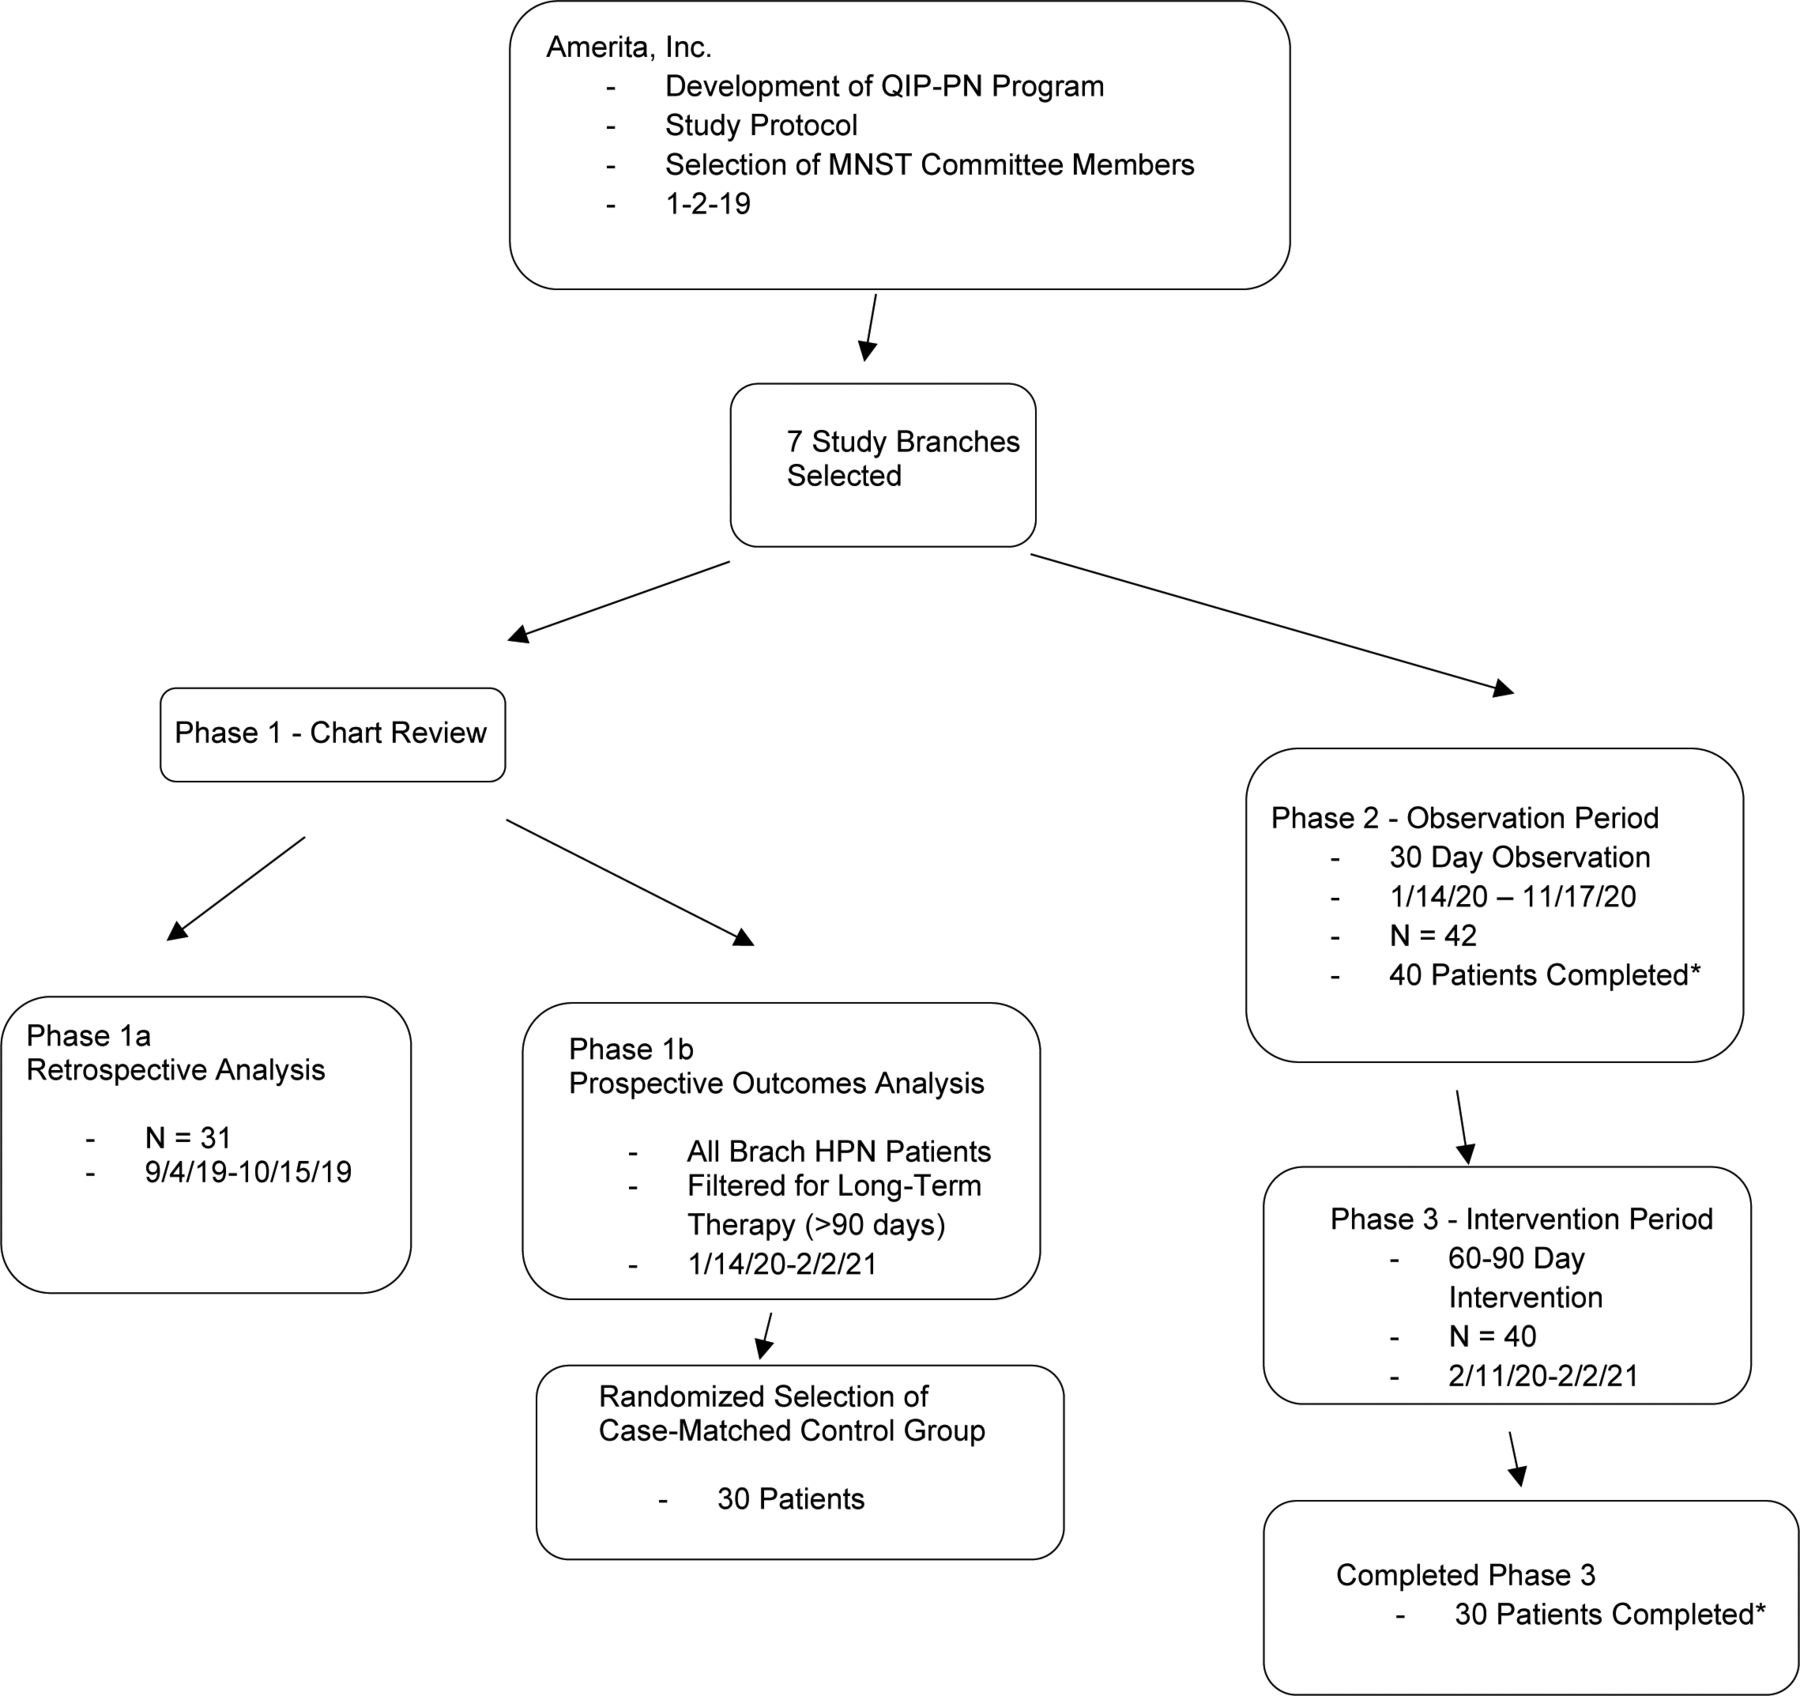
Consented study branch HPN patients were enrolled and monitored in phases 2 and 3. The same patients flowed through from phase 2 to 3 except for those lost to follow-up. In phase 2, data were collected during HPN care with observation only. In phase 3, the MNST made recommendations to the management team regarding HPN care (figure 1).

Flowsheet of patient selection and participation in the Amerita QIP-PN Study. *Patients were lost to follow up if they discontinued HPN for any reason. HPN, home parenteral nutrition; MNST, multidisciplinary nutritional support team; QIP-PN, Quality Improvement Project for parenteral nutrition.
Study groups
The actual number of patients in any group varied because patients who were selected may have come off service before data collection was complete. Phase 1a was solely intended to confirm that study parameters (table 1) were retrievable from Amerita patient records. In phase 1b, all study branch long-term HPN patients were monitored for outcomes. All phase 1b patients were offered participation in phases 2 and 3. After providing informed consent, patients’ PN prescribing physicians were asked to sign physician study participation agreements. Patients from whom both informed consent and treating physician study participation agreements were obtained comprised the study group (figure 1).
The same patients were followed longitudinally through phases 2 and 3. The only difference between the phase 2 and 3 study population was the subtraction of patients who were lost to follow-up. The case-matched control group patients (controls) were randomly selected from phase 1b patients. Analysis of outcomes and PN management in the case–control group enabled us to establish a basis for these parameters under conditions of usual care.
Study components and timing
Phase 1a was conducted from 1 September 2019 to 15 October 2019. Phase 1b was conducted from January 2020 too February 2021. Phase was performed between January 2020 and November 2020. Phase 3 was conducted from February 2020 to February 2021. During phase 3, the MNST made management recommendations for adjustments in HPN care in accordance with established practice guidelines. These recommendations were provided to the patient’s treating physician by an Amerita branch clinician. The acceptance of MNST recommendations by the patient’s PN prescribing physician was recorded.
MNST interactions
Weekly telephonic MNST meetings were held as case conferences via indirect chart review. No patients were physically or virtually examined by the MNST members. The MNST functioned only as a consultancy service to the treating team based on data collected from the patient’s treatment team and homecare nurse.
The MNST recommendations were limited to those that related directly to the HPN process. The recommendations included macronutrient adjustments to conform to recommended guidelines, the addition or subtraction of micronutrients based on clinical and lab findings, changes in PN volume and rate based on patient responses, laboratory testing to conform to published standards and the frequency of home nursing and clinic visits.
For example, the MNST addressed noncompliance of specialised laboratory testing for micronutrients and essential fatty acids. When the MNST recommended additional lab testing the samples were obtained by the home healthcare nurse as part of usual patient care. The MNST also addressed instances in which laboratory or clinical findings were recorded but not acted on. Other issues, such as optimising intestinal rehabilitation, dietary adjustments and medication recommendations/adjustments were considered outside the scope of the MNST.
Data collection
In phase 1b, HPN outcomes were monitored prospectively in study branch patients as part of the National Home Infusion Foundation (NHIF) benchmark reporting process. In phases 2 and 3, data on the study parameters were prospectively collected on enrolled study patients during weekly virtual meetings of the MNST.
Statistical analysis
Comparisons between phase 2 and phase 3 patient data were performed by paired t-test, which was utilisable because the same patients were followed through both phases. Therefore, the study patients in the observation period (phase 2) served as their own controls for the intervention period (phase 3). For the comparison between the phase 3 study group and controls, an independent samples t-test was used only when the outcome variable is assumed to have normal distribution in the population. Comparison between the study and control groups used a negative binomial regression model for modelling outcome variable, rate of adverse events per 90-day period. A negative binomial regression model was needed for modelling rate of adverse events per 90-day period as it is a count variable inflated with zeros. Statistical analysis was conducted using R ( https://www.r-project.org/ ).
PNE status of treating physicians
HPN treating physicians were classified as being either PNE or non-PNE, defined as those who were either board certified by the National Board of Physician Nutrition Specialists or had CNSC designation.
Study instruments
Patient QOL assessment
The Euroquol 5 Dimension-3 Level (EQ-5D-3L) quality-of-life instrument was chosen for its simplicity, acceptance and prior application in HPN.29–31 The EQ-5D-3L system has five dimensions: mobility, self-care, usual activities, pain/discomfort and anxiety/depression. Each dimension has three levels: no problems, some problems, extreme problems. Patients select the most appropriate statement in each dimension. A sixth dimension records the patient’s overall self-rated health state on a 0–100 scale where the endpoints are ‘Worst and Best Imaginable’. This was a quantitative reflection of the patient’s perception of health, scored as a Visual Analogue Scale (VAS).
The EQ-5D-3L was administered at the start of phase 2, start and end of phase 3. Due to COVID-19 restrictions on in-person contact, the EQ-5D-3L was administered via a telephone interview by an independent patient care coordinator who was not a member of the MNST, in accordance with the EQ-5D-3L guidelines.32 For this study, we used VAS score as a proxy for QOL.
Measure of multimorbidity and disease burden
We explored the use of multimorbidity scales for their application to HPN patients and elected to measure disease burden on study and control patients with the Cumulative Illness Rating Scale (CIRS).33 CIRS analyses multimorbidity by reviewing 14 body system categories, graded from 0 to 4.34–36 The CIRS approach has been validated as a predictor of hospitalisation, readmission and long-term mortality. CIRS scores range from 0 to 56.
Members of the MNST calculated comorbidity and illness severity, using the CIRS, based on information available in each patient’s electronic medical records. This included admission notes, medications, nursing notes, emergency department (ED) notes, imaging studies, physical and occupational therapy assessments, treatment/care plans and discharge summaries.
Results
Phase 1a/1b results
Phase 1a reviewed 34 patients. Phase 1b monitored 197 patients with 203 outcomes reported. Results for comparison in each outcome category were expressed in events per 1000 days of homecare service (the NHIF standard) and events per patient (table 2).
Phase 1b results
Phase 2/3 results
Forty-two patients were enrolled in the study. Forty completed 30 days or more of observation in phase 2 and progressed into phase 3. Thirty patients completed 60 days or more in phase 3. Patient were lost to follow-up if HPN was discontinued for any reason.
Results among participants between phases 2 and 3 for monitored parameters (tables 3–6).
Patient weight, body mass index (BMI) and percentage of ideal body weight (%IBW) (table 3). Average weight increased slightly between phases 2 and 3. However, three patients were outliers which altered these results. One was non-compliant. Two were obese and sought to lose weight while on parenteral nutrition (PN). All other patients sought weight gain or weight stabilisation. After excluding data for the outliers, the study group had statistically significant increases in weight, BMI and %IBW (via Hamwi method). Weight increased 1.78 kg; t(df=26) = −3.88, p=0.0006. BMI increased 0.7 kg/m2; t(df=26) = −2.08, p=0.047. The % IBW increased by 3.66%; t(df=26) = −2.26, p=0.0009.
Descriptive statistics of continuous variables for patients in phases 2 and 3
Characteristic of study group patients in the context of PN cost
PN order changes in study patients during phase 3
Recommendations and acceptances by treating physicians
Basic PN laboratory results (Complete Blood Count, Complete Metabolic Profile, magnesium, phosphate, triglycerides). Basic blood tests were performed regularly. Twenty-one patents received PN lab work weekly. Two received lab work every 2 weeks. Seven received lab work monthly. The frequency of lab work orders was based on the stability of the patient, but also varied by PNE status. Five of 7 that received monthly PN labs were followed by a PNE.
Specialised lab results. Specialised lab data on micronutrient levels was obtained in 27 of 30 patients (90%). Micronutrient levels were obtained prior to phase 3 in 9 of 30 (30%). Seven of these patients were cared for by a PNE. During phase 3, an additional 18 patients had micronutrient levels obtained. Three patients did not have micronutrient levels obtained either prior to or during phase 3.
PN component costs and modifications (tables 4–5). The overall cost of PN components decreased by 1.31% during phase 3. Costs ranged from a decrease of 26.22% to an increase of 76.28%. Costs were reduced when excess nutrients were found to be unnecessary (ie, thiamine, ascorbic acid and zinc from initial discharge orders). Costs increased when additional micromineral supplementation was required. Unprecedented, industry-wide price increases in specific components confounded MNST interventions to reduce PN costs. Product availability and shortages also impacted cost. Macronutrient orders were changed in 21 of 30 patients (70%), either because of inadequate weight gain, liver enzyme elevations or excessive weight gain. Electrolytes and micronutrient orders were changed based on lab results.
Patient QOL assessment (figure 2). The average EQ-5D-3L VAS score of overall health rose from 59.41 to 71.65 by the end of phase 3. This represents an increase of 12.24 points±10.0, or an improvement of 20.6% (t(df=28) = −4.10, p=0.0003).
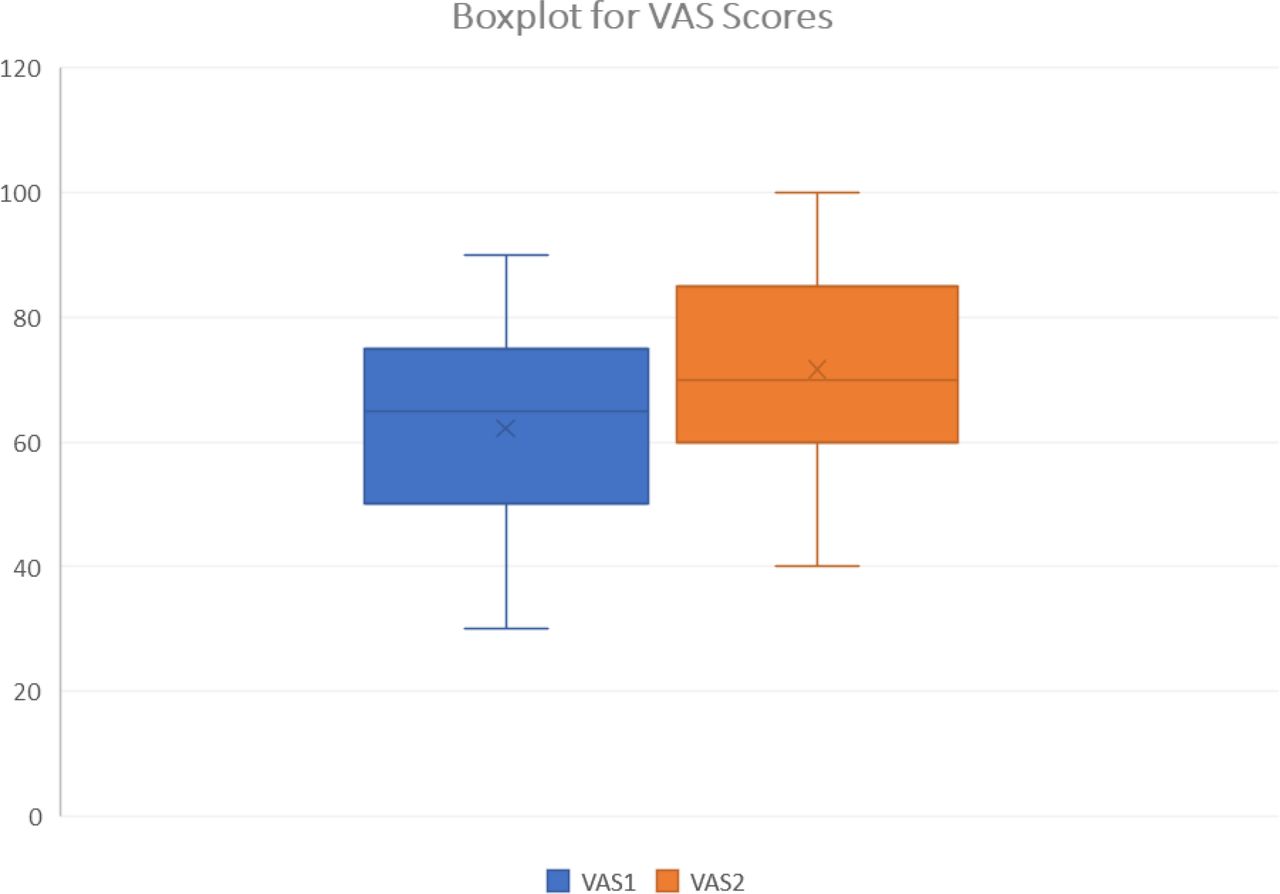
Boxplot of VAS scores. Boxplot representation of QOL EQ-5D 3L VAS scores before and after phase 3. EQ-5D 3L, Euroquol 5 Dimension-3 Level; QOL, quality of life; VAS, Visual Analog Scale.
Recommended interventions (table 6). The MNST made a total of 157 recommendations for compliance to standards of care in phase 3. Treating physicians had final authority to either accept or reject the recommendations. There were significantly fewer recommendations if the treating physician was a PNE (3.09±1.92 vs 5.86±1.89, p=0.0001). Recommendation acceptance was high (87.2%) but was significantly lower if the treating physician was a PNE (2.36±2.42 vs 5.28±2.22, p=0.0008). Impact on outcomes from non-accepted recommendations was not assessed.
Biochemical parameters. MNST recommendations resulted in improved electrolyte balance in 15 patients, improved liver function in 11 and reduced triglycerides in 3. Micronutrients were adjusted in 22 patients. Subsequent improvements were detected in zinc (10 patients), manganese (6), chromium (5), selenium (5) and copper (2) levels. Vitamin D was adjusted in five patients, thiamine in five, ascorbic acid in one and cyanocobalamin in one, with subsequent improvement of parameters.
Comparison between study patients and case-matched controls (tables 7–11).
Demographic characteristics of study patients and case-matched controls
Diagnostic categories of study patients and controls
Catheter characteristics of study patients and controls
PN order changes in study patients and controls
Adverse outcomes in study patients and controls
Patient characteristics (tables 7–8). Study patients and controls had similar demographics, comorbidity, payer mix, hospital referral source and PNE prescriber status.
Catheter Characteristics (table 9). Both groups had similar numbers of infusion ports. The study group had more tunnelled catheters (ie, Hickman, Broviac, Groshong catheters) whereas control patients had more peripherally inserted central catheter (PICC) lines. More study group patients were visited by Amerita staff nurses than by home health agency nurses. A similar number of patients in both groups had bio-occlusive catheter dressings.
PN order changes (table 10). PN formula changes were 20% more frequent among the study patients than controls. Macronutrients were modified 142.4% more often, micronutrients 350% more often and volume 137.5% more often in study patients than controls. Conversely, electrolytes were modified 97% as often and duration 84.6% as often in study patients than controls.
Adverse outcomes (table 11). There were 10 total outcomes reported among the phase 3 patients (0.33/patient), including seven unplanned hospitalisations. Three of the hospitalisations were therapy related. There were two ED visits among phase 3 study patients.
Phase 3 patients had fewer total adverse outcomes (3.64 vs 4.33 per 1000 therapy days), unplanned hospitalisations (2.54 vs 3.65 per 1000 therapy days) and access device events (0.338 vs 0.432 per 1000 therapy days) compared with phase 1b. ED use was higher in the study patients than phase 1b (0.338 vs 0.299 per 1000 therapy days).
There were 16 total adverse outcomes among the control patients (0.53/patient), with 14 unplanned hospitalisations. Three hospitalisations were therapy related. There were 2 ED visits among the control patients during the study period.
Total hospitalisations and length of stay (LOS). Seven study group patients were hospitalised 11 times during phase 3 (hospitalisation rate=0.37 admissions/patient). Three patients had only one hospitalisation, four had a second hospitalisation while none had a third. The readmission rate of study group patients was 0.13 (number of readmissions/number of patients). The total study group LOS was 69 days, average LOS (hospital days/number of hospitalisations) was 6.27 days.
Thirteen control group patients were hospitalised 20 times during the 90-day review (hospitalisation rate of 0.67). Eight had only one hospitalisation, five had a second hospitalisation and two had a third. The readmission rate of control group patients was 0.23. The total control group LOS was 153 days, average LOS was 7.65 days.
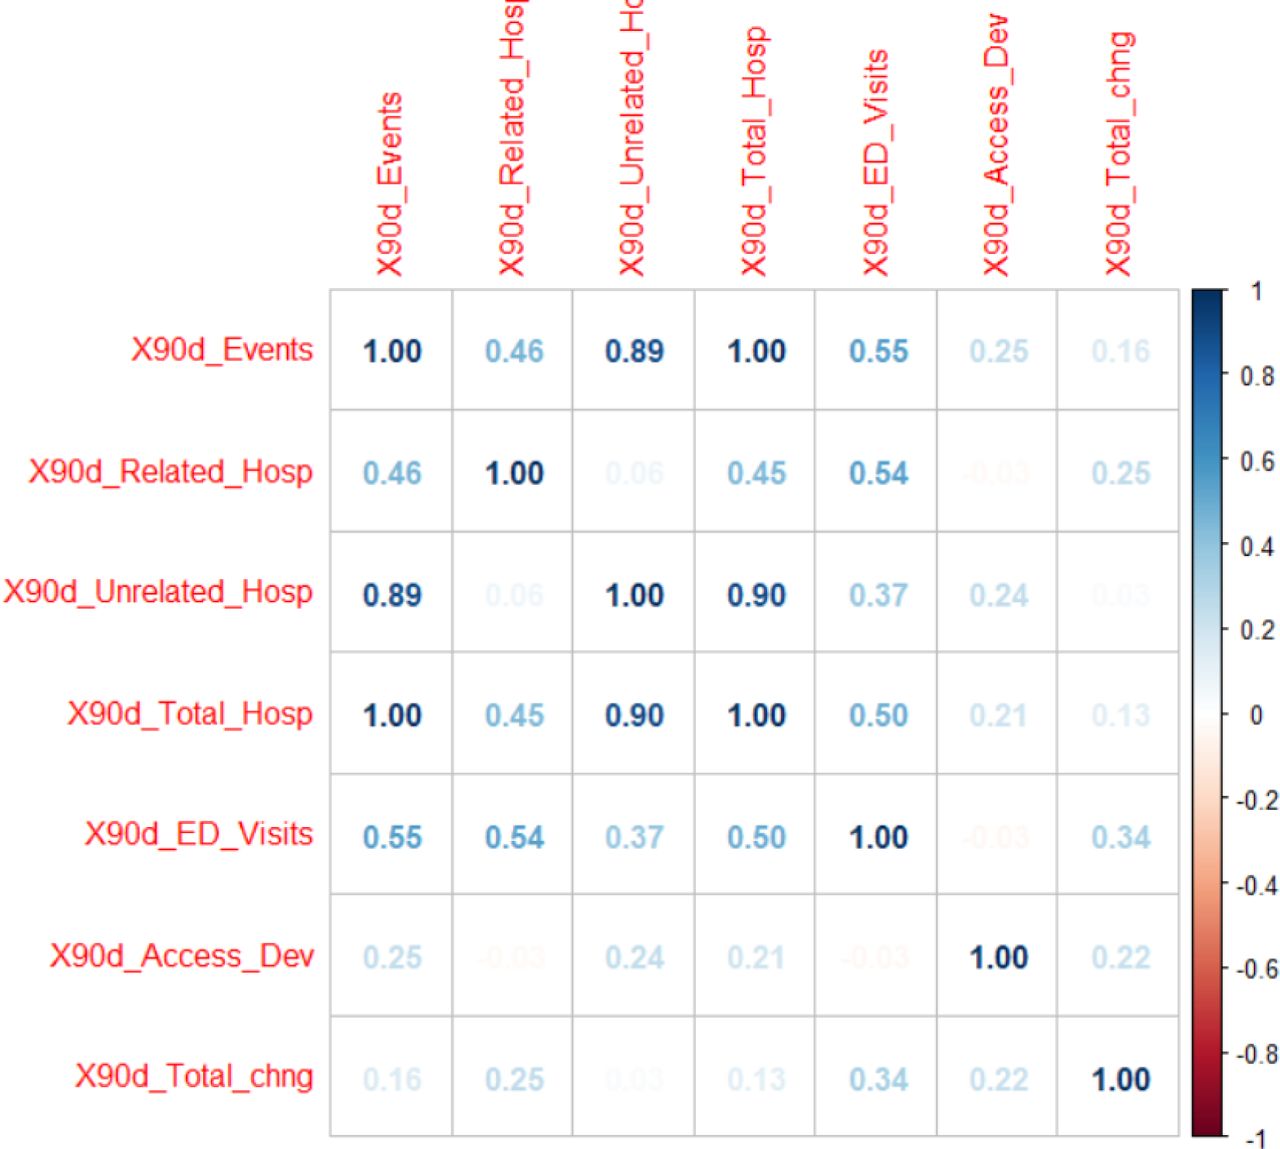
Statistical analysis of phase 3 study patients and controls (table 12). Comparison between the study and control group used a negative binomial regression model for modelling outcome variables. We used a negative binomial regression model to explain how this outcome is related with other possible predictors and to create a prediction model. Among the available count-data based predictors, 90-day related hospitalisations, 90-day access device events and 90-day total change were chosen as possible predictors because of their low correlation with 90-day events and with each other.
Results of modelling outcome variable, rate of adverse events per 90-day period, based on zero-inflated count data
Figure 3 shows the Spearman correlation among these variables. In addition, we chose group (with control group as reference group), CIRS Score as other predictors. The results of negative binomial regression are displayed in table 5. Based on the results, group, CIRS score and 90-day hospitalisations, were significant predictors of 90-day (adverse) events at 5% alpha level. Specifically, rate of 90-day adverse events was significantly higher (3.56 times) for the control group than that for the study group, given all other predictors are in the model. Likewise, for a unit change in CIRS Score, the per cent change in expected incident rate of total 90-day events is by 16.6% (ie, exp(0.15350)–1), given all other predictors are in the model. For a unit change in 90-day unplanned hospitalisation—related to therapy (X90d_Related_Hosp), the per cent change in expected incident rate of total 90-day events is by 393% (ie, exp(1.59541)–1), given all other predictors are in the model.

Correlation Plot. Correlation plot of Spearman correlation to show relationships of seven count variables in the data file (with only study and case–control group patients). X90d_Events = total 90-day adverse events, X90d_Related_Hosp = 90-day hospitalisations related to therapy, X90d_Unrelated_Hosp = 90-day hospitalisations unrelated to therapy, X90d_Total_Hosp = 90-day total number of hospitalisations, X90d_ED_Visits = 90-day emergency department visits, X90d_Access_Dev = 90-day access device complications. ED, emergency department.
Discussion
This study demonstrated that a PNE-led MNST could improve quality of care in long-term HPN. MNST interventions resulted in improved nutritional status, fewer adverse outcomes, hospitalisations, hospital LOS and better QOL.
MNST recommendations improved HPN through compliance to standards of care and attention to PN formula adaptation based on physical findings and biochemical parameters. PN macronutrient changes resulted in clinical improvement, measured by weight gain and BMI. Improved biochemical parameters were seen in electrolyte balance, liver function, micronutrient balance and triglyceride levels.
An important aspect of the QIP-PN study was the relationship of recommendations made and accepted by the treating physicians. The majority of HPN treating physicians were not nutrition specialists. The MNST made 157 recommendations for HPN management and 373 suggestions for formula changes during intervention. The vast majority (87.2%) of these were accepted by the treating physicians. Fewer recommendations were required if the patient’s physician was a PNE. PNEs were less willing to accept MNST recommendations.
The EQ-5D-3L QOL index was an important aspect of our study. Although other QOL indexes have been used in HPN, we found that the EQ-5D-3L was well suited because of its simplicity. The EQ-5D-3L was previously shown to be feasible and relevant for HPN patients.32 Other HPN QOL indexes employ up to 20 measured parameters compared with 5 for the EQ-5D-3L. In addition, we found that the VAS score provided an advantageous single point of reference for the patients overall perceived condition.
The study made use of a CIRS measure of multi-morbidity. To our knowledge this is the first real world application of the CIRS approach in the HPN population. CIRS scores documented the complexity of HPN patients with a moderately high value in both the study patients and controls.
Total hospitalisations and LOS
There were fewer hospitalisations in study patients versus controls. The average LOS was 1.38 days shorter and there were 84 fewer hospital days among study patients than controls. There were fewer hospital readmission in study patients. No study patient was readmitted more than twice, whereas two of the control patients were admitted three times. The reductions in hospitalisation, LOS and rehospitalisation could have a significant impact on overall cost for HPN care.
Adverse outcomes
Study patients had statistically significant differences in total outcomes and unplanned hospitalisations. CIRS Score and 90-day therapy-related hospitalisations were significant predictors of total outcomes at the 5% alpha level.
Limitations
Our study group was small (30 patients and 30 controls) and the duration of the intervention period was short (60–90 days). Considering these limitations, additional research should be performed with a larger number of patients and longer timeframes of monitoring to affirm our favourable results.
Furthermore, our results may have been biased by the differences between the study group and controls. Case-matched controls had a higher proportion of PICC lines and fewer surgically placed central lines than the study group (40% vs 80%). In addition, more of the case-matched controls were followed by agency nurses than Amerita staff (60% vs 16.6%). These differences may have contributed to the more favourable results observed in the study group.
Conclusion
This study demonstrated that a PNE-led, MNST produced measurable improvements in the care of long-term HPN patients. The MNST made numerous recommendations for HPN management, most of which were accepted by the treating physicians. MNST input improved patients’ self-assessed overall health, while reducing adverse outcomes, rehospitalisation and hospital LOS. If extended to the entire population of long-term HPN patients, we believe that MNSTs could have a significant impact on the quality and cost of HPN care.
Data availability statement
Data are available on reasonable request. Data are available in the form of multiple linked spreadsheets.
Ethics statements
Patient consent for publication
Ethics approval
The protocol was granted Institutional Review Board (IRB) exemption under NIH guidelines (45CFR 46.104(d)(2)) by the Western IRB on 4 September 2019.
References
Footnotes
Contributors MR designed the study, served as principal investigator and is the author responsible for the overall content as the guarantor. MP reviewed the data and performed statistical analyses. RB collected data and participated on MNST weekly patient rounds and discussions. JH collected data and participated on MNST weekly patient rounds and discussions. FG participated on MNST weekly patient rounds and discussions and communicated recommendations to patients’ treating physicians. AT participated on MNST weekly patient rounds and discussions and communicated recommendations to patients’ treating physicians. DS participated on MNST weekly patient rounds and discussions and communicated recommendations to patients’ treating physicians. AD participated on MNST weekly patient rounds and discussions. MS participated on MNST weekly patient rounds and discussions. DR collected data for phase 1b of the study. VP served on the Study Oversight and Safety Committee. KS served on the Study Oversight and Safety Committee. NA served on the study oversight and safety committee.
Funding The authors have not declared a specific grant for this research from any funding agency in the public, commercial or not-for-profit sectors.
Competing interests MR and MS are paid consultants for Amerita. RB, JH, FG, AT, DS, AD and DR are paid employees of Amerita. MP, VP, KS and NA have no conflicts.
Provenance and peer review Not commissioned; externally peer reviewed.