Article Text

Abstract
Background Good nutrition is essential for individual health, a notion that is particularly true during pregnancy. We have used a nutrition index that measures the adequacy of one’s diet relative to the unique nutritional needs of individuals due to, for example, their activity level, dietary restrictions, lifestyle and body size. The use of this personalised metric of dietary nutritiousness in the analysis of prenatal environmental exposures and developmental outcomes permits testing for potential mitigating effects of good nutrition. We also provide an analysis strategy for investigating the balance in beneficial food sources which are also the source of environmental toxicants.
Methods A holistic measure of nutrition, My Nutrition Index (MNI), measures the nutrient quality (ie, ‘nutritiousness’) of a specified daily diet. MNI is calculated based on quantification of dozens of macronutrients and micronutrients that are specific to an individual’s nutritional needs by incorporating dietary restrictions, subject characteristics, activity level and health behaviours. The Swedish Environmental, Longitudinal, Mother and child, Asthma and allergy Study is a Swedish pregnancy cohort, with prenatal endocrine disrupting chemicals (EDCs) exposure and dietary data available. This makes it possible to test for the potential mitigating effects of good nutrition on health and development effects in offspring from EDCs.
Results Using prenatal Food Frequency Questionnaire data to construct an individual’s MNI, the index was significantly and positively associated with important metabolic outcome (as measured by birth weight) and cognitive function at age 7 years (as measured by WISC IQ) in children when adjusted for covariates and prenatal concentrations of an EDC. In a stratified analysis of ‘low’ and ‘high’ fish consumption, a potential source of perfluoro-octanesulfonic acid (PFOS), the association between PFOS and birth weight was diminished in the high consumption group compared with the low consumption group.
Conclusions Thus, MNI is evidently a metric of the general nutritiousness of daily diets and is useful in environmental health studies in representing the impact of good nutrition, even during pregnancy.
- cognitive performance
- nutrition assessment
This is an open access article distributed in accordance with the Creative Commons Attribution Non Commercial (CC BY-NC 4.0) license, which permits others to distribute, remix, adapt, build upon this work non-commercially, and license their derivative works on different terms, provided the original work is properly cited, appropriate credit is given, any changes made indicated, and the use is non-commercial. See: http://creativecommons.org/licenses/by-nc/4.0/.
Statistics from Altmetric.com
What this paper adds
Good nutrition is essential for individual health, a notion that is particular true during pregnancy. We have used a nutrition index, My Nutrition Index, that measures the adequacy of one’s diet relative to the unique nutritional needs of individuals due to, for example, their activity level, dietary restrictions, lifestyle, and body size.
The use of this personalized metric of dietary nutritiousness in the analysis of prenatal environmental exposures and developmental outcomes permits testing for potential mitigating effects of good nutrition.
We also provide an analysis strategy for investigating the balance in beneficial food sources which are also the source of environmental toxins.
Introduction
Adequate prenatal nutrition is important for pregnancy outcomes such as metabolism and growth as well as neurodevelopment.1–3 Most research papers on prenatal nutrition focus on single nutrients although daily diets include mixtures of nutrients—where some may be adequate and others are not. My Nutrition Index (MNI) is a personalised holistic measure, ranging between 0 and 100, of the nutritiousness of one’s daily diet that accommodates dozens of dietary nutrients as well as personalised nutritional needs. MNI incorporates dietary restrictions, individual characteristics (ie, age, height, weight, sex), activity level, and health behaviours/conditions (eg, pregnancy, smoking status) and chronic diseases (eg, diabetes with sugar restrictions, hypertension with sodium restrictions, pancreatitis with guidelines for protein and fat intake) into its calculations.
The particular focus of this study is the dietary needs of pregnant women. Nutritional guideline values are different for pregnant women compared with women of the same age for vitamins (A, thiamin, riboflavin, niacin, B6, folate, B12, C, E), minerals (calcium, iron, magnesium, zinc) and fibre.4 In the calculations for the MNI in our study, these altered guidelines were used in the calculation of MNI.
Prenatal dietary choices have been shown to be associated with fetal growth and neurodevelopment for the child. For example, prenatal consumption of vegetables has been shown to have beneficial effects on birth weight.5 Adequate prenatal concentrations of vitamins, minerals, protein and essential fatty acids have been shown to have beneficial effects on birth weight and the developing brain, while deficiencies of these nutrients can have the opposite effect.2 6 However, the complexity of overall nutritiousness during pregnancy—as measured by an index reflecting adherence to the dietary recommendations—has not been used to evaluate pregnancy outcomes and neurodevelopment.
An important environmental health research question is whether good nutrition mitigates the impact of environmental toxicants; that is, whether good nutrition changes the slope associated with the environmental toxicant and the health outcome—an interaction. For example, prenatal exposure to bisphenol F (BPF) has been shown to be associated with neurodevelopment and decreased cognition at age 7 years.7 We are interested in evaluating whether that adverse association is diminished with good nutrition. A more complex scenario is that a good diet may be a source for chemical exposure, as is the case with perfluoroalkyl acids (PFAAs), (eg, fish consumption is a source of perfluoro-octanesulfonic acid (PFOS) uptake) where prenatal exposure for several single PFAAs has been shown to be associated with a lower birth weight.8 9 An interesting line of inquiry is measuring the balance between a healthy prenatal diet which may also be a source of environmental toxicants.
The objectives of our study were to determine if the nutritiousness—as measured by MNI - of the diet of pregnant women is associated with children’s birth weight and cognitive functioning at 7 years of age. A further aim was to examine whether nutrition as measured by MNI may mitigate the effect of prenatal environmental exposures in two scenarios: (1) Whether good prenatal nutrition interacts with BPF related to neurodevelopment. (2) Whether good prenatal nutrition, which may be the source of exposure to PFOS, improves the associated adverse effect on birth weight.
Methods
SELMA study description
The dietary habits of pregnant women in the Swedish Environmental, Longitudinal, Mother and child, Asthma and allergy (SELMA) cohort were measured using the Food Frequency Questionnaire (FFQ) data given in mid pregnancy (median week 20). SELMA is a pregnancy cohort study, designed to investigate early life exposure to environmental chemicals (median week 10 of pregnancy) and health outcomes related to metabolism and growth, neurodevelopment, sexual development, and asthma and allergy.10 SELMA recruited pregnant women in the county of Värmland, Sweden, between September 2007 and March 2010. Women who could read Swedish and were not planning to move out of the county were recruited at their first antenatal care visit; 8394 pregnant women were identified, 6658 were eligible and 2582 (39%) agreed to participate. Detailed recruitment selection criteria and sample collection procedures have been published previously.10 Participants provided written consent.
Outcomes in the children
Data on birth weight and gestational age, as well as maternal weight, age and parity were retrieved from the Swedish Medical Birth Register. Trained psychologists evaluated cognitive functioning using the Wechsler Intelligence Scale for Children, fourth edition (WISC-IV).11 A full-scale IQ was used, reflecting overall cognitive abilities, and is indexed to have a mean and SD of 100,and 15, respectively. The test was conducted at 7 years of age.
Dietary assessment
The self-administered FFQ in the SELMA Pregnancy Cohort Study, conducted in mid-pregnancy, included questions on 98 commonly eaten foods covering the whole diet. This FFQ is a modification (some food items added) of the FFQ developed and validated and used in repeated measurements of diet in two longitudinal prospective population-based cohorts in central Sweden.12 13 Data are available for 1769 pregnant women. Categories of food times included grain products/cereals; meat; fish; poultry; eggs; legumes; potatoes; vegetables; fruit/berries; cakes/sweets; and other (eg, coffee cream, salad dressing, extra salt). The questionnaire inquired only about the frequency of consumption without specification of portion size. Participants were asked how often, on average, they had consumed these foods during pregnancy. Eight predefined frequency categories included ‘Rarely/never’, ‘1–3 times/month’, ‘1–2 times/week’, ‘3–4 times/week’, ‘5–6 times/week’, ‘one time/day’, ‘two times/day’ and ‘3+times/day’. There were also open questions about daily/weekly consumption of bread types, milk, yoghurt, soft drinks, tea, coffee, cheese and liver pate. All self-reported frequencies were transformed to daily consumption (times/day) and weekly consumption (times/week=7*times/day). For each food item, total consumption per day was calculated by multiplying the frequency of consumption by age-specific portion sizes, based on mean values from a total of 5922 days of weighed food records kept by 213 randomly selected women from the study area. Intake of nutrients, and total energy was calculated using food composition values obtained from the Swedish National Food Agency database. The database is based on analyses of representative foods on the Swedish market, and cooking losses have been taken into consideration for prepared foods and dishes. A similar FFQ was evaluated for reproducibility and validity by the same research team.14
Description of MNI
MNI is a metric of general nutritiousness of one’s daily diet based on published guideline values for dozens of macronutrients and micronutrients and dietary components.4 It is comprised of: total fat, saturated fat, monounsaturated and polyunsaturated fat, energy, dietary protein, dietary carbohydrates, alcohol, caffeine, sugar, dietary fibre, vitamin E as α-tocopherol, vitamin C, cholesterol, potassium, sodium, calcium, magnesium, iron, phosphorus, zinc, thiamin, riboflavin, niacin, vitamin B5,vitamin B6, vitamin B12, vitamin A, vitamin D, vitamin K, manganese, chloride, folate and selenium. It is a metric of how close each component is to guideline values based on the appropriateness of the response for the characteristics of the subject. It assigns higher scores for nutrient concentrations that fall within the published dietary guidelines recommended concentration range and assigns lower scores if intake for a given nutrient deviates from this optimal range (ie, deficient or excess intake). It provides an overall index score ranging from 0 to 100, with higher scores reflecting a more nutritious diet. Thus, a perfect MNI Score would be obtained if adequate intake of all nutrients is met. Herein, MNI derives nutrition information from FFQ data in the SELMA pregnancy cohort. MNI also incorporates dietary restrictions, individual characteristics (ie, age, height, weight, gender), activity level and health behaviours (eg, pregnancy, smoking status) into its calculations. Therefore, MNI is adjusted per participant based on her optimal nutrient intake as defined by the published guidelines for recommended target ranges for each component.
To illustrate, the Mediterranean diet is a heart healthy eating plan with a suggested daily menu provided in online supplementary table A1 in the appendix. For a moderately active average sized young man, the specified Mediterranean diet has a MNI value of 95, indicating a nutritious diet. However, for a middle-aged, lightly active, petite woman the specified Mediterranean diet has too many calories and carbohydrates, too much sodium, saturated fat, total fat and not enough vitamin D; the MNI for this woman is 69. This illustrates that nutritional requirements change with individual characteristics. Moreover, MNI can be personalised to include health-related dietary restrictions. To illustrate, consider a middle-aged, petite, sedentary female with a chronic health condition requiring a high protein, low fat diet with caffeine restrictions. The resulting alteration in the Mediterranean diet has too many calories and carbohydrates, too much sodium, and total fat (consisting of high levels of saturated and unsaturated fats) and not enough vitamin D; the MNI is 45. The exercise demonstrates the complexity of ‘eating right’, particularly with health-based dietary restrictions. In observational studies, the characteristics of individual subjects are used in the calculation of the index so that it may best reflect the dietary practice and needs of the subjects.
Supplemental material
In the calculations for the MNI in our study, guidelines for pregnant women were used for dietary vitamins and minerals. We used questionnaire data for age, height, prepregnancy weight, activity level (on a scale of 1–5) and smoking status. We assumed general guidelines for protein (ie, 0.8 g/kg body weight) and 25% of calories from fat.
PFOS in prenatal serum
Total, non-isomer-specific PFOS in serum was analysed by liquid chromatography-tandem-mass-spectrometry (LC/MS/MS; QTRAP 5500, AB Sciex, Foster City, California, USA) at The Department of Occupational and Environmental Medicine (OEM) in Lund, Sweden. A method previously presented by Lindh was used.15 Briefly, aliquots of 100 µl serum were added with labelled internal standard for PFOS and precipitated using acetonitrile and vigorously shaken for 30 min. The samples were analysed in a randomised order and in duplicate. In each analytical batch, calibration standards, two home-made quality control (QC) samples and chemical blank samples were included. The limit of detection (LOD) was 0.06 ng/mL for PFOS. The coefficients of variation (CV) of the QC samples were 11% at 5 ng/mL and 10% at 10 ng/mL for PFOS. The analyses of PFOS are part of a QC programme between analytical laboratories (Erlangen, Germany). The laboratory also participates in the interlaboratory comparison (ICI) exercises in an External Quality Assurance Scheme (ie, the so-called ICI/EQUAS exercises) for the analysis of PFOS and is approved by the HBM4EU project, a joint effort of human biomonitoring in 30 European Union countries.
BPF in prenatal urine
BPF in urine was analysed by LC/MS/MS at OEM in Lund, Sweden.16 Briefly, 200 µl aliquots of urine were treated with β-glucoronidase (Escherichia coli), at 37°C for 30 min, thereafter labelled internal standard for BPF was added. In each analytical batch, calibration standards, a QC sample and chemical blank samples were included. The LOD was 0.024 ng/mL for BPF. The CV of the QC sample for BPF was 9% at 6 ng/mL. Creatinine was measured enzymatically and used to adjust analyte concentrations for urine dilution. The laboratory participates in the ICI/EQUAS exercises for the analysis of BPF and is approved by the HBM4EU project.
Selection of covariates
Adjustments were made for sex of the newborn, maternal smoking status (cotinine concentration >15 ng/mL), maternal weight at enrolment, prematurity (<37 weeks gestation), maternal education (some college or not) and estimated calories for all models. In addition, maternal IQ was included in the child IQ model and creatinine was included in the model with BPF.
Statistical analyses
We established a study set for analysis of birth weight and analysis of 7-year WISC IQ with complete FFQ data. There were 943 children with WISC IQ of which 868 children also had MNI data; of those, 788 had values for all covariates. The final set was 767 who also had values for prenatal urinary BPF (ug/l). With a minimum machine read value of −0.008, a constant of 0.01 was added to BPF to accommodate the log transformation. For the birth weight analysis set, there were 1657 children with birth weight taken from the Swedish national birth register. This full set had values for the nutrients and MNI; of those, 1518 had values for the covariates. The final set was 1312 who also had values for prenatal PFOS exposure.
Linear models were parameterised to include covariates, MNI and concentrations of an endocrine disrupting chemical (log transformed) previously shown to be associated with the outcome variable; that is, PFOS with birth weight and BPF with WISC IQ.8 17 We addressed the issue of the balance between good nutrition and dietary sources of toxicant exposures, as is the case for PFOS, in three steps: (1) We created a score for fish consumption using FFQ data. (2) We constructed an indicator variable for low and high fish consumption at varying cuts. (3) We selected the best split of fish consumption based on the log likelihood of a model with an interaction term between the indicator variable and logPFOS concentrations. This parameterisation permitted different slopes relating PFOS exposure and birth weight for high and low fish consumption. The linear term represents the slope of the logPFOS term with low fish consumption; the interaction parameter represents the difference in the slopes with low and high fish consumption. Thus, the sum of the linear and interaction parameters represents the slope of the high fish consumption group. We determined the optimal cut to define the low and high fish consumption groups by varying the cut and calculating the log likelihood from the resulting model.
A 5% significance level was used throughout.
Results
The mean MNI was 68 with a median of 70 in the 1769 pregnant women in SELMA (figure 1A). Only 10% of the sample had MNI values exceeding 85. Summary statistics are provided in table 1 for covariates and outcome variables for the two subgroups with data on birth weight and IQ.

(A) Distribution of My Nutrition Index in mid-pregnancy of the SELMA pregnancy cohort; and (B) scatter plot of MNI and the Fish Sum Index (sum of times/week of consuming freshwater fish). SELMA, Swedish Environmental, Longitudinal, Mother and child, Asthma and allergy.
Summary statistics for study sets for birth weight and 7-year WISC IQ
Cognitive function at 7 years
In the model for WISC IQ at 7 years, MNI, maternal weight, total energy, logBPF were all centred and scaled (mean=0, standard deviation (STD)=1) for interpretation of the regression coefficients in terms of STDs. The intercept (95.6) is the average 7-year IQ for the mean of these variables and the reference groups for the categorical variables: male, non-smoker, term birth and low education. Mean WISC IQ at 7 years increases 1.29 points for an STD increase in MNI when adjusted for cofactors (p=0.010; table 2). MNI was also statistically significant when adjusted for birth weight (p=0.017), creatinine and logBPF (p=0.009). In the fully adjusted model, BPF was negative and statistically significant (p=0.001). Interestingly, in this model mean IQ increases 1.29 units with an STD increase in MNI which is somewhat similar to the decrease in IQ of 1.38 points with 1 STD increase in logBPF.
Analysis of the association between MNI (Z-scored, in units of SD) from mid-pregnancy FFQs and WISC IQ at 7 years adjusted for covariates in table 1 (n=767). Continuous variables were Z-scored for ease of interpretation. The scale is an estimate of root mean square error
Birth weight
In analyses of birth weight, MNI, maternal weight, total energy, logPFOS were all centred and scaled. The intercept (3721 g) is the average birth weight for the mean of these variables and the reference groups: male, non-smoker, term birth and low education. The MNI was positively associated with birth weight (p=0.009; table 3). The index was also statistically significant when adjusted for logPFOS (p=0.005). In the fully adjusted model, PFOS was negative and statistically significant (p<0.001). The Spearman correlation coefficient between logPFOS and MNI is 0.05 (p=0.059) indicating the complexity of balancing the positive health effect of eating fish and exposure to perfluorinated compounds.
Analysis of the association between MNI (Z-scored in units of SD) from mid-pregnancy FFQs and birth weight adjusted for covariates in table 1 (n=1312). Continuous variables were Z-scored for ease of interpretation. The scale is an estimate of root mean square error
Analyses for dietary source of PFOS
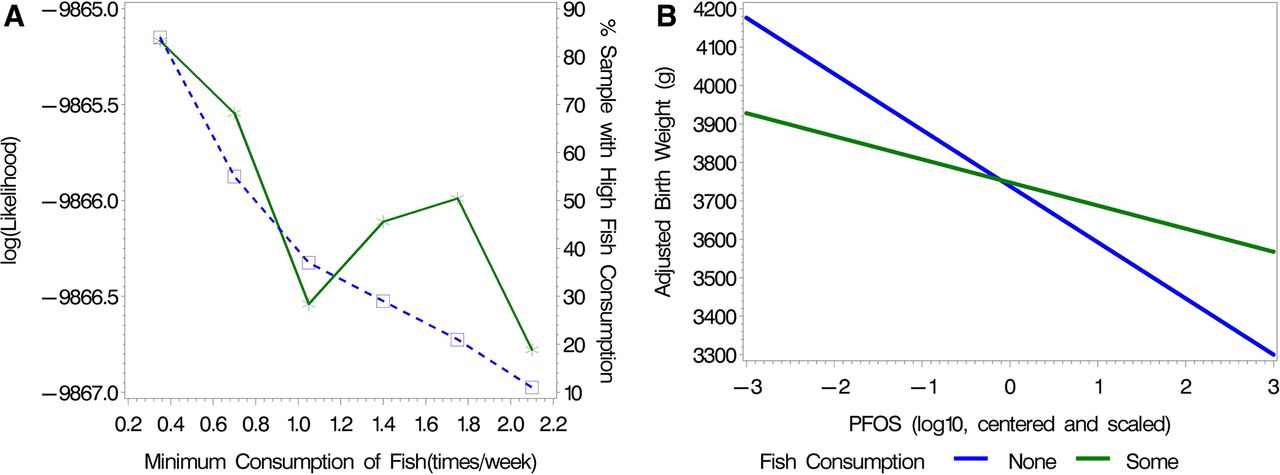
We are interested in evaluating the balance between good nutrition as measured by MNI when diet is a major source of toxicant exposures. We explored this question in the analysis of birth weight considering PFOS exposure and fish consumption. The mid-pregnancy FFQ included questions about eating freshwater fish (smoked fish, herring/mackerel, salmon, lake fish and other fish). These were each positively associated with logPFOS (with p<0.15). Their sum (in units of times/week) had a Spearman correlation with PFOS of 0.09 (p=0.002), indicating fish consumption may be a source of PFOS exposures. On the other hand, eating fish provides important nutrients including protein, polyunsaturated fats, fibre, iron, magnesium, potassium, selenium, zinc and vitamins (A, B, C and E). In fact, it was these nutrients that were associated with an increase in MNI as fish consumption increased. We investigated the question of whether the benefit of fish diminishes the negative impact of exposure for PFOS. We addressed this question by constructing an indicator variable for fish consumption above varying amounts and including both a linear and interaction term with logPFOS. Figure 2A demonstrates that the cut at 0.35 (times/week) is associated with the highest loglikelihood value. With this cut, 16% of the data were in the low fish consumption group—actually, with a score of 0 (ie, no fish in their diet). The slope of logPFOS related to birth weight in the low (ie, no) fish consumption group was −120.5; the slope for the high (ie, some) fish consumption group was −48.9 (figure 2B). There was a borderline significant difference between the association of PFOS and birth weight in the two groups (p=0.057, table 4). Thus, there is evidence that the value of eating fish diminishes the adverse effect of the exposure to PFOS.

(A) Determination of an indicator variable for fish consumption between ‘low’ and ‘high’ groups. The log likelihood (solid line) is from the adjusted models including an interaction term with logPFOS. Table 4 provides parameter estimates using the cut at 0.35. The per cent of subjects with high fish consumption (dotted line). (B) The resulting adjusted estimated association between no and some fish consumption using the cut for fish consumption at 0.35 (times/week), at the average for the Z-scored continuous covariates and at the reference level for the categorical variables (table 4). PFOS, perfluoro-octanesulfonic acid.
Adjusted analysis for the model of birth weight, adjusted for exposure of PFOS, nutrition as measured by MNI and covariates, with an indicator for low and high fish consumption defined by an indicator variable (see figure 2; with cut-off at 0.35 times/week). Continuous variables were Z-scored for ease of interpretation. The scale is an estimate of root mean square error.
Interaction with prenatal BPF exposure
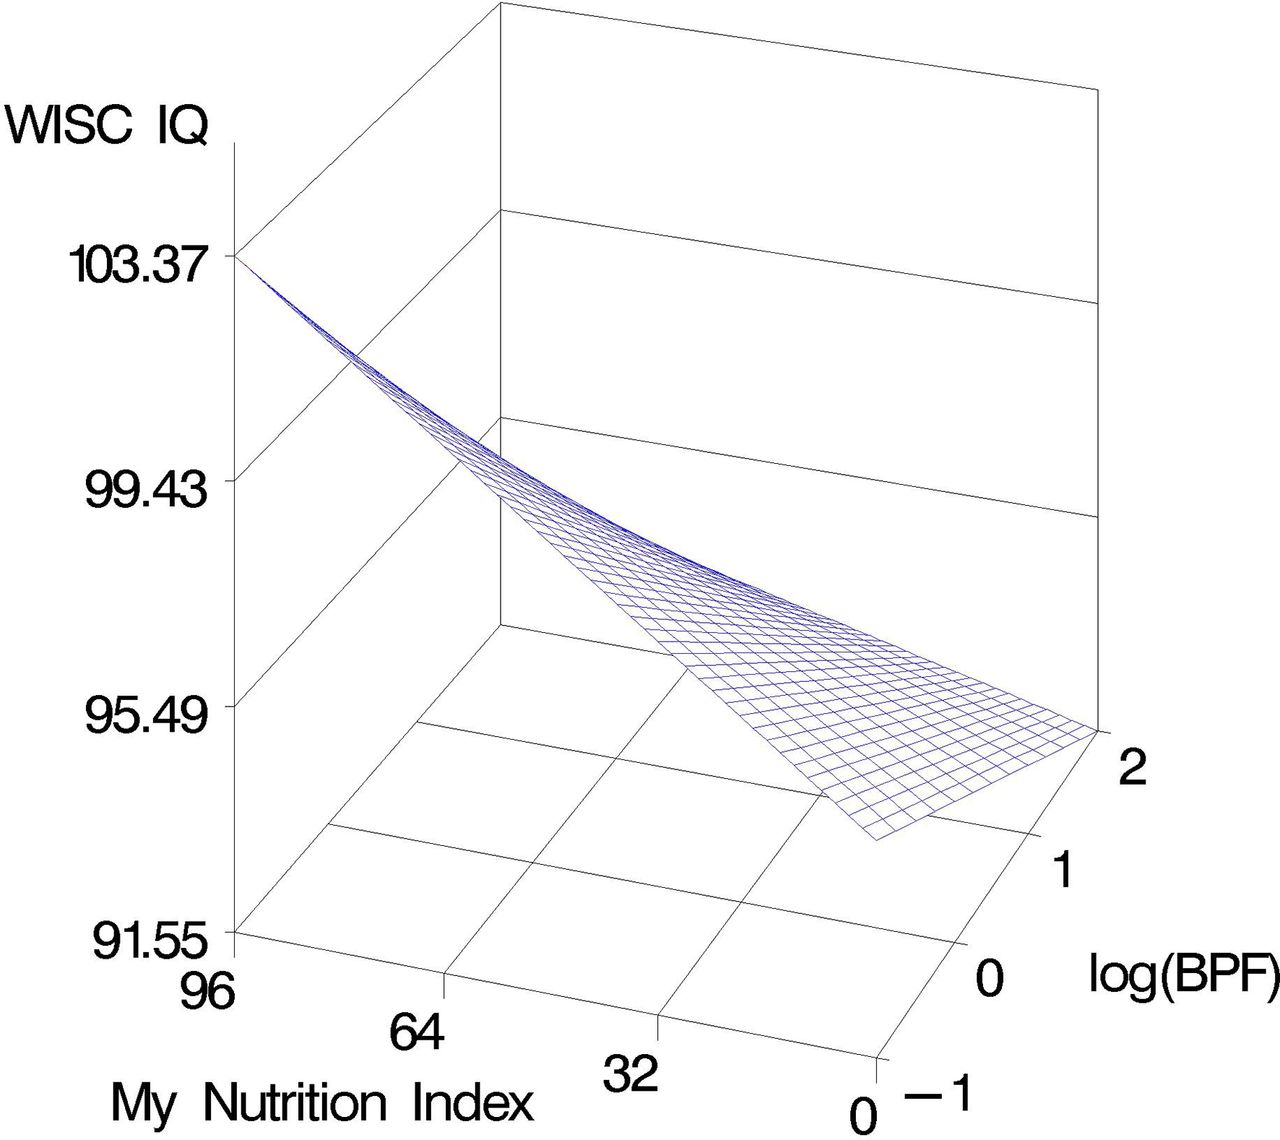
We are also interested in evaluating whether good prenatal nutrition as measured by MNI actually diminishes the impact of an environmental toxicant (BPF) on neurodevelopment—that is, an interaction. We parameterised a model, adjusted for covariates, for 7-year WISC IQ and the association with MNI and logBPF as in table 2, and included an interaction term. The interaction is not significant between MNI and logBPF (p=0.553; figure 3). Although these data do not demonstrate a true mitigating effect of nutrition on environmental toxicants (ie, a significant interaction where good nutrition diminishes the negative slope of the toxicant), they do allow a general visualisation that good prenatal nutrition improves important metabolic and cognitive measures in children for low-to-moderate prenatal exposures. However, the positive nutritional impact at low exposures is diminished with high environmental exposure to BPF as evidenced by the decrease in the slope of the surface when logBPF is at 2 ng/mL.

Estimated adjusted association in SELMA data between prenatal MNI and BPF, in predicting WISC IQ at 7 years; in a model with an interaction term between MNI and the toxicant. BPF, bisphenol F; MNI, My Nutrition Index; SELMA, Swedish Environmental, Longitudinal, Mother and child, Asthma and allergy; WISC, Wechsler Intelligence Scale for Children.
Discussion
The MNI is a metric for the nutritiousness of dietary intake that is measured using subject-specific characteristics. In the current study, we focus on evaluating nutrition during mid-pregnancy in the SELMA Study based on FFQ data. When adjusting for total calories, the MNI measures the nutritiousness of those calories based on macronutrients and dozens of vitamins and minerals. As anticipated, better prenatal nutrition using the MNI metric was significantly associated with higher birth weight and higher WISC IQ scores at age 7 years when controlling for cofactors.
In their review of the impact of prenatal dietary intake and birth weight, Greiger and Clifton demonstrate the inconsistencies across epidemiological and randomised controlled trials of single nutrients, particularly focusing on omega-3 long-chain polyunsaturated fatty acids, zinc, folate, iron, calcium and vitamin D.1 However, they determine there is some evidence that dietary intake of whole foods such as fruit, vegetables, low-fat dairy and lean meats throughout pregnancy may be associated with appropriate birth weight. The contrast in studies of single nutrients versus of whole foods and dietary patterns demonstrates the importance of accounting for overall nutrition as associated with health outcomes; that is, people do not consume single nutrients or foods, but combinations of foods.18 This is analogous to studying single environmental chemicals compared with mixtures of chemicals when human exposure is to mixtures.
Malin et al3 used a method for evaluating mixtures of nutrients that has been more commonly used for mixtures of environmental chemicals, namely, weighted quantile sum regression. They assessed prenatal and child nutrition profiles from FFQ data with child neurodevelopmental outcomes at 4–6 years of age using the McCarthy Scales of Children’s Abilities (MSCA), adjusting for covariates and total caloric intake. They developed weighted indices of ‘good’ and ‘poor’ nutrient mixtures of both dietary and supplemental nutrient intake. Multiple vitamins, minerals and monounsaturated fats were weighted heavier across the neurodevelopmental scales for good nutrition and better MSCA Scores. In comparison, high levels of sugar, sodium and saturated fats were associated with poor nutrition and worse MSCA Scores.
Dietary research trends are increasingly to use indices to evaluate dietary patterns, their alignment with dietary guidelines and the diversity of healthy food choices within important food groups.18 19 Dietary indices used in pregnant populations include the Diet Quality Index for pregnancy20 the Healthy Eating Index (HEI),21 the Alternative Healthy Eating Index for Pregnancy (AHEI-P),22 the Australian Recommended Food Score,23 the Canadian Diet Quality Index,24 the Mediterranean Diet Adherence Scores25 and the New Nordic Diet Score.26 Some of these are not sensitive enough to detect micronutrient inadequacies; however, the AHEI-P was associated with important pregnancy (pre-eclampsia) and birth outcomes (weight and length).19 Gunther et al evaluated FFQ data at the 12th and 29th weeks of gestation in the cluster-randomised GeliS Trial of 2286 pregnant women.5 They determined that consumption of vegetables and good dietary quality, as measured by HEI, were positively associated with birth weight. The HEI was calculated from the FFQ data as the average of scores of 14 food groups and their adherence to recommendations from the German Nutrition Society for a healthy diet where 0 indicated no adherence and 100 indicated high adherence to the recommendations. In contrast, the MNI is a metric based on 34 macronutrients and micronutrients—not food groups, and is calculated for specific requirements for individuals including behaviour (activity level, smoking status, dietary choices based on lifestyle—for example, high protein diets for body builders) and health conditions (eg, pregnancy).
We have used PFOS and BPF as common environmental toxicants to demonstrate the opposing directions of good nutrition as measured by MNI and adverse environmental toxicants in regression models. PFOS is in a chemical class of perfluoroalkyl acids, which are high-volume, synthetic chemicals found in many consumer products including stain-repellant and water-repellant textiles, non-stick coatings and firefighting foams.27 BPF is an emerging alternative to bisphenol A (BPA) and diet is considered the main source of BPA (eg, from canned foods). Alternatives to BPA were evaluated in the Canadian Alberta Pregnancy Outcomes and Nutrition (APrON) Pregnancy Cohort Study. Dietary sources of BPF include mustard consumption but not canned foods.28
Diet and chemical exposure
An advantage of using an index to represent dietary nutrition is that population-based studies may include the index in models that also account for environmental exposure to toxicants. The counterbalance between good nutrition and exposure to environmental toxicants is an important public health line of inquiry. It is of particular interest to determine whether good nutrition (based on a metric such as MNI) actually changes the slope of toxicants—that is, definition of an interaction. However, even when the interaction is not significant, there is value in noting the benefit of nutrition relative to the adversity to toxicants. Such was the case in the analysis of 7-year IQ where MNI was positive and significant but BPF was negative and significant.
A more complicated situation is when beneficial dietary components (eg, fish consumption) are a major source of the toxicant. Here, we parameterised a model with an interaction with an indicator variable to allow for different slopes for the toxicant with low and high fish consumption. A significant interaction term thus parameterised determines that there is a significant difference in the association of the toxicant with the outcome (birth weight) based on consumption. For example, herein we determined that the slope associated with PFOS and birth weight was more negative (with a borderline signifance) with no fish consumption compared with any fish consumption. Thus, there was some evidence that the benefit of eating fish diminished the adversity of PFOS on birth weight. Of course, such a claim should be carefully considered in that in this study, 95% of pregnant women consumed fish less than 3.0 times/week (figure 1B) and only 16% did not consume fish at all.
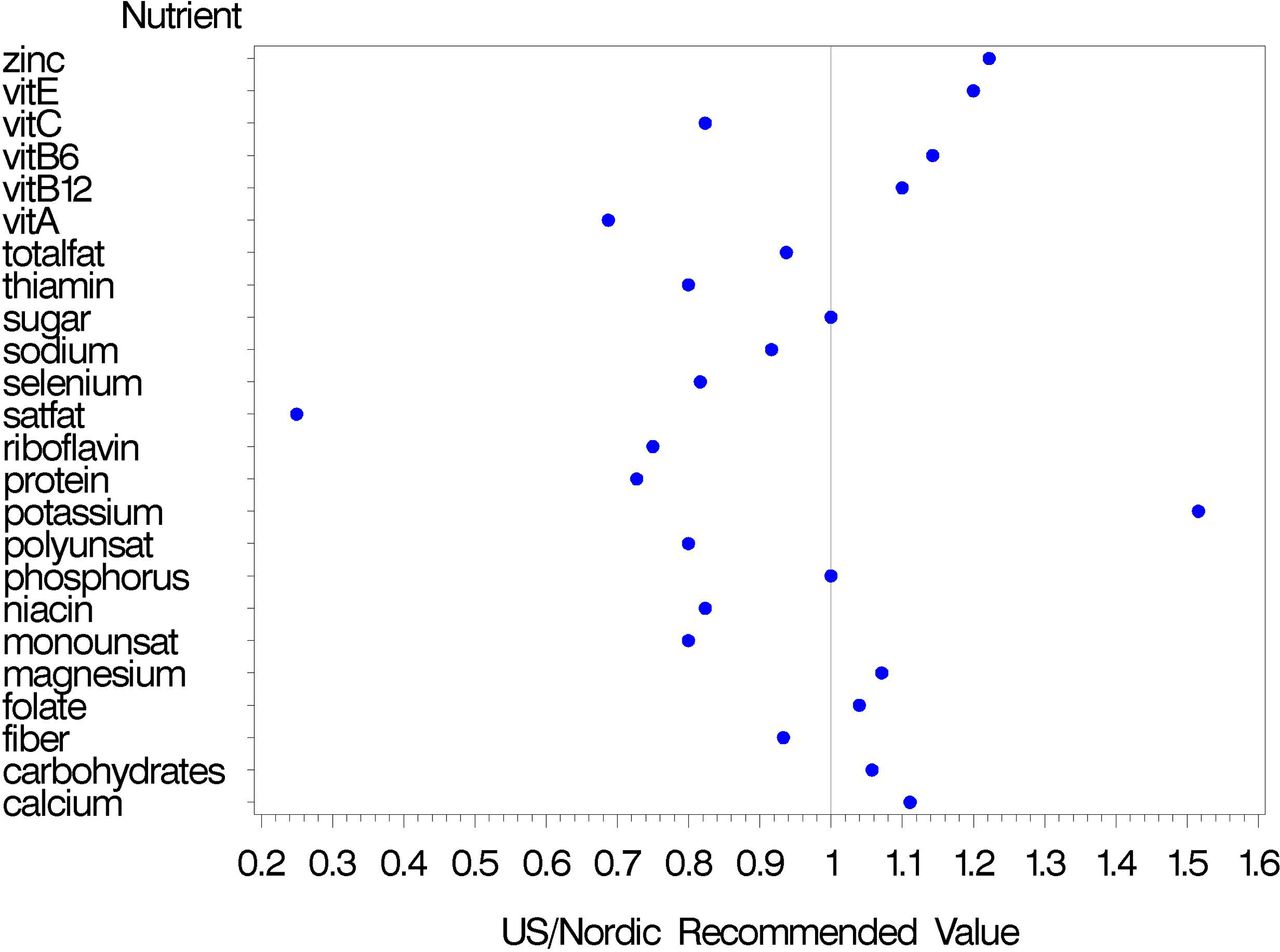
Our study was conducted using dietary data in Sweden. The construction of the MNI was based on recommended guidelines by the Institute of Medicine in the USA for pregnant women.4 Our objective is to evaluate the association between nutrition and important health outcomes using international data. Thus, we have created a single index based on published guideline values for nutrients and can evaluate the index across international studies. That is, the construction of the index is not dependent on cultural/regional dietary habits. These nutritient guidelines were generally similar between the US and the Nordic countries; that is, within about 25% of those recommended by the Nordic Cooperation for pregnant women (figure 4).29 The exceptions are saturated fats (US: <7% of total fat with 20%–35% of calories from fat; Nordic: <10% calories from saturated fats) and potassium (US: 4700 mg/d; Nordic: 3100 mg/d).
Comparison of nutritional guideline values from the United States Department of Agriculture (USDA) 4 for pregnant women compared with those from the Nordic Cooperation.29 Values exceeding 1 indicate higher guideline values from the USA.
Limitations of the study
There are limitations to our study. We have approximated prenatal nutrition from a single evaluation using FFQs during mid-pregnancy. Multiple prenatal FFQ evaluations would have provided information around the consistency of dietary intake across pregnancy. Similarly, child nutrition is also associated with neurodevelopment and was not evaluated in our study. Furthermore, we have measured prenatal chemical exposure at one point in time during the first trimester of pregnancy. Additional prenatal samples would have provided additional exposure information and would have allowed us to evaluate the importance of exposure windows during pregnancy.
Conclusions
Nutrition is a multifaceted, complex construct, where good nutrition should be associated with improved health outcomes; this is particularly true for prenatal nutrition. MNI is a metric for evaluating the nutritiousness of daily dietary intake. We have evaluated nutrition, adjusting for total calories, in regression models predicting important measures of child development. The index is informative in regression models that also include environmental toxicants such as PFOS and BPF to evaluate the potential mitigating effect of good nutrition and environmental exposures.
References
Footnotes
Contributors CG: conceptualisation, methodology, software, formal analysis, writing the original draft, project administration, funding acquisition. AW: data curation, writing review and editing. NH: data curation. CL: resources, writing review and editing. C-GB: investigation, writing, reviewing and editing, project administration, funding acquisition.
Funding This research received support from the NIEHS (#R01ES028811) for methods work and support for SELMA by the EDC-MixRisk (#634880) European Union’s Horizon 2020 Research and Innovation Programme.
Competing interests None declared.
Patient consent for publication Not required.
Ethics approval The study was approved by the Regional Ethical Review Board (Uppsala, Sweden).
Provenance and peer review Not commissioned; externally peer reviewed.
Data availability statement Data sharing policies will be in agreement with the European General Data Protection Regulation (GDPR) and SAS code for analysis will be available upon request.