Article Text

Abstract
Background In a single general practice (GP) surgery in England, there was an eightfold increase in the prevalence of type 2 diabetes (T2D) in three decades with 57 cases and 472 cases recorded in 1987 and 2018, respectively. This mirrors the growing burden of T2D on the health of populations round the world along with healthcare funding and provision more broadly. Emerging evidence suggests beneficial effects of carbohydrate-restricted diets on glycaemic control in T2D, but its impact in a ‘real-world’ primary care setting has not been fully evaluated.
Methods Advice on a lower carbohydrate diet was offered routinely to patients with newly diagnosed and pre-existing T2D or prediabetes between 2013 and 2019, in the Norwood GP practice with 9800 patients. Conventional ‘one-to-one’ GP consultations were used, supplemented by group consultations, to help patients better understand the glycaemic consequences of their dietary choices with a particular focus on sugar, carbohydrates and foods with a higher Glycaemic Index. Those interested were computer coded for ongoing audit to compare ‘baseline’ with ‘latest follow-up’ for relevant parameters.
Results By 2019, 128 (27%) of the practice population with T2D and 71 people with prediabetes had opted to follow a lower carbohydrate diet for a mean duration of 23 months. For patients with T2D, the median (IQR) weight dropped from of 99.7 (86.2, 109.3) kg to 91.4 (79, 101.1) kg, p<0.001, while the median (IQR) HbA1c dropped from 65.5 (55, 82) mmol/mol to 48 (43, 55) mmol/mol, p<0.001. For patients with prediabetes, the median (IQR) HbA1c dropped from 44 (43, 45) mmol/mol to 39 (38, 41) mmol/mol, p<0.001. Drug-free T2D remission occurred in 46% of participants. In patients with prediabetes, 93% attained a normal HbA1c. Since 2015, there has been a relative reduction in practice prescribing of drugs for diabetes leading to a T2D prescribing budget £50 885 per year less than average for the area.
Conclusions This approach to lower carbohydrate dietary advice for patients with T2D and prediabetes was incorporated successfully into routine primary care over 6 years. There were statistically significant improvements in both groups for weight, HbA1c, lipid profiles and blood pressure as well as significant drug budget savings. These results suggest a need for more empirical research on the effects of lower carbohydrate diet and long-term glycaemic control while recording collateral impacts to other metabolic health outcomes.
- diabetes mellitus
- dietary patterns
- weight management
- blood pressure lowering
- lipid lowering
This is an open access article distributed in accordance with the Creative Commons Attribution Non Commercial (CC BY-NC 4.0) license, which permits others to distribute, remix, adapt, build upon this work non-commercially, and license their derivative works on different terms, provided the original work is properly cited, appropriate credit is given, any changes made indicated, and the use is non-commercial. See: http://creativecommons.org/licenses/by-nc/4.0/.
Statistics from Altmetric.com
What this paper adds
For those choosing a lower carbohydrate dietary approach for an average of 23 months it is possible to achieve a 46% drug-free T2 diabetes remission rate in UK primary care whilst also achieving significant improvements in weight, blood pressure and lipid profiles.
In patients with prediabetes (HbA1c 42 to 48 mmol/mol), a LCD approach reduced HbA1c to within a non-diabetic threshold in 93% of patients.
Our audit showed participants who started with the worst blood sugars (HbA1c) saw the greatest improvements in diabetic control.
Type 2 diabetes (T2D) is a growing problem with an estimated worldwide prevalence of 9.3% (463 million people) for 2019.1 In the UK, the burden on the National Health Service (NHS) is illustrated by the growing cost of drugs prescribed for T2D; in 2018, these made up 11.4% of total primary care net costs and 4.9% of all prescription items.2 In the North of England, the Norwood general practice (GP) practice, which has been serving a stable population of approximately 9800 patients, experienced an eightfold increase in T2D cases recorded, rising from 57 in 1987 to 472 in 2019. This increase in prevalence translates into an increased morbidity and mortality for patients, as well as increasing pressure on limited healthcare resources.
Introduction
Several systematic reviews and meta-analyses of randomised control trials (RCTs) suggest beneficial effects of carbohydrate-restricted diets in T2D on glycaemic control, triglyceride and HDL cholesterol profiles.3–5 Between 2018 and 2020, consensus reports by the American Diabetes Association (ADA) and the European Association for the Study of Diabetes acknowledged low-carbohydrate diets as appropriate dietary options.6 In 2020, ADA standards of care for T2D report stated: ‘for individuals with type 2 diabetes not meeting glycaemic targets or for whom reducing glucose-lowering drugs is a priority, reducing overall carbohydrate intake with a low-carbohydrate or a very-low-carbohydrate eating pattern is a viable option’.7 However, there is still some debate about sustainability (particularly in terms of long-term adherence) and safety of lower carbohydrate diets. For example, an RCT comparing a low-carb diet to a low-fat diet in people with T2D8 found a similar 3.4% weight reduction in both dietary groups and no significant change in A1C in either group at 1 year. Also in 2018, the British Dietetics Association (BDA) stated: ‘more research is needed to ascertain the long-term health impacts of low-carbohydrate diets, including on heart health’.9 Beyond this uncertainty, little is known about the best methods of implementing advice on lower carbohydrate diets in primary care practice.
The UK National Institute for Health and Care Excellence T2D guidelines, although not currently advising a low-carbohydrate diet specifically, do advise low Glycaemic Index (GI) foods as part of the multicomponent management of T2D.10 Observations from an earlier service improvement pilot at the Norwood surgery suggested patients with T2D might achieve a clinically significant improvement in glycaemic control by restricting carbohydrate intake.11 In addition, dietary carbohydrate restriction may positively benefit other aspects of the metabolic syndrome, including central obesity, hypertriglyceridaemia and non-alcoholic fatty liver disease.12 13 Encouraged by the emerging body of evidence and patient demand for more effective lifestyle guidance in T2D, the Norwood surgery started routinely offering dietary advice on lower carbohydrate diets to all patients with T2D and prediabetes from March 2013 to date (September 2020).
The purpose of this secondary analysis of routine clinic data was to evaluate the effects of advising a lower carbohydrate diet for patients with T2D or prediabetes. Specifically, we hoped to answer the following question: for those patients choosing a lower carbohydrate diet to manage their T2D or prediabetes, when we compare ‘baseline data’ to ‘latest follow-up’ what are the outcomes in terms of body weight, glycaemic control and effect on diabetes medication prescribing (British National Formulary Chapter 6.1.2.)? Given the BDA concern over heart health, additional clinical variables were included relating to cardiac risk, namely lipid profile and blood pressure (BP). The Diabetes Remission Clinical Trial (DiRECT) 14 recently investigated a low-calorie diet to achieve weight loss and subsequent drug-free improvement in T2D, including T2D remission. Raising the possibility of T2D remission through dietary intervention has given hope to many people affected by T2D. Yet, the exclusion criteria for the DiRECT study included patients over 65 years old and patients who have had T2D for over 6 years (72 months). We, therefore, decided to include analysis of these specific subcohorts in our service evaluation.
Methods
Advice on lowering dietary carbohydrate was offered routinely by trained GPs and practice nurses to patients with T2D and prediabetes (defined as a haemoglobin A1c [HbA1c] from 42 to 48 mmol/mol) from March 2013 (online supplemental file 1. Low-carb protocol). The lower carbohydrate diet was introduced as an option alongside clear and simplified explanations of key physiological principles; including how glucose and insulin levels change in response to different foods; starchy carbohydrates comprise many glucose molecules; and the concept that foods can have either a low or high GI and glycaemic load (online supplemental file 2).
Supplemental material
For patients who opted to try a lower carbohydrate diet, dietary advice was given as part of routine GP or practice nurse consultations. The level of ongoing support was tailored to patient choice and clinical need. In addition to 10 min ‘one-to-one’ appointments (we estimate an average of 3 appointments per patient, per year were required), the practice offered access to optional 90 min evening group sessions that ran approximately once every 6 weeks. Group sessions included a psychologist who facilitated behaviour change by encouraging participants to consider their individual health goals, the resources available to them, setting realistic steps and enabling the individual to notice what works for them.15 Patient relatives and carers were encouraged to attend as some patients relied on others for food shopping or cooking. Group sessions also provided a forum for patients to offer practical support to their peers and for the training of new staff. On average, 25 patients attended each session.
Several educational resources were produced to support patients and staff. The lower carbohydrate diet sheet (figure 1) outlines low GI sources of food in the diet. Glycaemic load data, derived from the GI, were also presented to encourage a reduction in the intake of sugary and starchy foods, for example, sugary breakfast cereals, rice or potatoes, by replacing them with, for example, green leafy vegetables, full-fat dairy, eggs, meat, fish, berries and nuts, with sensitivity to each patient’s sociocultural dietary needs and preferences. A set of seven broadly indicative infographics were generated, for example, figure 2. These help people make wiser dietary choices by representing the glycaemic load of example food portions alongside an equivalent number of standard (4 g) teaspoons of table sugar.16 From 2018, staff training was formalised through completion of a Royal College of General Practitioners e-learning module on T2D and the GI, written by one of the authors.17

Norwood surgery lower carbohydrate diet sheet.GP, general practice.
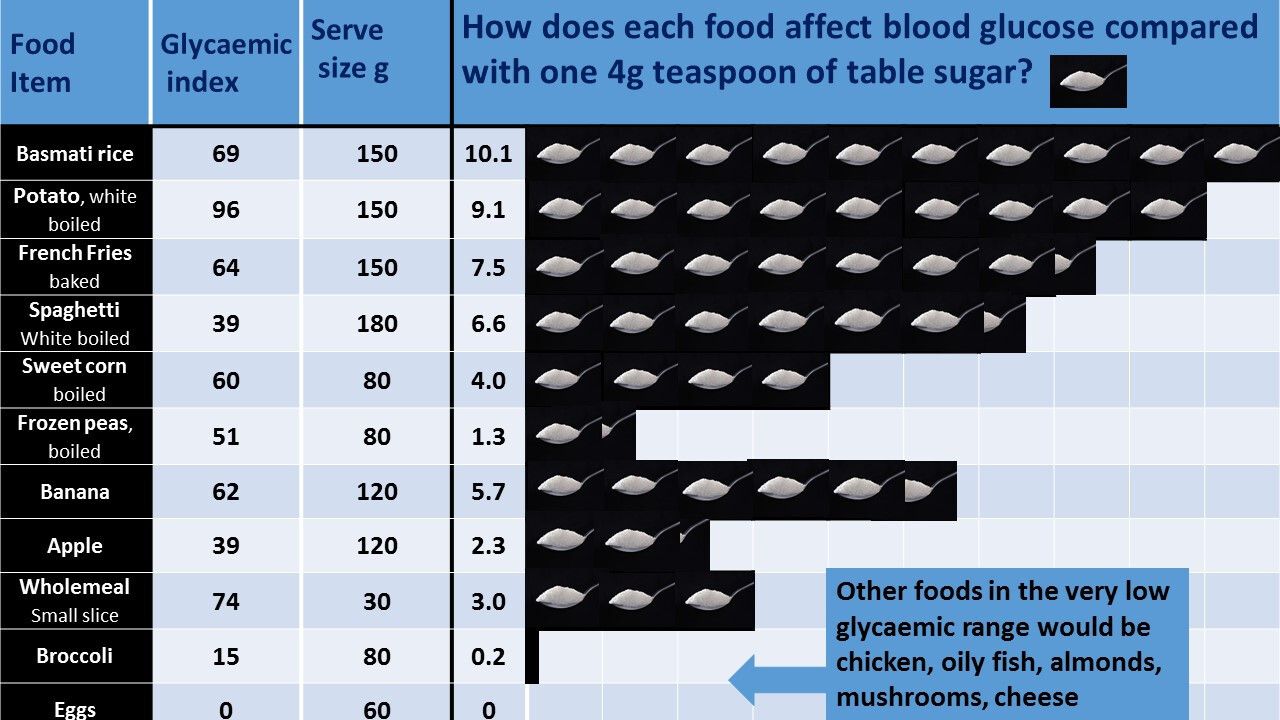
Norwood infographic as per it is the glycaemic response to, not the carbohydrate content of food that matters in diabetes and obesity: The Glycaemic Index revisited. Journal of Insulin Resistance 2016.
Our paper is part of an ongoing audit of service provision. Practice patients who have either T2D or prediabetes and choose the low-carb approach are coded within the practice computer system. The relevant records can then be easily retrieved and interrogated to produce the data which is presented as ‘baseline’ (that is before the code was put on) and ‘latest follow-up’ (self-explanatory). The metrics we measured (weight, BP, lipid profile, HbA1c) are part of the routine care for this group of patients at the Norwood GP practice. Exclusion criteria were severe mental illness, terminal illness and eating disorders. We also examined the effects of this intervention in those over 65 years and those with T2D for longer than 72 months. These groups were excluded from the DiRECT study.14
Routine clinical data were collected between March 2013 and March 2019. Baseline measurements of weight and BP were done at the surgery and blood tests (HbA1c, lipid profiles) by the local NHS phlebotomy clinic. The frequency of blood tests depended on clinical need and risk assessment as part of standard care. As some patients found it challenging to fit fasting blood tests into their lifestyle patterns, the results included a greater number of incomplete data sets for lipid profiles than other measures.
Statistical analyses were performed with R V.3.6.1. Summaries of baseline and follow-up data are shown as median and the IQR (25th percentile, 75th percentile) for non-normally distributed continuous variables (age, weight, HbA1c, lipid profile and BP) and more normally distributed continuous variables are presented as median (SD) (duration of diet). Comparisons between baseline and latest follow-up continuous variables were made using the Wilcoxon signed rank test for paired samples. A p value<0.05 was considered statistically significant.
Baseline and latest follow-up distributions of patient data are presented with box and whisker charts, the box represents the median value and the IQR, the red dot indicates the mean value and the upper and lower whiskers indicate either, the minimum/maximum value, or 1.5 times the IQR (outliers are not shown).
Data are presented for patients with T2D, and for two subgroups: for patients with T2D and aged 65+ years; and for patients with T2D having had this diagnosis for 72 months or longer at the start of the intervention (6 years). Data are presented for patients with prediabetes (HbA1c of 42–47 mmol/mol).
Linear regression models were fitted with HbA1c reduction as the outcome and weight loss, age, duration of T2D and baseline HbA1C as predictors. The NHS in England publishes monthly data about the drugs prescribed by every GP in the country. Data on items prescribed and costs are processed and organised by GP practice and British National Formulary (BNF) chapter by the OpenPrescribing website18 These data enable analysis comparing prescribing costs in one practice (Norwood) to local, regional and national averages. The site also generates graphs such as the figure discussed in the Results below.
Results
By the end of March 2019, there were 199 patients with T2D (N=128) or prediabetes (N=71) who had both persisted with the lower carbohydrate programme, and for whom service evaluation data had been collected. The number of routine (10 min) appointments patients attended varied depending partly on risk assessment and approximately half of the cohort attended the additional group sessions on one or more occasion. Table 1 shows statistical analysis of the cardiometabolic variables measured at baseline and the end of the service evaluation period.
Statistical analysis of cardiometabolic variables measured at baseline and at the end of service evaluation period
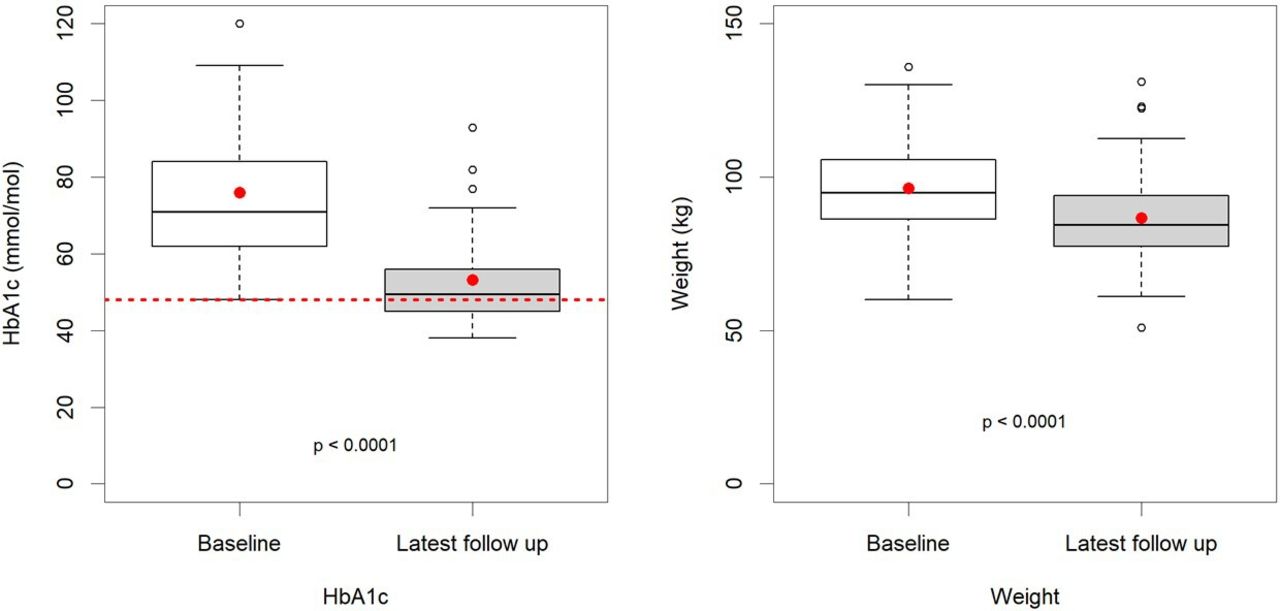
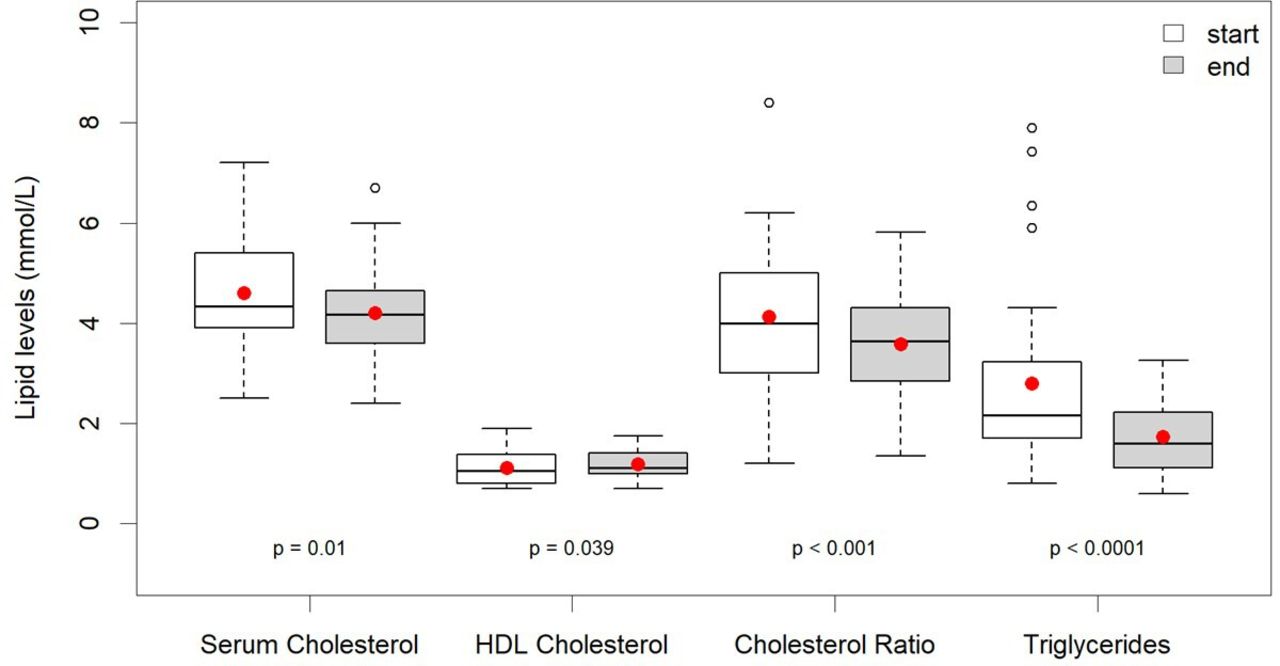
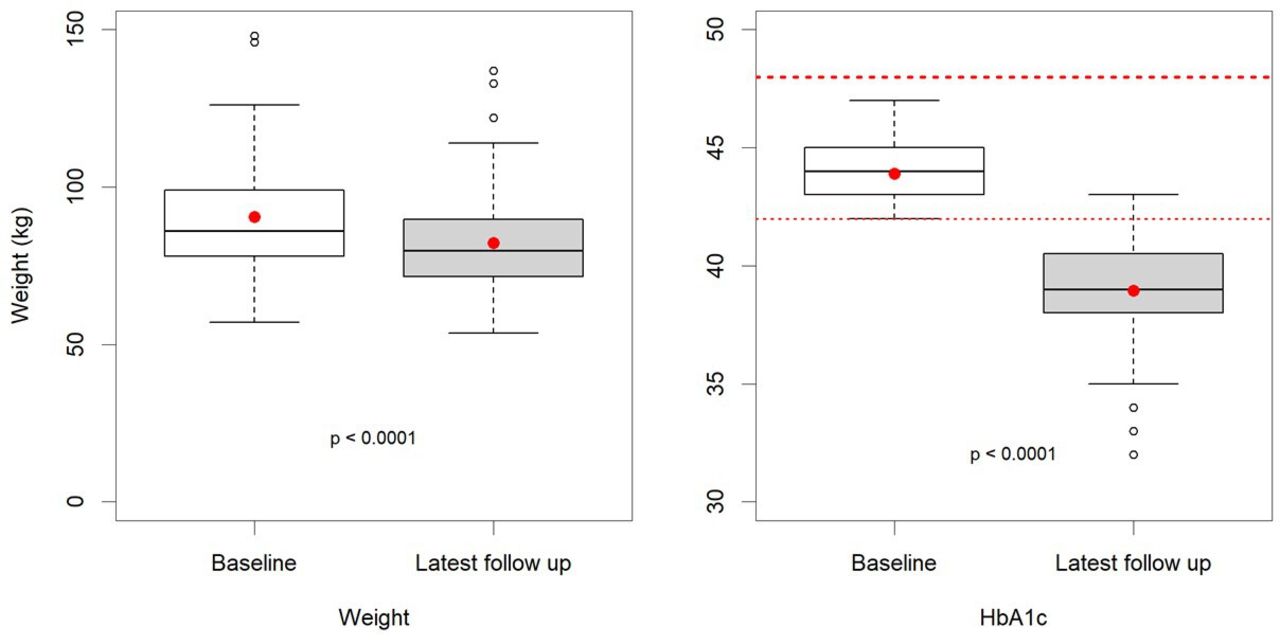
At the end of the evaluation period, the Norwood GP practice register for T2D had a total of 473 patients, this cohort of 128 represents 27%. Of these, 83 (63%) were male, and the mean age was 63 years. They were recorded as being on the lower carbohydrate programme for a mean (SD) duration of 23 (16.8) months. For those with T2D, there was a statistically significant reduction in all variables of interest other than a statistically significant increase in high density lipoprotein (HDL) cholesterol. The most prominent changes at the follow-up were a reduction in the observed weight from the median (IQR) of 99.7 (86.2, 109.3) kg to 91.4 (79, 101.1) kg, p<0.001, and for HbA1c from the median (IQR) of 65.5 (55, 82) mmol/mol to 48 (43, 55) mmol/mol, p<0.001 (table 1 and figure 3). Overall, 121 of the 128 patients (94.4%) lost weight. Seven patients either lost no weight or gained weight, yet these seven individuals had a mean improvement in HbA1c of 21.1 mmol/mol, similar to the average for the whole group. Regression analysis showed little overall relationship between the magnitude of weight loss (predictor) and improvement in HbA1c (outcome), R2=0.0058, p=0.402, β=0.234 mmol/mol/kg, (95% CI: −0.317 to 0.785) (online supplemental file 3). Table 1 and figure 4 demonstrate the significant reduction in total cholesterol, triglycerides and total/HDL cholesterol ratio and a significant increase in HDL cholesterol seen in patients with T2D. A median reduction in systolic and diastolic BP occurred of 11 and 5.1 mm Hg, respectively, p<0.001.

Type 2 diabetes box and whisker plots; baseline and latest follow-up haemoglobin A1c (HbA1c) and weight.

Box and whisker type 2 diabetes; baseline and latest follow-up lipid results.
Medication use: 40 of the T2D participants were newly diagnosed with diabetes and so not on any medications for T2D at baseline. There were a further 34 participants with more established diabetes managed by diet alone. Metformin was started in just four of these patients. The remaining 54 people were on medication for T2D at baseline. Twenty-nine medications were stopped in this group, sometimes more than one drug in any particular patient. As a result of this 19 of the 54 patients previously on medication became medication free, making a total of 89 people with T2D managed without medication at latest follow-up (table 2.) Of these, 59 were both free of medication and had an HbA1c<48 mmol/mol.
Breakdown of the number of people with T2D who were medication free at latest follow-up
Figure 5 demonstrates that the Norwood GP practice had the lowest prescribing costs for antidiabetic medications (BNF 6.1.2) in the local area. According to OpenPrescribing.net, by April 2020, Norwood spent £50 885 less per year than is average for the area. Further interrogation of this resource, looking at overall practice prescribing for T2D against regional and national figures, indicates a 35% increase in Norwood prescribing compared with a 53% rise in the local area for the 5 years from March 2015 (online supplemental file 4).
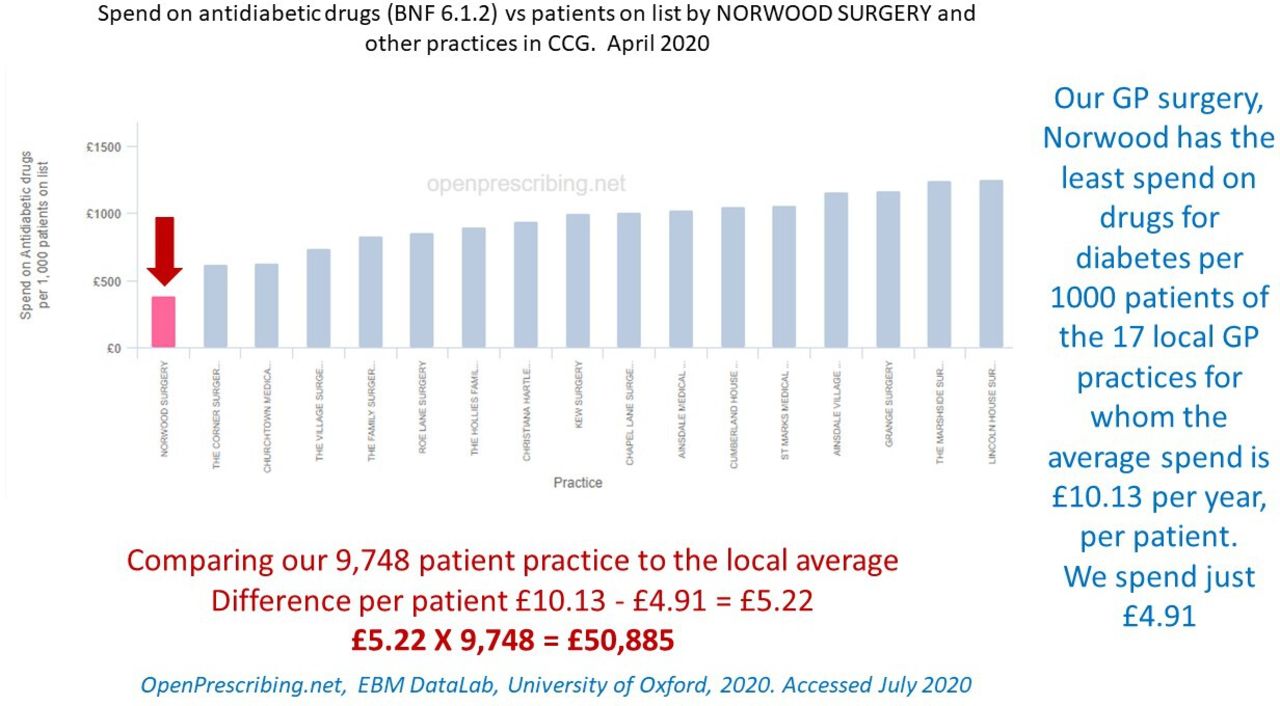
Data from: OpenPrescribing.net, EBM DataLab, University of Oxford, 2020, accessed July 2020. Prescribing of drugs for diabetes British National Formulary (BNF) 6.1.2 for all the general practice (GP) practices in Southport and Formby Clinical Commisioning Group (CCG).
Figure 6 shows regression analysis of the improvement in HbA1c with respect to baseline HbA1c on the programme for the entire T2D cohort. It shows a positive relationship (R2 0.752, p<0.001, β=0.806, 95% CI: 0.724 to 0.888) between higher initial HbA1c (worse diabetic control) and greater improvements in diabetic control on the programme. A subcohort of interest to clinicians is patients with poor glycaemic control. Of the 128 participants, 40 patients had a baseline HbA1c of 80 mmol/mol or greater (mean 97.3 mmol/mol). The average reduction in HbA1c for this subcohort was 41.9 mmol/mol, more than double the overall average improvement. The average HbA1c of this group at latest follow-up had improved to 55.4 mmol/mol. Regarding medications in this subcohort who started with very poor diabetic control; two patients were started on metformin, and the following medications were deprescribed in five patients; metformin in two, gliclazide in three, liraglutide in one and insulin in one.
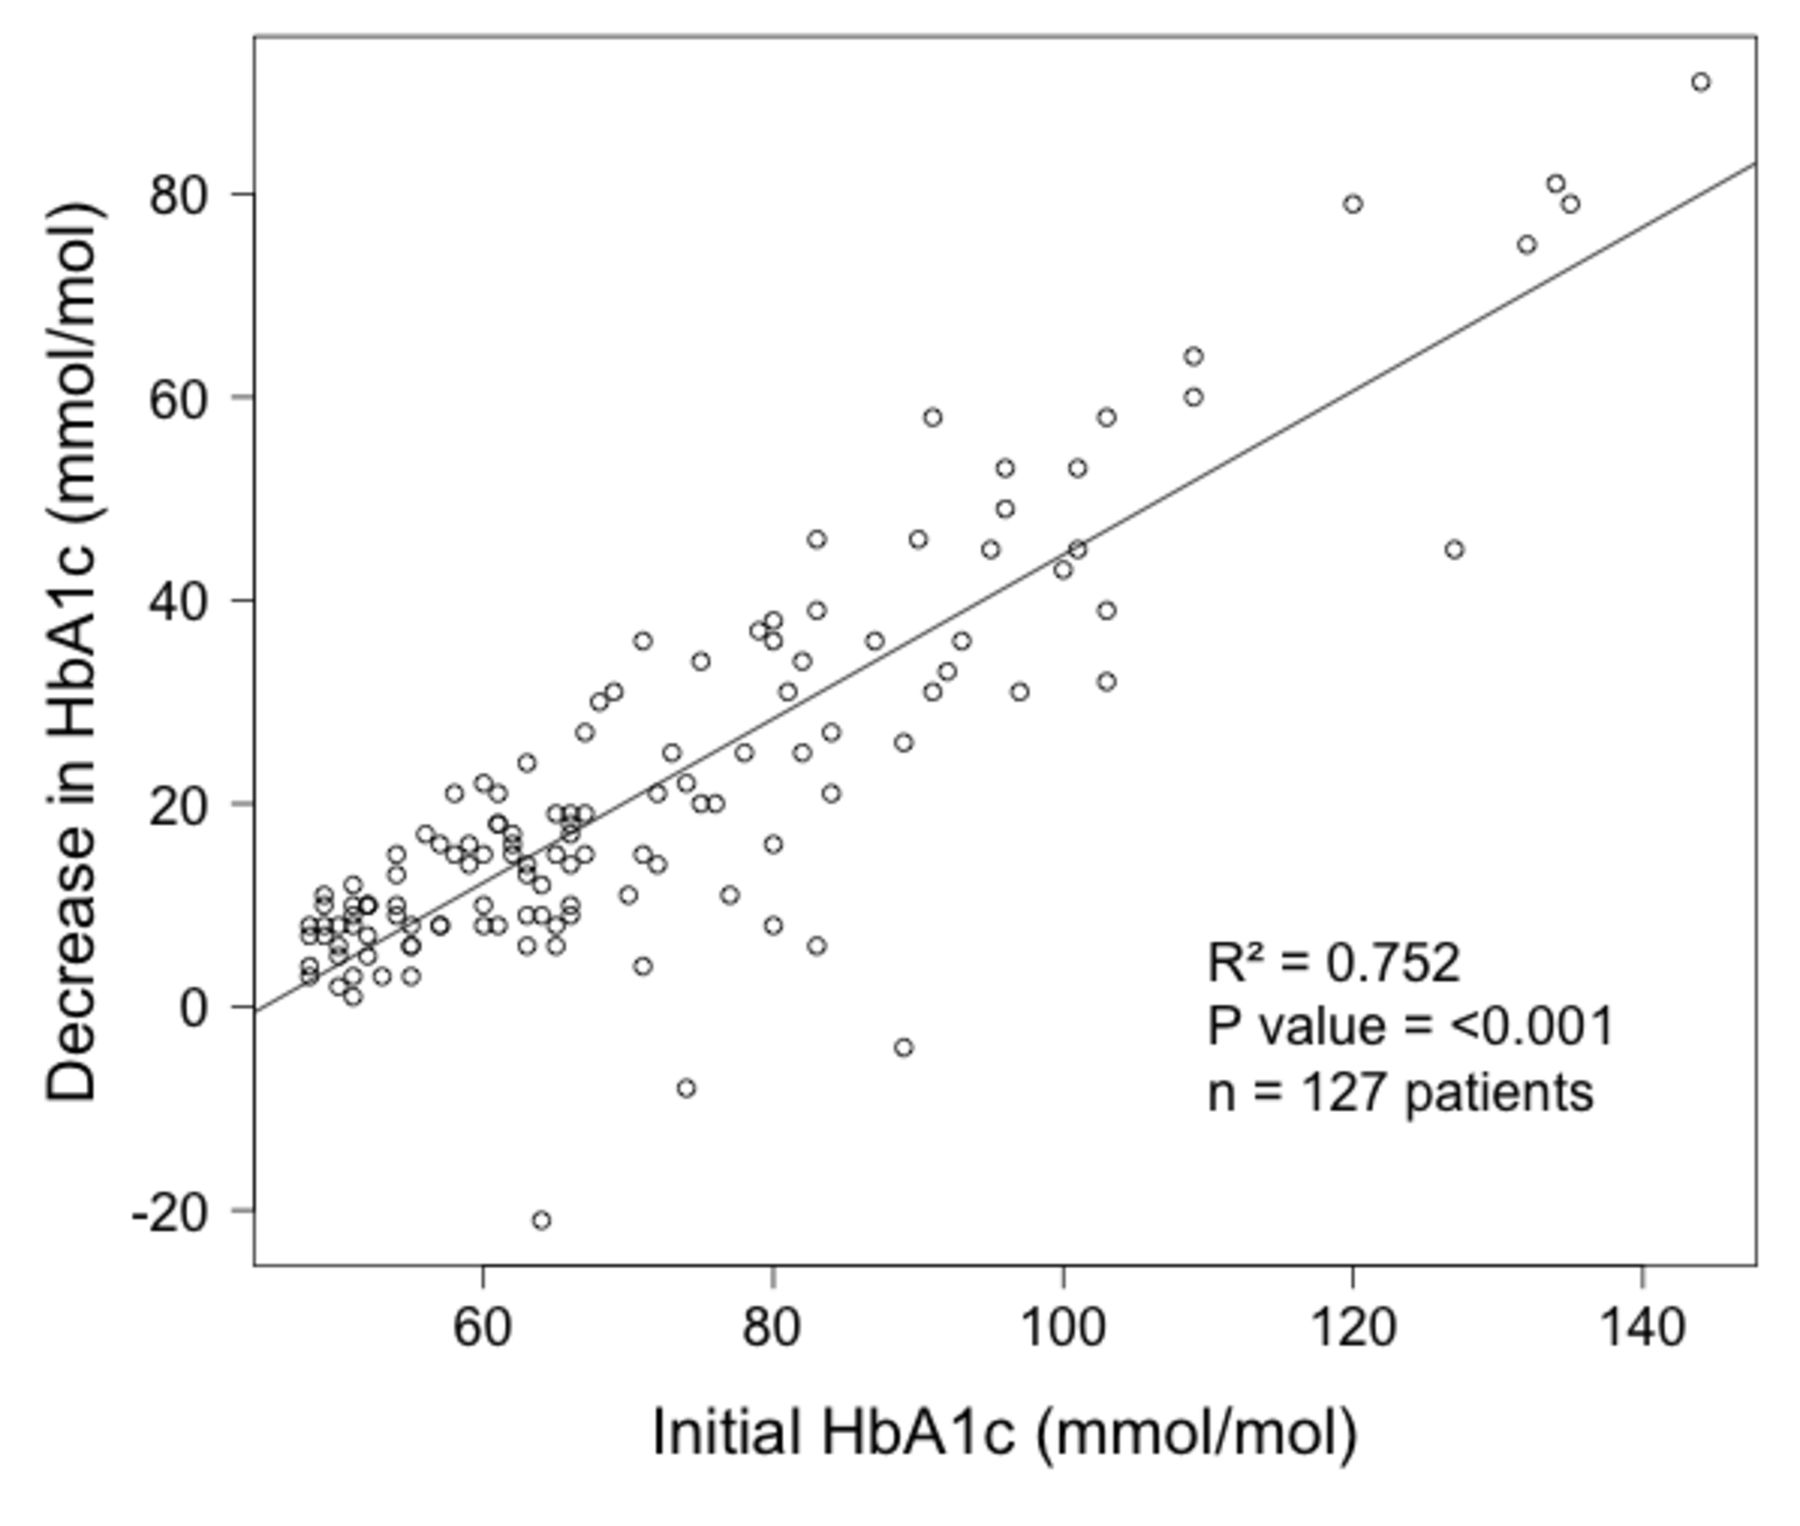
Initial HbA1c versus improvement in HbA1c for 127 patients with type 2 diabetes on a low-carb diet for an average of 23 months.
Analysis of the results from the two subcohorts of interest (time since diagnosis of diabetes and age) is shown separately in table 1. There was the same trend in cardiometabolic variables that occurred in the entire cohort. The results for these subcohorts are:
In the 45 patients with T2D for over 72 months at the introduction to this service, the median (IQR) weight reduced from 96.2 (86.2, 106.0) kg to 86.9 (76.9, 95.4) kg, p<0.001, and median (IQR) HbA1c reduced from 73 (62, 84) mmol/mol to 49 (45, 56) mmol/mol, p<0.001. Regression analysis showed little overall relationship between the duration of diabetes at initiation of the programme (predictor) and improvement in HbA1c (outcome) for the main T2D cohort (n=127), R2=0.007, p=0.348, β=0.025 mmol/mol/month (95% CI: −0.027 to 0.076) (online supplemental file 5).
Of the 53 patients over 65 years old with T2D at the introduction to this service, 11 were over 80 years old, and the average age was 75 years. Median (IQR) weight reduced from 91.8 (81.3, 100.8) kg at baseline to 83.3 (74, 91.8) kg, p<0.001, while median (IQR) HbA1c changed from 64 (56, 80) mmol/mol to 49 (45, 56) mmol/mol, p<0.001. Regression analysis showed little overall relationship between age at initiation of the programme (predictor) and improvement in HbA1c (outcome) for the main T2D cohort (n=127), R2=0.0019, p=0.626, β 0.068 mmol/mol/year (95% CI: −0209 to 0.346) (online supplemental file 6).
The 71 patients with prediabetes represent 11.1% of the 637 people on the practice prediabetes register, 35 (49%) were male, and the mean age was 65 (59,73) years. They were recorded as being on a lower carbohydrate diet for a mean (SD) duration of 22 (17.4) months. The most prominent changes were observed for median (IQR) weight, which reduced from 90.6 (78.0, 99.0) kg to 82.2 (71.8, 89.6) kg, p<0.001, and median (IQR) HbA1c, which reduced from 44 (43, 45) mmol/mol to 39 (38, 41) mmol/mol, p<0.001 (table 1 and figure 7). By the end of the service evaluation, 66 (93%) had a normal HbA1c (<42 mmol/mol). Statistically significant changes to lipid profiles and BP in patients with prediabetes followed the same pattern as described in patients with T2D.

Prediabetes box and whisker plots; baseline and latest follow-up HbA1c and weight.
Discussion
Analysis of our data shows significant improvements in all the metrics evaluated (HbA1c, weight, BP and lipid profiles) for the 27% of the practice T2D population who chose the approach. However, the methodological limitations of this service evaluation must be considered in the interpretation of these results. Our audit reports results from people who chose to take up this intervention and who persisted with it. It is a practice-based service evaluation not a prospective research study so lack of randomisation introduces the possibility of selection bias. The absence of a control group also means we cannot compare the dietary intervention directly with routine care. However, some idea of the results one might expect from routine care can be drawn from the control arm of the DiRECT study, discussed below.19 Lack of randomisation also risks confounding. For example, individuals who chose the diet may have other unique characteristics or behaviours that confer benefit. Co-intervention bias is another possibility, where for example other medications or exercise recommendations may have conferred benefit that were not included in the analysis. Despite this, the wide IQR of baseline HbA1c (55–82 mmol/mol) and an overall average of 65 mmol/mol (suggesting relatively poor glycaemic control) indicates that a ‘real-world’ cross section of patients was included. Another limitation is relying on the patients’ word regarding adherence to a lower carbohydrate diet; hence, we must acknowledge the risk of reporting bias. Although the average weight loss of 8.3 kg does suggest significant dietary change, we cannot know with any certainty what has actually happened to the balance of the different macronutrients in the diet of the participants. Another limitation concerns the teaspoon of sugar infographics used in figure 2, based on the glycaemic load. It is important to note that this infographic is indicative only and does not represent the true process of glucose metabolism.20
For several years, a ‘low-carbohydrate diet’ has generally been accepted to be one containing less than 130 g of carbohydrate per day.13 But in routine care, it may not be realistic for patients to count grams of carbohydrate on a regular basis. Our data suggest a more simple and practical approach to lowering dietary carbohydrate can be associated with significant improvements in HbA1c, weight, lipid profiles and BP without the need for precise daily carbohydrate or calorie counting. Patients appear to have benefited from having received clear and simplified explanations of how sugar and carbohydrates affect blood glucose levels and how to recognise foods with high glycaemic loads, as illustrated by infographics (figure 2), in addition to individualised follow-up and multidisciplinary group sessions. In clinical practice, avoiding in-depth discussions around portion sizes and carbohydrate counting has been patient friendly and time efficient.
Of all the patients with T2D at the Norwood GP practice, 27% adopted a lower carbohydrate diet during this service evaluation period. The approach was not adopted by all patients, which is a reminder of the importance of individual choice in diet and lifestyle matters. The same might also be said for healthcare professionals as the level of interest, commitment and confidence in this dietary approach to T2D varied between the 10 clinicians involved at the GP practice, especially at the beginning. Still, the number of patients adopting this dietary approach has continued to rise and, as of August 2020, the cohort includes 173 patients with T2D, representing 36% of the practice total.
In our practice, the idea of drug-free remission of T2D has inspired many patients and clinicians. However, at the time of writing there is no internationally agreed definition of T2D remission. The criteria used at Norwood and suggested by Taylor et al21 are a previous diagnosis of type 2 diabetes by WHO criteria and an HbA1c<6.5% (48 mmol/mol) without antidiabetic medication. Using this definition, the DiRECT study14 showed that an approach which includes a 12-week period of total diet replacement, with an 825–853 kcal/day formula diet, can lead to weight loss and drug-free T2D remission in a UK primary care setting. At 12 months, T2D remission was achieved in 68 of 149 participants giving a remission rate of 46%. When followed up further, at 24 months, the remission rate had dropped to 36%.19 At Norwood, 59 of 128 patients receiving lower carbohydrate dietary advice achieved drug-free T2D remission, giving a rate of 46% at 23 months duration of the approach. As a comparison to illustrate how rare remission is in usual care DiRECT quotes a remission rate at 24 months of just 2% for routine T2D care in the UK, emphasising the potential value in novel dietary approaches to this problem. The DiRECT study excluded patients who, at recruitment, had been diagnosed with T2D for longer than 72 months or were over 65 years old. In our practice, this would have excluded 45 and 53 patients, respectively. Of the over 65-year-old patients at Norwood, 11 were over 80 years, the oldest was 91 years old. The average improvement in HbA1c for this group was 15 mmol/mol. Similarly, in those patients with T2D for over 72 months, the average reduction in HbA1c was 24 mmol/mol, demonstrating a significant improvement. As shown in the results above our findings suggest both older people and those who had had diabetes for longer had good outcomes on a lower carbohydrate diet. Looking at the overall cohort with diabetes, we found very little relationship between duration of diabetes or age of participant at baseline and decrease in HbA1c (online supplemental files 5 and 6). It may be unfortunate to exclude these subgroups from similar avenues of research in the future.
Patients whose T2D is poorly controlled, for example, with HbA1c of 80 mmol/mol and more, may present the clinician with a dilemma as the risks might be considered so high that medication ought to be started or increased immediately. In this service evaluation, 40 patients presented with an HbA1c over 80 mmol/mol. Of those, the highest was 144 mmol/mol. These 40 patients ultimately achieved an average improvement in HbA1c of 41.9 mmol/mol, meaning the best results from this project were achieved in patients who presented with the worst glycaemic control. Figure 6 demonstrates graphically the clear positive relationship between a higher initial HbA1c and the degree of improvement in HbA1c that was observed on our programme. This suggests it may be a reasonable approach (particularly if the patient hopes to avoid medication) to offer a trial of advice on a lower carbohydrate diet with appropriate clinical monitoring to patients with particularly high HbA1c levels as an alternative to immediately starting medications. An important caveat is that closer monitoring of weight, blood glucose and HbA1c was needed. For this group we were encouraging self-testing for blood glucose, reweighing every 2 weeks and repeating blood tests in 6 weeks.
Weight loss has been assumed to be a key determinant of the reduction in HbA1c in T2D population. Surprisingly in this service evaluation, there was a weak and statistically non-significant relationship between weight loss and HbA1C reduction as shown by regression analysis (online supplemental file 3.) Small numbers of those whose weight remained stable or whose weight increased over time also achieved a reduction in HbA1C. It is possible that other mechanisms beyond weight loss and associated improvement in insulin sensitivity mediate the effects of lower carbohydrate diet on glycaemic control. For example, in bariatric surgery, significant improvements are often seen in the first week after surgery, before substantial weight loss has occurred.22
We saw two particular cases where patients had significant weight loss that was not matched by improvements in HbA1c. In one case, the patient had, in fact, developed type 1 diabetes and needed insulin. Further investigation into the other case led to the diagnosis of a hidden malignancy. Another pattern is where both weight and HbA1c rose together, on direct questioning this typically represented higher GI carbohydrate foods ‘creeping’ back into the diet. This prompted the clinician to support the patient back to a lower carbohydrate diet. Our impression is that group sessions were particularly helpful in this scenario as participants did not require an appointment so could access support easily and out of working hours. Quality long-term support is vital to achieving sustained benefits from any approach to managing people with T2D, a point reinforced by the decline in T2D remission rate seen in the DiRECT study follow-up over time.19 A recent, randomised controlled feasibility study demonstrated it is practical for practice nurses to provide follow-up support as part a low-carbohydrate dietary intervention for patients with T2D in a UK primary care setting.23
The lower carbohydrate diet option also appeared to be both an acceptable and effective intervention to the 71 participants with prediabetes (HbA1c from 42 to 48 mmol/mol). After an average duration of 22 months, only five still had an HbA1c of 42 mmol/mol or above. This ‘prediabetes remission rate’ of 93% may provide a further message of hope. In clinical practice, it is encouraging for patients to hear that nearly all who choose a lower carbohydrate diet may see their prediabetes resolve alongside additional improvements in weight, BP and lipid profiles. One notable example of an additional benefit is the improvements seen in serum triglycerides of about 30% (table 1 and figure 4). It is currently challenging for a clinician to know what to suggest when faced with a patient with high triglycerides and obesity. A lower carbohydrate diet may well have a role in this group too and should prompt further research.
In discussions around low-carbohydrate diets, the potential replacement of dietary carbohydrate for fat was a cause for concern around any impact on cardiovascular outcomes. In general, with respect to lipid profiles our findings support the meta-analysis by Gjuladin-Hellon et al4 who concluded ‘large randomised controlled trials of at least 6 months duration with carbohydrate restriction appear superior in improving lipid markers when compared with low-fat diets’. Given the improved average HbA1c, lipid profiles, weight and BP, we are optimistic of improved cardiovascular risk for our cohort.
For clinicians considering advising a lower carbohydrate diet for patients who are already on antidiabetic medications, there are three important considerations:
Whether the drug/diet combination poses a risk of hypoglycaemia. Insulin is an obvious culprit for this as are some oral agents such as gliclazide. Careful measurement of blood glucose, dose reduction and/or cessation of culprit drugs is crucial to patient safety.
Sodium-glucose co-transporter-2 (SGLT2) inhibitor drugs, combined with a low-carbohydrate diet, have the potential to lead to diabetic ketoacidosis that may be masked by relative normoglycaemia. This class of drugs ought to be avoided in this context.
As demonstrated in our service evaluation data and elsewhere,24 lowering carbohydrate in the diet is associated with a lowering of BP. For patients already on antihypertensive medication, this can lead to symptomatic hypotension requiring dose reduction and/or cessation of culprit drugs.
Prescribing T2D medication in the context of a carbohydrate-restricted diet was the subject of a useful British Journal of General Practice review25 that states the diet is safe with metformin, the most commonly prescribed antidiabetic medication. In addition to deprescribing antidiabetic medications analysis from the Norwood GP practice on hypertension, published separately,24 shows that 20% of the antihypertensive drugs were also stopped due to significant improvements in BP.
Finally, over the last 5 years, there has been a relative reduction in antidiabetic medications prescribed by Norwood against local, regional and national figures (see OpenPrescribing data in online supplemental file 1). We cannot prove this low-carb approach is the cause of this reduction but believe factors involved are; deprescribing in patients with T2D and a reduction in the need to prescribe new antidiabetic drugs for patients with improved glycaemic control on a lower carbohydrate diet. Also, given the option, no patient with T2D chose to start medication before first trying the lower carbohydrate diet. Indeed, only four T2D patients were started on antidiabetic medications during the period and only after diet and lifestyle measures had been tried without success. Importantly between 2013 and 2019, none of the cohort with prediabetes developed T2D or needed drugs for diabetes.
Nationally, prescribing rates for T2D are a huge strain on the NHS budget. In the financial year 2017/2018, there were 53.4 million items prescribed for diabetes at a total net ingredient cost of £1012.4 million,2 up by £421.7 million since 2007/2008. As outlined in the results above, compared with the 17 GP practices in the Southport and Formby region, the Norwood GP practice spend on antidiabetic medication is £50 885 per year less than the average for the area (figure 5). It is likely that the reduction in antihypertensive drugs will add to the savings which are welcome, considering the extra costs of this service were approximately £9000 per year.16
Conclusion
This service evaluation found that advising a lower carbohydrate diet approach for patients with T2D and prediabetes can be effectively incorporated into routine primary care over a prolonged period (6 years). The basic model centred on the assumption that, for these individuals, glycaemic control (as measured by HbA1c) is most influenced by the consumption of food with higher GI and glycaemic loads, such as those containing simple sugars and starchy carbohydrates. Advice was given to lower the amount of these food supported by illustrative infographics. Follow-up largely consisted of regular 10 min appointments with optional group sessions. The role of group sessions was to reinforce diet and lifestyle change, particularly to help ‘rescue’ patients who were struggling to maintain dietary changes. Significant improvements were observed across all cardiometabolic parameters measured: weight, HbA1c, lipid profile and BP with drug-free T2D remission in 46% of all patients with T2D. Of the prediabetic patients, 93% attained a normal HbA1c and similar improvements in cardiometabolic markers as seen in the diabetic cohort. Additional benefits included deprescribing of antidiabetic medications and significant prescribing budget savings.
Due to the practice-specific nature of this evaluation, there is limited external validity. Still, these results could form the basis for similar service improvement projects in primary care. Similar pilots could be designed to test the validity and cost-savings of this approach. At the very least, for patients, clinicians and others affected by T2D and prediabetes, the results might provide hope of better health outcomes in the future. These results highlight a need for more empirical research on the effects of lower carbohydrate diets and long-term glycaemic control while recording collateral impacts to other metabolic health outcomes.
Acknowledgments
The authors would like thank the patients, staff and partners at the Norwood Surgery in Southport. Particular thanks go to Dr Simon Tobin senior partner and diabetic lead for the practice for his enthusiastic support of the approach. Special thanks to Dr Kati Scholtz for pointing out the glycaemic load needed reframing to be better used by patients. We are grateful to Mr W Dale for accessing the OpenPrescribing data that appears in the supplemental file.
References
Supplementary materials
Supplementary Data
This web only file has been produced by the BMJ Publishing Group from an electronic file supplied by the author(s) and has not been edited for content.
Supplementary Data
This web only file has been produced by the BMJ Publishing Group from an electronic file supplied by the author(s) and has not been edited for content.
Supplementary Data
This web only file has been produced by the BMJ Publishing Group from an electronic file supplied by the author(s) and has not been edited for content.
Supplementary Data
This web only file has been produced by the BMJ Publishing Group from an electronic file supplied by the author(s) and has not been edited for content.
Footnotes
DU and AAK are joint first authors.
Twitter @lowcarbGP
Contributors DU initiated the approach in the practice, designed the infographics and wrote the initial drafts. JU organised and ran the group consultations, also training all clinical staff in using patients’ own goals and feedback to implement change. AAK did the initial statistics and helped with the later drafts of the paper. DC did a rewrite of the paper in its later stages. CD finished the statistics, produced the table, the box and whisker plots and linear regression models. RG wrote up the results and gave a lot of help to the entire manuscript. KM corrected several drafts and improved the style of the paper. SR found authors, chaired numerous meetings to agree on scope, influenced the style and edited across the manuscript in multiple rounds. RG and SR are joint supervising authors.
Funding Apart from an initial £7000 grant from Southport and Formby Clinical Commissioning Group (CCG), all the work has been funded by the partners at the Norwood Surgery.
Competing interests SR is co-chair of the Management Board of BMJ Nutrition, Prevention and Health, which is co-owned by the NNEdPro Global Centre for Nutrition and Health of which SR is both chair and executive director.
Patient consent for publication Not required.
Provenance and peer review Not commissioned; externally peer reviewed.
Data availability statement Data may be obtained from a third party and are not publicly available. The anonymised (deidentified participant data) is on an Excel spread sheet held by the lead author DU on behalf of the Norwood GP Practice.
Supplemental material This content has been supplied by the author(s). It has not been vetted by BMJ Publishing Group Limited (BMJ) and may not have been peer-reviewed. Any opinions or recommendations discussed are solely those of the author(s) and are not endorsed by BMJ. BMJ disclaims all liability and responsibility arising from any reliance placed on the content. Where the content includes any translated material, BMJ does not warrant the accuracy and reliability of the translations (including but not limited to local regulations, clinical guidelines, terminology, drug names and drug dosages), and is not responsible for any error and/or omissions arising from translation and adaptation or otherwise.