Article Text

Abstract
Background The association between dietary carbohydrate consumption and blood pressure (BP) is controversial. The present study aimed to evaluate the possible gender-specific association of carbohydrate across the whole BP distribution.
Method Cross-sectional survey including 2241 rural adults was conducted in northwestern China in 2010. BP was measured by trained medical personnel. Dietary information was collected by semiquantitative Food-Frequency Questionnaire. Multivariate quantile regression model was used to estimate the association between total carbohydrates consumption and systolic BP (SBP) and diastolic BP (DBP) at different quantiles. Gender-specific β coefficient and its 95% CI was calculated.
Results The average carbohydrate intake was 267.4 (SD 112.0) g/day in males and 204.9 (SD 90.7) g/day in females, with only 10.6% of males and 6.5% females consumed at least 65% of total energy from carbohydrates. And more than 80% carbohydrates were derived from refined grains. In females, increased total carbohydrates intake was associated with adverse SBP and DBP. An additional 50 g carbohydrates per day was positively associated with SBP at low and high quantiles (10th–20th and 60th–80th) and with DBP almost across whole distribution (30th–90th), after adjusting for age, fortune index, family history of hypertension, body mass index, physical activity level, alcohol intake and smoke, energy, two nutrient principal components, protein and sodium intake. Both relatively low and high carbohydrate intake were associated with increased SBP, with minimum level observed at 130–150 g carbohydrate intake per day from restricted cubic splines. However, no significant associations were observed in males.
Conclusions Higher total carbohydrates consumption might have an adverse impact on both SBP and DBP in Chinese females but not males. Additionally, the positive association varies across distribution of BP quantiles. Further research is warranted to validate these findings and clarify the causality.
- blood pressure lowering
- nutrition assessment
This is an open access article distributed in accordance with the Creative Commons Attribution Non Commercial (CC BY-NC 4.0) license, which permits others to distribute, remix, adapt, build upon this work non-commercially, and license their derivative works on different terms, provided the original work is properly cited, appropriate credit is given, any changes made indicated, and the use is non-commercial. See: http://creativecommons.org/licenses/by-nc/4.0/.
Statistics from Altmetric.com
What this paper adds
Dietary factors modification is regarded as one of most effective approaches to prevent elevated BP. However, the health effect of carbohydrates consumption are still unknown, as this might depend on their sources and quantity for a given population. Yet, most previous studies assumed SBP or DBP as normal distribution, although a skewed and gender-specific distribution was observed among large-scale population.
This study suggests that total carbohydrate consumption is associated with increased SBP and DBP in Chinese females who derive majority of carbohydrate from refined grains. And the detrimental effect might be more serious at upper quintiles of BP than other quantiles. Additionally, relatively lower and higher carbohydrate consumption is associated with higher SBP, with the minimum SBP level observed at 130~150g carbohydrate per day.
Introduction
Elevated blood pressure (BP) is one of the leading cardiovascular risk factors for overall mortality and disability.1 2 In the Global Burden of Disease study 2015, systolic BP (SBP) of at least 110–115 mm Hg was estimated to result in more than 10 million deaths and 212 million disability-adjusted life years.3 In China, the hypertension prevalence almost sextupled from 5.1% in 1959 to 29.6% in 2014,4 and might continue to increase in the next decade.5 Given the severity of adverse health outcome and high prevalence, even small improvement in the prevention would generate great benefit.
Dietary modification is regarded as one of most effective approaches to prevent elevated BP and cardiovascular disease, and there is ongoing scientific interest relating to the health effect of carbohydrate intake.6–9 Carbohydrates are a major source of energy and include a range of compounds all containing carbon, hydrogen and oxygen.10 Evidence from both randomised trials and prospective cohort studies indicated that total carbohydrates intake was independently associated with BP or cardiovascular disease risk factors, although the finding is confusing.11–13 Results from network meta-analysis of randomised trials suggested an association between low carbohydrate diet and reduction in SBP and diastolic BP (DBP), compared with usual diet among adults who were overweight or obese; 11 12however, the effects on improvement of BP and other cardiovascular risk factors for long-term period are unknown. Several large-scale prospective cohort studies in Europe and America showed low total carbohydrates intake was associated with increased mortality.13–15 While beneficial health effects was reported for low total carbohydrate intake in low-income and middle-income countries with a relatively high carbohydrate diet (especially from refined sources).8 16 Yet, it was noteworthy that most studies reported health outcome based on quantiles of carbohydrate consumption or percentage of total energy intake that was specific to the population involved.13 It meant that the health effects of carbohydrates intake might depend on their sources for a given population. Furthermore, little is known about gender disparities on carbohydrates intake and the effect on the association with health outcomes in middle-income and low-income countries, especially those undergoing shift in nutrition transition.17–19 This might be particularly true for Chinese adults, who has witnessed rapid nutrition transition and suffered from a double burden of the simultaneous manifestation of both micronutrients deficiency and overweight/obesity issues.18 20 Notably, the nutrient deficiency and diet quality might be much worse in women than men in China.21 22 In addition, most previous studies assumed SBP or DBP as normal distribution, although a skewed and gender-specific distribution was observed among national-level, large-scale population.23 And the effect of dietary factors might reasonably be hypothesised to vary across the SBP and DBP distribution.23
Therefore, this study was conducted to assess how the whole continuum SBP and DBP was associated with dietary overall carbohydrates intake in grams using quantile regression (QR) model. We also investigated effect modification by gender and allowed for the possibility of non-linear relationships.
Methods
Study setting
Hanzhong located in Shaanxi province of western China was the first region in China to begin BP monitoring and to promote the prevention and control of hypertension.24 Most of the monitoring activities and researches have been conducted in the Hantai district of Hanzhong, where covered nine rural townships. The local diet was characterised with relatively low energy and protein intake, shared similar trend to other rural areas in China.22
The data for current analysis were derived from the cross-sectional health survey conducted in Hanzhong in 2010. The health project was designed to assess the association between lifestyle factors and several chronic disease and health outcomes. Participants were interviewed personally by trained professional interviewers for baseline information including demographic characteristics, history of disease, lifestyle and diet. All participants provided informed written consent prior to participation.
Study population
The participants were limited to rural residents who aged 18-80y had living at the study sites for at least 1 year prior to the survey.25 Sample size calculation was based on hypertension prevalence reported in the Chinese National Nutrition and Health Survey (18.6%), given α of 0.05, an error of 15% and 20% of no-response rate due to our investigation with semiquantitative Food-Frequency Questionnaire (FFQ). A stratified randomised cluster sampling method was used to obtain sample. The detailed design and methods of this study has been reported elsewhere.20 24
Initially, 3021 participants were investigated. To minimise reverse causality (disease leading to diet change), we excluded participants who had a history of stroke (n=211), diabetes (n=127), hyperlipidemia (n=333) or taking antihypertensive medication (n=328).We further excluded those with missing data on BP (n=20) or FFQs (n=84) and reported implausible total energy intake (beyond 3 SD from log-transformed mean caloric intake) (n=24). Finally, 2241 participants (774 males and 1467 females) were included.
Dietary assessment
Diet information was collected by well-trained interviewers using a semiquantitative FFQ with 81 food items.20 24 The FFQ was established based a validated FFQ used for reproductive-aged women in rural western China.26 The validity and reproducibility of this questionnaire have been evaluated and discussed elsewhere.24 Participants were asked to report frequency and quantity of foods consumption over the past 12 months. Nine categories ranged from ‘never’ to ‘more than 4 times per day’ were possible. For each food item, a common used portion size was specified with the images of portion.27 And general questions about their diet were asked, which elicited specific foods consumed in an open-ended fashion.28 Frequency of food intake was translated into times per day by dividing average reported frequency by total days, for example, 1 time per week=1 time divided by 7 days=0.143 times per day, and 1-3 times per month=2/30=0.067.29 The mean intake was obtained by multiplying the mean grams with mean frequency of each food. Daily energy (kcal) and nutrients intake were calculated according to the Chinese Food Composition Table. Absolute nutrients intake was adjusted for total energy intake to 1700 kcal/day for females and 2100 kcal/day for males using the residual method.30 The acceptable macronutrient distribution ranges for Chinese adults was 50%–65% of total energy (%E) derived from carbohydrate.31
BP ascertainment
BP was measured on the right arm of participants at 1 min interval after a 5 min rest by professional staff the People Hospital of Hanzhong with a mercury sphygmomanometer (GB 3053–82). SBP and DBP were recorded as phase I and V Korotkoff sounds. The mean of two measurements was used for analysis.
Hypertension was defined according to the traditional cut-off values of SBP ≥140 mm Hg, DBP ≥90 mm Hg or both, or the use of antihypertensive medications.1
Assessment of covariates
Evidence from large-scale epidemiological studies indicated better nutrition status might be associated with higher socioeconomic position, healthier lifestyle factors and there might be multicollinearity cross-different nutrients.32 According to these findings and a priori knowledge about our data,20 24 a set of covariates were ascertained including demographics variables (age, education, fortune index and family history of hypertension), lifestyle factors (drinking, smoking and physical activity) and dietary information (energy, protein and sodium intake, nutrients principal components).
General information was collected using a face-to-face interview by a standard questionnaire. Fortune index was evaluated by principal component analysis, based on occupation, transportation and communication tools, type of house, monthly household income and expense.33 34 The first principal component accounting for 69.35% of total variance, was extracted as an indicator of individual comprehensive economic status. Fortune index in this study was divided into three groups according to tertiles to represent the poor, moderate and rich status.24 34
We used principal component analysis to reduce the possible multicollinearity among nutrients in regression models.35 36 The first two nutrients principal components were derived and explained 70.0% of total variance. The first component named ’fat’ exhibited the factor loading of above 0.6 on saturated fat, polyunsaturated fat, monounsaturated fat and cholesterol. Meanwhile the factor loading on potassium, fibre and magnesium was more than 0.83 in the ‘mineral’ component.24 Because correlations of total protein and sodium intake with the two principal components were less than 0.2, we assigned the two nutrition principal components, protein and sodium as potential dietary confounders in analysis. Education was categorised as primary school (school years≤6 years), secondary school (6–9 years) and senior school or higher education (≥9 years). We assessed physical activity using a lifestyle questionnaire which included information about 12 activities.20 33 Intensity score was assessed by metabolic equivalent score specific to different activities multiply duration and frequency of the activity converted to per week unit.37 And then the scores were summed over all activities to compute a value of total weekly hours. This continuous score was into three groups (low, moderate and high intensity) according to tertiles. Participants who smoked at least one cigarette per day for more than 6 months continuously or cumulatively and did not quit smoking were defined as current smokers.25 Abstainers were defined as those who reported never smoked or smoked fewer than 6 months in their lifetime. Former smokers included those who smoked more than 6 months in their lifetime, but were not smoking at time of interview.25 Individuals were asked about alcohol consumption (including grape wine, rice wine, beer and liquor) within the last year. Those who reported never drinking any alcoholic beverage in the past year were defined as non-drinkers. Participants who consumed at least one type of alcohol per month were defined as drinkers and former were defined as all others.38
Statistical analysis
All analyses were performed separately for men and women. We summarised quantitative variables by mean and SD or median and IQR and categorical measurement by percentage (%). In univariate analysis, Kruskal-Wallis or one-way analysis of variance was used to compare group difference for continuous variables and χ2 test was for categorical variables. The QR models were used to estimate the conditional quantile of the distribution of SBP and DBP under the influence of total carbohydrate intake. This method was more applicable when the effect of covariate might vary at different quantile level of outcome variable. Moreover, this technique could handle the skewed distribution of the response variables and provide more comprehensive results, compared with traditional linear regression models.23 39 The quantile-specific coefficient in QR models indicated how the outcome variables at the specified quantile varied with 1 unit change of the independent variable, with other variables remained unchanged.23 40 The change estimate (β coefficient) and its 95% CI at each quintile were estimated to evaluate the effect of 50 g (approximately one SD) increment of carbohydrate intake. For comparison, we also ran the ordinary least squared (OLS) model to estimate the mean regression to compare predictors of the mean SBP and DBP. A sequential covariate-adjusted strategy was used in the analysis. Model 1 adjusted for energy. Model 2 adjusted for variables in model 1 plus age, education, fortune index and family history of hypertension. Model 3 adjusted for variables in model 2 plus body mass index, physical activity level, alcohol intake and smoke. Model 4 adjusted for variables in model 3 plus two nutrient principal components, protein and sodium intake. To examine the robustness of the findings, sensitivity analysis was conducted with repeating regression model (1) replacing exact carbohydrate consumption with %E, (2) including all individuals even those with diet-related chronic disease but merely excluding those with implausible or miss data (N=2893). Finally, we used restricted cubic splines with three knots to express the potentially non-linear association between total carbohydrate intake and SBP and DBP. Statistical analysis system V.9.1 (SAS Institute) was used. Statistical significance was assigned as two-tailed p<0.05.
Results
A total of 228 (29.5%) men and 364 (24.8%) women were newly diagnosed with hypertension. The mean SBP was 126 (IQR 117–140) mm Hg in men, significantly higher than that in women (124 (IQR 113–138) mm Hg, p=0.002). Men also suffered higher DBP than women (79 vs 76 mm Hg, p<0.002). The main baseline information of 2241 participants by gender is shown in online supplemental table 1. In current study, men were elder more likely to be smoker and drinker than women (p<0.001). Additionally, males consumed significantly higher food and nutrients intake than females (p<0.01).
Supplemental material
The average carbohydrate intake was 267.4±112.0 g/day in males and 204.9±90.7 g/day in females. The average %E from carbohydrate was 49.6 (IQR 41.8%–57.7%) and 47.9 (IQR 40.4%–56.1%), respectively. Totally more than half of individuals consumed carbohydrate less than current dietary guideline for Chinese adults, and only 10.6% of males and 6.5% females consumed at least 65% E from carbohydrate. And more than 80% carbohydrates were derived from refined grains (such as white rice and white bread). Females consumed a higher portion from refined grains than males (87.5% vs 78.0%).
Table 1 shows the main characteristics and nutrients intake of participants according to carbohydrate consumption. Higher carbohydrate consumers tended to be elder, less educated and less physically active. Notably, carbohydrate intake was positively associated with protein, potassium and fibre intake, while inversely associated with sodium, fat and calcium intake.
Baseline characteristics and mean caloric-adjusted nutrient intakes by quartiles of carbohydrate intake*
Table 2 presents the associations between total carbohydrate intake and different quintiles of SBP by gender. Strong positive relationships were observed between carbohydrate intake and SBP in OLS model 1, regardless of gender. However, the association weakened to insignificance after further adjustment of age, education, fortune index and family history of hypertension in males (model 2). In female participants, per 50 g increment of carbohydrate was significantly associated with higher SBP at bottom and upper quintile, whereas, no significant effect on SBP between 30th and 50th percentiles, after controlling for demographic, lifestyle and dietary factors.
Estimated mean differences in SBP (mm Hg) with 50 g increment of carbohydrate intake using QR models across SBP distribution*†
Table 3 shows the QR coefficients and 95%CIs of total carbohydrate intake for DBP by gender. The results indicated important differences between the two genders. In males, no significant association was observed between total carbohydrate intake and DBP in both OLS and QR models. In females, the positive association was stronger at upper quintiles, but attenuated to insignificance toward the bottom DBP percentiles. For example, a 50 g increase of carbohydrate intake was associated with a 0.67 (95% CI 0.07 to 1.29), 1.50 (95% CI 0.41 to 2.60) and 1.59 (95% CI 0.61 to 2.58) mm Hg increase in DBP at 30th, 70th and 80th percentile.
Estimated mean differences in DBP (mm Hg) with 50 g increment of carbohydrate intake using QR models across DBP distribution*†
Figure 1 presents the multivariable restricted splines results for overall carbohydrate consumption and DBP and SBP. In females, higher SBP was observed in participants with lowest and highest carbohydrate consumption in adjusted models, and resulting a U-shape association with the lowest SBP and fewest hypertension patients observed at 130–150 g carbohydrate intake. No significant non-linear association was detected for DBP (p>0.05). In males, linear positive associations were detected between carbohydrate intake and SBP and DBP, although the relationship was not significant.
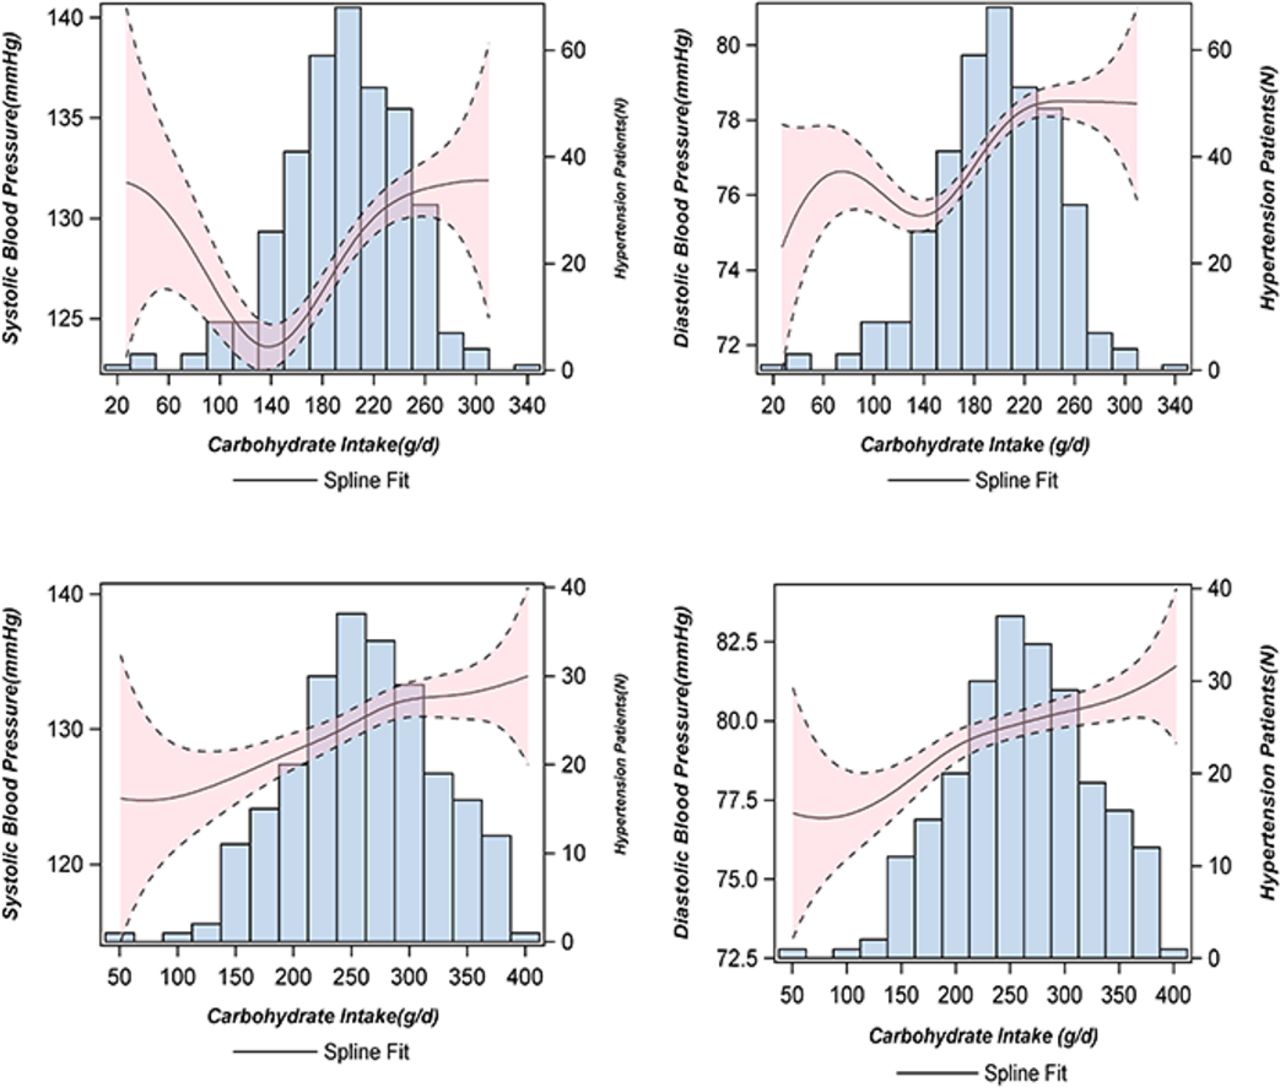
Adjusted dose–response association between energy-adjusted carbohydrate intake and SBP and DBP. Adjusted for energy, age, education, fortune index and family history of hypertension, BMI, physical activity level, alcohol intake and smoke, two nutrient principal components, protein and sodium intake. The top two figures were in females and the below two in males. BMI, body mass index; DBP, diastolic blood pressure; SBP, systolic blood pressure.
To examine the robustness of the results and compare with other studies, sensitivity analysis was performed by submitting exact carbohydrate quantity with %E from carbohydrate (online supplemental table 2). As expected, one SD increment of carbohydrate was significantly associated with increased SBP by 2.18 (1.05–3.32) mm Hg and DBP by 1.31 (0.69–1.94) mm Hg, even after adjusting for all potential covariates. In all the above analysis, individuals with diabetes, stroke, hyperlipidaemia or those who reported taking antihypertensive medication were excluded. When these subjects were included, the adverse effect did not appreciably change (N=2893) (online supplemental table 3).
Discussion
This population-based cross-sectional study demonstrated that total carbohydrate intake was associated with increased SBP and DBP among Chinese females who derived carbohydrate mainly from refined grains. And the detrimental effect might be more serious at upper quintiles of BP than other quantiles. Additionally, relatively lower and higher carbohydrate consumption was associated with higher SBP, with the minimum SBP level observed at 130–150 g carbohydrate per day. However, the large-scale prospective cohort studies or randomised control trials were needed to confirm these findings.
In the current study, participants derived nearly half energy from carbohydrate, a little higher than US adults in 2015–2016 National Health and Nutrition Examination Surveys.41 It should not be ignored that the past decades witnessed rapid diet transition with a significant reduction in carbohydrate intake among Chinese adults.20 42 This decline in quantity and percentage of energy from carbohydrates might be a reflection of the drop in energy expenditure as lifestyles became more sedentary.43 Changes in economy, nutrition-related policies and food processing methods affects the diet quality at the population level and might be partly responsible for the decrease for carbohydrate consumption.44 These changes might also be explained by the availability of inexpensive vegetable oil and broader supply of animal foods especially pork over the study period.45 In addition, the quality and source of carbohydrates were still undesirable, although the total amount had decreased. Actually, adults in Asian countries consumed more refined sources, particularly white rice and white bread, which were low in fibre and might reflect poor food quality.8 46 In our population, the refined grain carbohydrate accounted for more than 80% of total carbohydrates intake and women might suffer a more serious malnutrition than men.21 Taken together, recommending improvement on carbohydrates source and quality might be particularly applicable to such settings, but not merely focusing on total quantity.
Consistent with previous studies,8 47 our analysis found that total carbohydrate intake was associated with higher BP. The association might vary across the whole distribution of DBP and SBP, with modification by gender. A meta-analysis of 17 low-carbohydrate intervention studies (an Atkins diet, <40 %E from carbohydrate or <50 g per day) for at least 3 months indicated low-carbohydrate diet generated significant decrease in both SBP and DBP among overweight or obese participants.12 The recent international large-scale study also demonstrated the adverse effect of higher total carbohydrate consumption on SBP and total mortality.8 9 However, previous studies paid limited attention on the possibility of non-linear association. In the current analysis, there might be a U-shaped association between total carbohydrate intake and SBP and minimum SBP was observed at 130–150 g per day in females. Previous study suggested that 60% E from carbohydrate might be the break point where significant increased BP was observed.9 Another study reported that both high and low percentages of carbohydrate diet were associated with adverse health outcome, with minimal risk observed at 50%–55% carbohydrate intake.13 This discrepancy of break point might be indicative of wide variability in carbohydrate consumption patterns and suggested the health effect of a specific nutrient might depend on its intake range.8 24 48 Moreover, the QR method applied in current analysis provided more useful information, compared with previous studies using traditional linear regression analysis based on mean estimate. We observed the differential effect of total carbohydrate intake across the conditional SBP and DBP, with a greater increase at the upper percentiles.
Further, we found that gender could modify the association between total carbohydrate intake and BP in this Chinese population. Consistent with previous evidence that dietary nutrients intake resulted in varied effect at different quintiles of SBP and DBP,23 our study showed that per 50 increment of total carbohydrate intake was positively associated with SBP at low and high quantiles (10th–20th and 60th–80th) and with DBP almost across whole distribution (30th–90th) in females. Further study on reasons for this variation was warranted. It should be noted that the significant association between total carbohydrate consumption and BP was detected in females but not males. Similar results were reported by Liu et al that animal protein intake was negatively associated with risk of hypertension in women but not men.24 Several reasons might be responsible for the gender modification on association between total carbohydrate intake and BP. First, the nutrition status of females was much worse than males, characterised by consuming higher proportion of refined grains, but less vegetable and fruits.22 And the nutrients might play a more effective role in less nourished population.20 49 Additionally, there was evidence that females had increased sensitivity to insulin in skeletal muscle than males, which lead to higher levels of intramuscular fat and subsequently increased BP.50 51 Another possibility was that the cigarettes smoking might weaken the effect of diet on health outcomes.52 The majority of smokers in males in current study might partly account for the insignificant effect. However, the underlying reasons about gender-modification effect were still unknown and warranted further investigation.
There were several possible explanations for our main findings. Chinese adults consumed more refined sources (such as white rice and white bread), which were low in fibre. These types of diets may reflect relatively poor diet quality and confer an adverse effect on human health.8 Refined grains, the main carbohydrate-contained food, might be associated with overweight and obesity which was one of the most important risk factors for higher BP.53 Another mechanism might be through its effect on vascular function by lowering nitric oxide,54 which was a potent vasodilator critical for vascular endothelial function and BP control via an increase in urate synthesis.55 In addition, higher total carbohydrate intake might be associated with impaired microvascular function by elevating oxidative stress and inflammation56 and elevating cellular adhesion molecules.57 Other research pointed out that its adverse effect might be related to elevated cytosolic free calcium and peripheral vascular resistance.58 Unfortunately, our study could not test these possible hypotheses as lack of data in present study. More studies on mechanism were needed to reveal the precise reasons.
One major strength of present study laid in that the health effect of total carbohydrate across overall distribution of BP outcome was estimated, allowing for the gender modification. The QR model was distribution-free and more applicable to estimate association varied across levels of the outcomes.23 There were several limitations. One of the major limitations was the cross-sectional design with an inability to infer causation. Second, the residual confounding by unknown and unmeasured factors might still exist, although we adjusted for potential confounders as possible as we could. Third, the generalisability of these findings might be limited due to the fact that the study population was not national. However, this study shared the similar trend of dietary characteristic and nutrition status with the average national level of rural Chinese adults.42 Forth, the diet information was self-reported and measurement error might dilute real relations between carbohydrate intake and health outcomes. However, the FFQ was still the most commonly used instrument in the investigation of the relation between dietary factors and chronic diseases, in large part because of its low cost and ability to capture usual dietary patterns.59 Additionally, it was also the most robust method for assessing an individual’s average dietary intake for long-term period, compared with other assessment methods in large-scale studies.60 Fifth, we did not assess the food source and quality of carbohydrates intake, which might work in a different way on BP. It was noteworthy that total quantity of carbohydrate was still an important and commonly used indicator for dietary guidelines and nutrition epidemiology worldwide.8 44 61 In Chinese, refined grains or cereal was still the main food source for carbohydrate, although the total consumption decreased in recent decades.20 42 We did not include data on sugar-sweetened beverages, sweet cakes and other products high in added sugar that were rapidly increasing in consumption but still represented a tiny component of the Chinese diet, especially in rural areas.62 Finally, the consumed foods and nutrients in diet were highly correlated, and the complex interaction among them might play an important role in human nutrition and health.33 Thus, the current findings on total carbohydrate consumption and SBP and DBP should be interpreted with caution and further exploration would be essential.
Conclusions
Our study suggests that total carbohydrate consumption might be associated with increased SBP and DBP in Chinese females who derive majority of carbohydrate from refined grains, implying a possible gender modification on health effect of carbohydrate intake. Additionally, the positive association varied across distribution of BP quantiles. Further research is warranted to validate these findings and clarify the causality.
Acknowledgments
The authors appreciate all participants for their participation, the investigators of Xi’an Jiaotong University, and doctors of the People’s Hospital of Hanzhong and the village doctors for their organisation.
References
Supplementary materials
Supplementary Data
This web only file has been produced by the BMJ Publishing Group from an electronic file supplied by the author(s) and has not been edited for content.
Footnotes
Contributors All authors and our whole research group completed the study and acquired the data. RL and SD took responsibility for the study concept and design. RL and BM conducted the statistical analysis and drafted and finished the final manuscript. YZ, QL, SD and HY critically revised the manuscript for important intellectual content. SD and HY were responsible for the final approval of version to be published. All authors participated in the interpretation of the results and approved the final manuscript as submitted.
Funding This work was supported by the China Medical Board (Grant Number: 08-925), National Natural Science Foundation of China (Grant Number: 81230016) and National Key R&D Program of China (grant number: 2017YFC0907200, 2017YFC0907201).
Disclaimer The funding authority does not have roles in this study.
Competing interests None declared.
Patient consent for publication Not required.
Ethics approval This project was conducted in accordance with the Declaration of Helsinki and was approved by the Ethics Review Committee, School of Medicine, Xi’an Jiaotong University (Number: 2002001).
Provenance and peer review Not commissioned; externally peer reviewed.
Data availability statement We are committed to maximising the use of our study data to advance knowledge to improve adult’s health. The datasets in present study are available from the corresponding author on reasonable request.
Supplemental material This content has been supplied by the author(s). It has not been vetted by BMJ Publishing Group Limited (BMJ) and may not have been peer-reviewed. Any opinions or recommendations discussed are solely those of the author(s) and are not endorsed by BMJ. BMJ disclaims all liability and responsibility arising from any reliance placed on the content. Where the content includes any translated material, BMJ does not warrant the accuracy and reliability of the translations (including but not limited to local regulations, clinical guidelines, terminology, drug names and drug dosages), and is not responsible for any error and/or omissions arising from translation and adaptation or otherwise.