


Malnutrition among children under 5 years of age is still a widespread problem in many developing countries. Worldwide, approximately 162 million children under 5 years are stunted, while 99 million and 51 million are underweight and wasted, respectively( 1 ). An analysis of data from the Kenya Demographic and Health Surveys (KDHS) over the last three decades shows that there has been a slow decline in the prevalence of malnutrition among young children in Kenya( Reference Masibo and Makokha 2 , Reference Matanda, Mittelmark and Kigaru 3 ). Data from the 2008–2009 KDHS showed that in Kenya, 35 % of children aged <5 years were stunted, 16 % were underweight and 7 % were wasted. The prevalence of stunting was highest (46 %) among children aged 18–24 months and 42 % among those aged 6–12 months. Stunting rates were highest among children living in rural areas (37 %) compared with those living in urban areas (26 %)( 4 ).
While the causes of malnutrition are complex, inappropriate feeding practices during the complementary feeding period have been identified as major factors contributing to inadequate nutrient intakes among infants and young children( Reference Palwala, Sharma and Udipi 5 – Reference Bloss, Wainaina and Bailey 9 ). While consuming a variety of foods is important for meeting essential nutrient requirements needed to promote growth, traditional diets fed to children in developing countries are based predominantly on starchy staples and include few or no nutrient-rich food sources such as animal protein, fruits and vegetables( Reference Arimond and Ruel 10 – Reference Faber, Phungula and Venter 12 ). Often infants and young children are not given the care and attention needed during the selection of nutritious foods and the encouragement needed to eat sufficient amounts of foods( Reference Nti and Lartey 13 ). In addition, even when food resources are available in the home, caregivers might not make the best use of them due to lack of knowledge of the best foods for young children, cultural beliefs and practices, and inappropriate advice( Reference Allen and Gillespie 14 – Reference Bhandari, Mazumder and Bahl 16 ). Studies on young children’s feeding practices in other countries have demonstrated evidence that educational interventions have positive effects on knowledge of caregivers, complementary feeding practices and growth among children( Reference Inayati, Scherbaum and Purwestri 17 – Reference Penny, Creed-Kanashiro and Robert 21 ).
Inadequate nutrition during the complementary feeding period is associated with growth faltering, increased risk for morbidity and mortality, delayed motor development, impaired cognitive development, and reduced educational attainments and social capacities( Reference Dewey and Huffman 22 – Reference Black, Allen and Bhutta 25 ). Interventions are needed that seek to improve the overall dietary quality of complementary diets and promote the consumption of a variety of foods, including local foods, and not merely the intake of individual foods or nutrients, especially in poor rural communities in developing countries( Reference Lutter and Rivera 26 ). Food-based approaches using local agro-biodiversity have been considered to be more cost-effective and sustainable on a long-term basis as a means of ensuring dietary diversity and quality( Reference Frison, Smith and Johns 27 , Reference Allen 28 ).
The purpose of the present study was to assess the effect of an education intervention focusing on the utilization of local agro-biodiversity in improving the diversity of children’s complementary diets and nutrition knowledge of caregivers. It was hypothesized that children whose caregivers participated in the nutrition education intervention would receive more diversified complementary diets and that caregivers who participated in the nutrition education sessions would have improved nutrition knowledge. The present study was part of a larger study aiming at ‘Improving nutritional health of women and children through increased utilization of local agro-biodiversity in Kenya’ (INULA) undertaken by Bioversity International, Nairobi, Kenya in collaboration with Justus Liebig University Giessen, Germany.
Methods
Study setting and participants
A cross-sectional baseline survey was conducted between July and August 2012 in Teso South and Bondo sub-counties in western Kenya. Two-stage cluster sampling was applied in selecting the sample. In the first sampling stage, fifteen villages were randomly selected from each sub-county using probability proportional to population size, giving a total of thirty villages. Second, ten households with children aged 6–23 months and their caregivers were randomly selected from each of the sampled villages. Prior to the baseline survey four enumerators conversant in Kiswahili (the national language spoken in Kenya) and the native languages Teso and Luo (spoken in the study areas) were recruited and intensively trained on the use and application of the survey tools. Informed written consent was sought from the caregivers before any data were collected. Data on the sociodemographic characteristics of the households were collected using pre-tested semi-structured questionnaires through face-to-face interviews with the caregivers. Data on infant and young child feeding (IYCF) practices and knowledge of the caregivers were also collected during the interviews. Data on the dietary consumption and composition of complementary foods were obtained using 24 h recalls( Reference Gibson and Ferguson 29 , Reference Gibson 30 ). Anthropometric measurements were taken for the children and the caregivers following standard procedures( Reference Cogill 31 ). Research permission including ethical approval for the study was granted by the National Council of Science and Technology, Nairobi, Kenya.
The intervention
The nutrition education intervention study applied the cluster-randomized controlled trial design. The most similar villages from each sub-county were paired based on the following variables: district, agro-ecological zone, mean children’s dietary diversity score (CDDS), mean stunting rate, mean wealth index and mean education level of caregivers. The first five village pairs from each sub-county with the smallest mahalanobis distance between them were chosen because they were less different in terms of the above-mentioned variables. The five village pairs from each sub-county were randomly assigned to the control (n 10) and intervention (n 10) groups.
The intervention targeted ten to fifteen caregivers with children aged 6–17 months, residing in the intervention villages. Community health workers (CHW) compiled lists of all caregivers with children in this age group residing in their villages and invited them to participate in the nutrition education sessions. Caregiver–child pairs who were interviewed during the baseline survey and who met the inclusion criteria were also invited to participate in the nutrition education sessions. Participation in the nutrition education sessions was voluntary, and consent was sought from the caregivers before the commencement of the sessions. Caregivers with children aged 6–17 months were chosen to participate in the intervention in order to ensure that their children were aged below 24 months at the time of the endline survey. Figure 1 presents the study design.
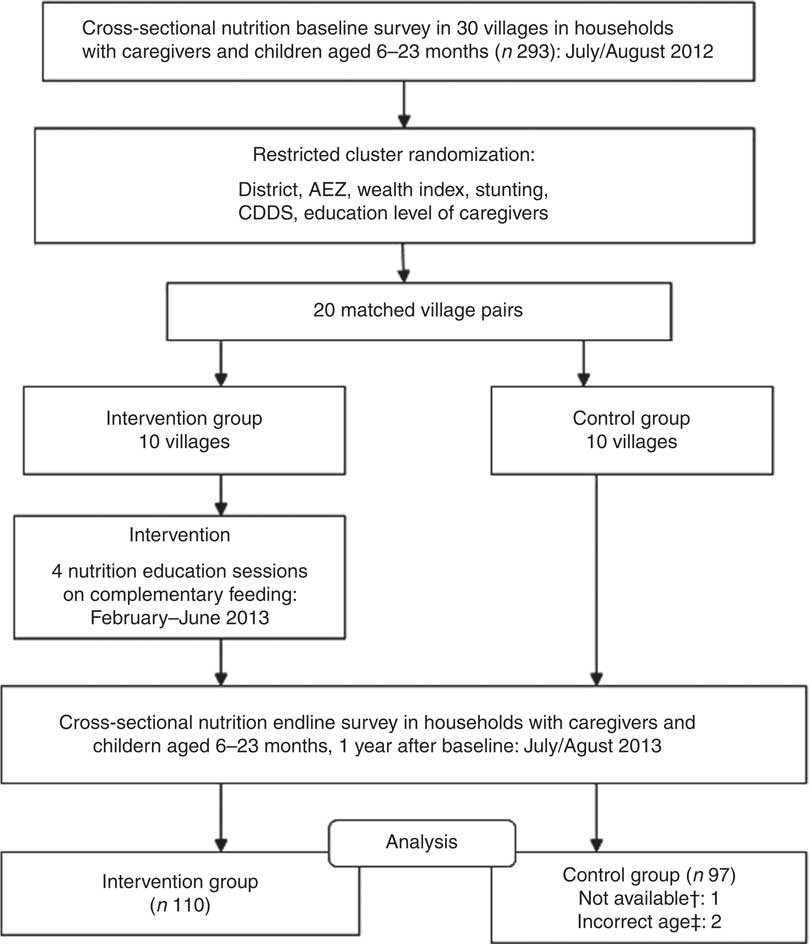
Fig. 1 Study design (AEZ, agro-ecological zone; CDDS, children’s dietary diversity score; †not available: the caregiver was not available at the time of the survey; ‡incorrect age: child’s age not recorded correctly)
The intervention consisted of four nutrition education sessions which were participatory and included both group trainings and cooking demonstrations (Table 1). The themes and topics for the nutrition education sessions were selected based on the findings from the baseline survey and with reference to materials from FAO( Reference Burgess and Glasauer 32 ) and UNICEF( 33 ). The teaching materials were developed by the INULA project research team, consisting of an agricultural scientist and two nutritionists who were also PhD student researchers, at Bioversity International, Nairobi, Kenya. The materials were developed in both English and Kiswahili, the national language spoken in Kenya. The key messages and pictures on the importance of breast-feeding, age-appropriate complementary feeding practices, hygiene and feeding young children a variety of foods were compiled into folders, brochures and posters. The food circle was used to describe the six food groups and examples of locally available foods from each group, a concept used in Malawi( 34 ). Seasonal food availability calendars were developed from knowledge gained through focus group discussions within this project for each of the sub-counties and contained information on the seasons when the different foods from the six food groups were available in the study area throughout the year. The posters had key messages on the importance of feeding children a variety of foods, healthy snacks for children and how to enrich complementary foods using locally available foods. The nutrition education materials were pre-tested with a group of caregivers from a village that was not sampled for the study. During the nutrition education sessions, every participant received a copy of the folder, brochure, seasonal food availability calendar and the poster. The mean duration of the sessions was 2·5 h.
Table 1 Nutrition education sessions conducted among caregivers in the intervention villages in Bondo and Teso South sub-counties, western Kenya
As shown in Table 1, the first two nutrition education sessions were conducted in February and early March 2013. The general election was held in Kenya on 4 March 2013. The results of the presidential election were challenged leading to a petition in the Supreme Court of Kenya, which was dismissed on 30 March 2013. The period during and after the elections was characterized by tension and unrest in several parts of the country, including the study areas. Hence, no fieldwork activities were to be conducted during this period for safety reasons of both the research team and the participants (Bioversity International regulation). Therefore, at the end of the second session the caregivers were encouraged to use this time to go through the nutrition education materials that they had received and to try out the demonstrated complementary diet recipes using locally available foods and based on the knowledge they had acquired during the first two sessions.
In April 2013, individual home-based follow-up visits were made on a randomly selected sub-sample of caregivers in the intervention villages who had participated in the first two sessions. The households for the follow-up visits were sampled randomly using the RAND function in Microsoft® Excel, and the first five from the list of fifteen households in each intervention village selected. The follow-up visits were conducted by the researcher and respective CHW from the intervention villages. The purpose of the follow-up visits was to assess the caregivers’ adoption of the feeding practices they had been taught during the first and second sessions, reinforce appropriate practices and to correct harmful practices. The follow-up sessions were also used to assess the factors hindering the caregivers from preparing diversified diets for their children. Based on the feedback, individual counselling and advice was offered to the caregivers. Feedback from the follow-up visits also informed the decision to review and modify the contents of the third and fourth sessions, which were conducted in May and June 2012.
The nutrition education sessions and follow-up visits were facilitated by the PhD student researcher in cooperation with the respective trained CHW from the intervention villages. The researcher is a nutritionist with experience working as a Nutrition Officer with the rural community under the Ministry of Health and training nutrition students at university level. The CHW worked on a voluntary basis and under the supervision of the District Public Health Officers in the Ministry of Health. The CHW had basic education and no formal training in nutrition. The CHW participated in an intense 3 d workshop prior to the commencement of the intervention, where they were trained on the topics of the nutrition education sessions. The training of CHW was facilitated by a team of three researchers from the INULA project, consisting of an agricultural scientist and two nutritionists, who were also PhD students.
Before the commencement of the project, the INULA project research team travelled to the two study districts (now sub-counties) and briefed the District Commissioners, District Medical Officers of Health and officials from the Ministry of Agriculture on the aim and activities of the project. The trained CHW from the intervention villages organized the venues where the sessions were conducted, and also informed and mobilized the caregivers. The nutrition education sessions were conducted in different venues including churches, chiefs’ offices and in open shaded places that were away from distractions and onlookers, neutral and easily accessed by all the participants.
Endline survey
The endline survey was conducted in the intervention (n 10) and control (n 10) villages between July and August 2013, the same season as the baseline survey. Only caregivers who participated in the nutrition education sessions and whose children did not exceed 24 months of age were interviewed from the intervention villages. Ten households with children aged 6–23 months and their caregivers were randomly selected and surveyed from each of the control villages. Most of the caregiver–child pairs interviewed during the baseline survey did not participate in the nutrition education sessions and endline survey. This is because the endline survey was conducted 1 year after the baseline survey; as such, most of the children surveyed at baseline had grown older than the eligible age of 6–17 months and 6–23 months at the time of the intervention and endline survey, respectively. Some families surveyed at baseline had also migrated from the study area. Caregivers and their children who were surveyed at baseline and who met the inclusion criteria participated in the nutrition education sessions and endline survey. As a result, in the control group, thirty caregiver–child pairs were interviewed at both times, while sixty-seven were interviewed only once at endline and represented the replacement. The intervention group at endline consisted of twenty-two caregiver–child pairs who were also interviewed at baseline and a fresh sample of eighty-eight caregivers with children aged 6–23 months interviewed only at endline. The baseline survey questionnaire, with additional questions targeting the nutrition education intervention, was administered during interviews with the caregivers.
Data management and statistical analysis
Double data entry was performed by two different people using Epi Data Entry Client software version 1·4·2 in order to check for data entry accuracy. The data were analysed using the statistical software package IBM SPSS version 22·0·0·1. A wealth index was computed to assess the socio-economic status of households using principal component analysis( Reference Filmer and Pritchett 35 ) and based on the following variables: main source of drinking water, type of latrine, main material of the roof, main type of fuel, ownership of land and household assets (electricity, radio, mobile phone, watch/clock, television, sprayer, plough, bicycle, ox/donkey cart, motorcycle, car, boat, fishing net and computer). The CDDS were calculated from the 24 h recalls based on seven food groups recommended by WHO( 36 ). The CDDS score ranges from 0 to 7, and children who eat foods from four or more food groups daily are considered to have consumed the minimum recommended dietary diversity( 37 ). The variety of foods consumed by the children was further analysed in more detail using thirteen food groups.
Data on child feeding practices were used to compute additional age-specific IYCF indicators including minimum dietary diversity (MDD), minimum meal frequency (MMF) and minimum acceptable diet (MAD) according to the WHO guidelines( 37 ). MDD is defined as the proportion of children 6–23 months who receive foods from four or more food groups per day. The calculation of this indicator is based on the seven food groups recommended for children aged 6–23 months by WHO( 36 ). MMF is defined as the proportion of breast-fed and non-breast-fed children 6–23 months of age who receive solid, semi-solid or soft foods (including milk feeds for non-breast-fed children) the minimum number of times or more the previous day. The minimum is defined as: two times for breast-fed children aged 6–8 months, three times for breast-fed children aged 9–23 months and four or more times for non-breast-fed children aged 6–23 months. MAD is defined as the proportion of children 6–23 months of age who receive a minimum acceptable diet (apart from breast milk). MAD is a composite indicator calculated from two fractions: breast-fed children 6–23 months of age who had at least the minimum dietary diversity and minimum meal frequency during the previous day; and non-breast-fed children 6–23 months of age who received at least two milk feedings and had at least the minimum dietary diversity not including milk feeds and the minimum meal frequency during the previous day( 37 ). In the present study, MMF and MAD were calculated only for the breast-fed children since we did not have information on the number of milk feeds received by the non-breast-fed children.
Height-for-age (HAZ), weight-for-age (WAZ) and weight-for-height (WHZ) Z-scores for the children were calculated using WHO Anthro version 3·2·2. The children whose height-for-age, weight-for-age and weight-for-height values were below −2 sd of the reference median (HAZ<–2, WAZ<–2 and WHZ<–2) were classified as being stunted, underweight and wasted, respectively( 38 ). The nutrition knowledge of the caregivers was assessed based on the caregivers’ knowledge of three key nutrients (vitamin A, iron and vitamin C), foods rich in these nutrients and importance of feeding children these foods. The caregivers were asked to name three rich food sources and three functions of each of the three nutrients. Each of the three scores had a potential range of 0–7, giving a maximum score range of 0–21.
Descriptive analyses were performed to provide general information on the characteristics of the study population. Differences in sociodemographic characteristics between the control and intervention groups were tested using the χ 2 test for nominal variables, the Mann–Whitney test for ordinal variables and the t test for continuous variables. Pearson correlation was used to determine if there was a relationship between the frequency of exposure to the intervention and the knowledge scores of the caregivers and CDDS. Further analysis using univariate ANOVA was performed to determine the influence of the follow-up on the nutrition knowledge of the caregivers and CDDS.
The treatment effect was assessed using the difference-in-differences (DiD) estimator inside a generalized estimating equations (GEE) framework to account for a data structure where 25 % of the data are panel data and the remaining 75 % are repeated cross-sectional data( Reference Wooldridge 39 , Reference Baltagi 40 ). The underlying assumption of the DiD model is that the intervention group would have developed in a similar way to the control group, if they did not receive any treatment. In the present study, there is no reason to assume that the intervention group would have developed differently, given the study design. Binary outcomes (MDD, MMF, MAD) were analysed using logistic regression inside the GEE framework. The CDDS and the knowledge scores were treated as count variables and analysed using count regression with a Poisson link function and a negative binominal function in the statistical models, respectively( Reference Cameron and Trivedi 41 ). The results from Poisson regression are presented as incidence rate ratio (IRR), which expresses the treatment effect in percentages.
Results
During the baseline survey, 198 caregivers with children aged 6–23 months were interviewed in the control (n 99) and intervention (n 99) groups. Two caregivers were not available for the interviews during the baseline survey. At endline 207 caregiver–child pairs were interviewed, 110 in the intervention group and ninety-seven in the control group. One caregiver was not available for the interview in the control group during the endline survey. Two children from the control group during the endline survey were excluded from the analysis since their ages were not recorded correctly. There were no significant differences in the sociodemographic characteristics of the households, caregivers and children in the intervention and control groups at baseline and endline. Tables 2 and 3 summarize the descriptive characteristics of the children, caregivers and households at baseline and endline. The mean HAZ declined in both the control and intervention groups between the baseline and endline surveys, while the mean WAZ and WHZ increased slightly in both groups between the two time points (Table 2). Table 2 also shows that mean height of the caregivers was not statistically different between the control and intervention groups at baseline (161 cm v. 162 cm, P=0·334). This was different at endline, where caregivers in the control group were taller compared with caregivers in the intervention group (162 cm v. 161 cm, P=0·044). Stunting prevalence increased from 29·3 % in the intervention group at baseline to an alarming 49·1 % at endline, whereas wasting prevalence dropped from 2·0 % at baseline to 0·0 % at endline in the same group. This is different to the control group where we found 29·3 % stunting at baseline and 34·0 % stunting at endline and an increase in wasting from 2·0 % at baseline to 3·1 % at endline (Table 3).
Table 2 Descriptive characteristics of children, caregivers and households at baseline and endline in Bondo and Teso South sub-counties, western Kenya: continuous variables
HAZ, height-for-age Z-score; WAZ, weight-for-age Z-score; WHZ, weight-for-height Z-score.
† P value from t test.
Table 3 Descriptive characteristics of children, caregivers and households at baseline and endline in Bondo and Teso South sub-counties, western Kenya: categorical variables
HAZ, height-for-age Z-score; WAZ, weight-for-age Z-score; WHZ, weight-for-height Z-score.
† P value from χ 2 test for nominal variables.
‡ P value from Mann–Whitney test for ordinal variables.
Feeding practices of the children
Table 4 presents results on child feeding practices in the two groups at baseline and endline. There were no significant differences between the control and intervention groups at baseline and endline in the proportion of children who were still being breast-fed. At baseline there were no significant differences in the proportions of children who achieved MDD, MMF and MAD between the control and intervention groups. At endline, a significantly higher proportion of children in the intervention group compared with those in the control group achieved MDD (87·3 % v. 55·7 %, P<0·001). The proportion of breast-fed children who achieved MMF (98·8 % v. 88·6 %, P=0·019) and MAD (87·8 % v. 51·9 %, P<0·001) was significantly higher in the intervention group compared with the control group at endline.
Table 4 Feeding practices of children in the control and intervention groups at baseline and endline in Bondo and Teso South sub-counties, western Kenya
MDD, minimum dietary diversity, MMF, minimum meal frequency, MAD, minimum acceptable diet.
The consumption of foods from different food groups improved significantly among children in the intervention group after the nutrition education programme. The children were compared based on whether they had been fed foods from the seven food groups recommended by WHO( 36 ). At endline, a significantly higher proportion of children in the intervention group consumed legumes, nuts and seeds (74·5 % v. 39·2 %, P=<0·001), dairy products (91·8 % v. 74·2 %, P=0·001), flesh foods such as meats, poultry and fish (71·8 % v. 42·3 %, P<0·001), vitamin A-rich fruits and vegetables (60·0 % v. 33·0 %, P<0·001) and other fruits and vegetables (70·0 % v. 45·4 %, P=0·001). There were no significant differences in the proportion of children who consumed grains, roots and tubers and eggs in the intervention and control groups at both time points (Table 4).
Further analysis was done to determine the consumption of single food items within food groups by the children. At baseline, there were no significant differences in the proportion of children who had consumed different food items within food groups (Table 4). At endline, an increase was observed in the intervention group in the proportion of children who had been fed vitamin A-rich vegetables and tubers (14·5 % v. 0·0 %), dark green leafy vegetables (68·2 % v. 37·1 %) and fats and oils (96·4 % v. 79·4 %; all P<0·001). Similarly, a higher proportion of children in the intervention compared with control group at endline consumed fish (61·8 % v. 37·1 %), legumes and nuts (52·7 % v. 28·9 %), milk (70·0 % v. 45·4 %) and vitamin A-rich fruits (18·2 % v. 3·1 %; all P=0·001). While an increase was found in the proportion of children fed flesh meats (excluding fish) in the intervention group compared with the control group at endline (14·5 % v. 5·2 %, P=0·045), overall the consumption of animal-source foods by young children in the study area remained low.
Effect of treatment on nutrition knowledge of caregivers and children’s dietary diversity
The results with respect to caregivers’ mean knowledge scores are presented in Fig. 2. At endline more caregivers in the intervention group than in the control group reported correct answers to the nutrition knowledge questions on their knowledge of the three nutrients (vitamin A, iron and vitamin C), foods rich in these nutrients and the importance of feeding their children these foods. At baseline there was no significant difference in the mean nutrition knowledge scores, indicating that the caregivers in the two groups were comparable in terms of their knowledge on the key nutrients. After the intervention, the mean nutrition knowledge score was significantly higher among caregivers in the intervention group compared with those in the control group at endline (8·21 (sd 3·67) v. 3·66 (sd 3·02), P<0·001).
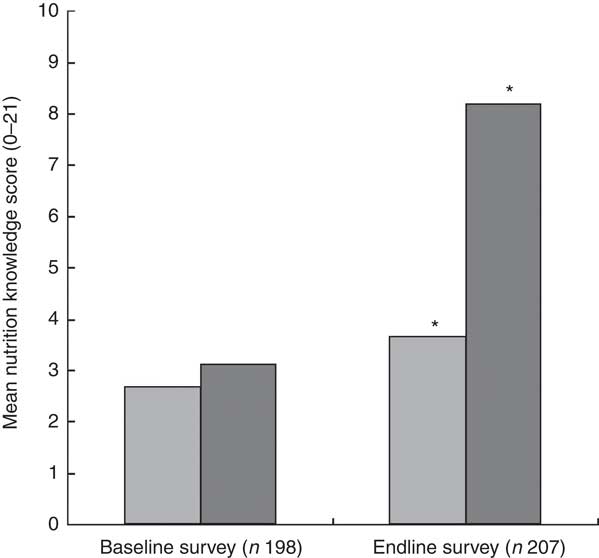
Fig. 2 Mean nutrition knowledge score of the caregivers in the control group (![]() ) and intervention group (
) and intervention group (![]() ) at baseline (July/August 2012) and endline (July/August 2013) in Bondo and Teso South sub-counties, western Kenya. *Mean nutrition knowledge score was significantly higher in the intervention group compared with the control group at endline (P<0·001)
) at baseline (July/August 2012) and endline (July/August 2013) in Bondo and Teso South sub-counties, western Kenya. *Mean nutrition knowledge score was significantly higher in the intervention group compared with the control group at endline (P<0·001)
The caregiver–child pairs were counted as exposed to the intervention if they had participated in any one out of the four nutrition education sessions. Analysis using Pearson correlation showed positive and significant relationships between the number of nutrition education sessions attended and the nutrition knowledge scores of the caregivers (P<0·001) and the CDDS (P=0·032). The nutrition knowledge scores of the caregivers and CDDS increased as the number of nutrition education sessions attended increased. Results from the univariate ANOVA showed that the follow-up had a positive and significant influence on the nutrition knowledge scores of the caregivers, after controlling for household wealth status, size and food security status, age and education level of the caregivers, age of the child and agro-ecological zone. The caregivers who were followed up had higher nutrition knowledge scores compared with those who were not followed up (P=0·041). The follow-up, however, did not have a significant influence on CDDS (P=0·338).
The mean CDDS in the control and intervention groups were not significantly different at baseline. At endline, the mean CDDS was significantly higher among children in the intervention group compared with those in the control group (Fig. 3). In order to assess the treatment effect on CDDS, the DiD estimator was calculated. The variables child’s age in months, wealth index, agro-ecological zone and caregivers’ nutrition knowledge were included in the first model as covariates. The results showed that the CDDS in the control and intervention groups did not differ significantly at baseline (P=0·510). The mean CDDS in the control group dropped significantly at endline (P=0·006) and the endline rate of CDDS was at 85·6 % of the baseline values (IRR=0·856). The treatment effect on CDDS was found to be large, positive and significant (P=0·001). The results showed an estimated average treatment effect on the number of food groups consumed by the children during the last 24 h of +27 % (IRR=1·27). The results showed that the CDDS rate of the children in the intervention group was 27 % larger than it would have been without the treatment effect. Our assumption was that the intervention would lead to improvements in nutrition knowledge among the caregivers and that improved nutrition knowledge would lead to improvements in the CDDS. Indeed, a second DiD model revealed that the treatment had a large, positive and significant effect on the knowledge scores of the caregivers (P<0·001, IRR=2·05). However, in our first model with CDDS as the dependent variable, nutrition knowledge score did not have a significant or strong effect on CDDS (P=0·731) nor on the treatment effect on CDDS (P=0·433). That is why the reported treatment effect on CDDS can be interpreted although knowledge was included in the model as a covariate. If there was an indirect effect from treatment via nutrition knowledge score to CDDS, the direct effect of treatment on CDDS would underestimate the true relationship. Figure 4 visualizes the findings from the two reported models.
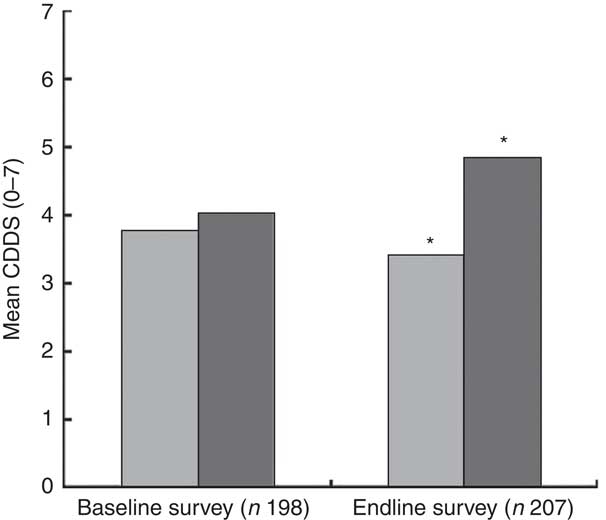
Fig. 3 Mean children’s dietary diversity score (CDDS) in the control group (![]() ) and intervention group (
) and intervention group (![]() ) at baseline (July/August 2012) and endline (July/August 2013) in Bondo and Teso South sub-counties, western Kenya. *Mean CDDS was significantly higher in the intervention group compared with the control group at endline (P<0·001)
) at baseline (July/August 2012) and endline (July/August 2013) in Bondo and Teso South sub-counties, western Kenya. *Mean CDDS was significantly higher in the intervention group compared with the control group at endline (P<0·001)
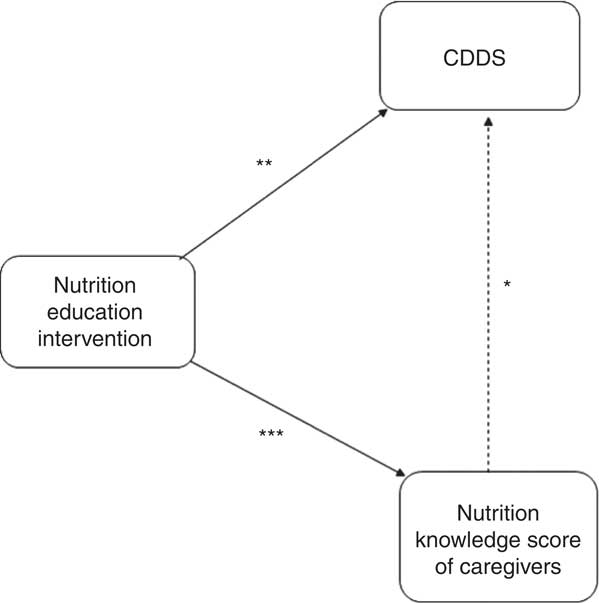
Fig. 4 Effects of the nutrition education intervention (![]() , significant effect;
, significant effect; ![]() , no significant effect) on children’s dietary diversity scores (CDDS) and nutrition knowledge scores of caregivers in Bondo and Teso South sub-counties, western Kenya. *P=0·731; **P=0·001; ***P<0·001
, no significant effect) on children’s dietary diversity scores (CDDS) and nutrition knowledge scores of caregivers in Bondo and Teso South sub-counties, western Kenya. *P=0·731; **P=0·001; ***P<0·001
Further analysis using the DiD model with logistic regression for binary dependent variables was done to determine the effect of the intervention on the IYCF indicators. We found a significant effect of the treatment on the proportion of children who achieved MDD (OR=4·82; 95 % CI 1·94, 11·98, P=0·001). In addition, the treatment had a significant effect on the proportion of breast-fed children who achieved MMF (OR=19·98; 95 % CI 2·05, 195·15, P=0·010) and MAD (OR=6·01; 95 % CI 2·14, 16·93, P=0·001), after controlling for age. Additional analysis using the DiD model with breast-feeding as the dependent variable showed that the treatment did not have an influence on breast-feeding (P=0·980). In yet another DiD model with HAZ as the dependent variable, breast-feeding was found not to have a significant effect on stunting, after controlling for age (P=0·398).
Discussion
The nutrition education intervention aimed to improve the diversity of complementary diets fed to children aged 6–23 months and the nutrition knowledge of caregivers. The intervention was community-based and participatory, and this motivated the caregivers to attend and participate in the nutrition education sessions. The major focus of the intervention was to promote the integration of a variety of locally available and nutritious foods into the existing traditional homemade complementary foods in order to improve their diversity and quality. The intervention was successful and led to improvements in the diversity of complementary foods and the level of nutrition knowledge among the caregivers in the intervention group. The study findings revealed that more children in the intervention group than in the control group at endline were fed on more varied diets. There was a significant increase in the proportion of children consuming vitamin A-rich vegetables and fruits, dark green leafy vegetables, legumes and nuts, and other fruits and vegetables in the intervention compared with the control group at endline. In a randomized controlled intervention study in Uganda( Reference Kabahenda, Mullis and Erhardt 42 ), caregivers in the intervention group selected an increased variety of foods for their children including legumes, meat, fruits and vegetables compared with those from the control group. In another trial educational intervention in rural China( Reference Shi, Zhang and Wang 19 ), the consumption of meats, eggs, dark green leafy vegetables, fruits, cooking oils and beans increased significantly among children in the intervention group compared with those in the control group.
An assessment of the contribution of single food items to the diets of the children showed that milk and fish were the common animal-source foods fed to children in the study area. The actual amount of milk consumed by the children was minimal since milk was mainly used in the preparation of beverages such as tea and porridge which were frequently consumed by the children. The high consumption of fish could be explained by the fact that one of the communities in the study area resided near Lake Victoria, where fish was more accessible and thus the major source of protein. The low consumption of other animal-source foods such as meats, organ meats and poultry could be explained by the fact that more family resources are need to access them. Eggs are recognized for their nutritional value, ease of preparation and consumption; however, their consumption among young children remains minimal in many rural communities( Reference Iannotti, Lutter and Bunn 43 ). While poultry rearing is a common practice in the study areas, there was no significant difference in the proportion of children fed eggs in the control and intervention groups at both baseline and endline. This could be partly explained by the common belief among the communities in the study area that feeding young children eggs could result in delayed speech development. Similar findings of low intake of animal-source foods such as meat, fish and fowl by young and older children in Kenya has been documented( Reference Bwibo and Neumann 44 ). In Ghana economic constraints and fear of establishing taste preferences among children were reported by caregivers as the major barriers to feeding children animal-source foods like meat and eggs( Reference Colecraft, Marquis and Aryeetey 45 ). In a study in Nepal, mothers reported not feeding their <1-year-old children animal-source foods such as meat and eggs because they were difficult to digest and the children did not have teeth( Reference Locks, Pandey and Osei 46 ). In a study in Uganda( Reference Kabahenda, Mullis and Erhardt 42 ), few changes were observed in the consumption of meat because it was not locally available in the study area. Similarly in a formative research in Nepal( Reference Locks, Pandey and Osei 46 ), very few children consumed animal-source foods including eggs since the community did not rear or consume poultry, believing they were unclean. Complementary foods fed to children aged 6–24 months, particularly in developing countries, are plant-based and are not sufficient to meet nutrient needs at this age. It is therefore recommended to frequently feed children small amounts of meat, poultry, fish and eggs since animal-source foods are not only rich in protein but also micronutrients which are important in the growth and development of young children( Reference Dewey 47 , Reference Murphy and Allen 48 ). The findings from the present study suggest the need for interventions to address barriers affecting the consumption of a variety of animal-source foods among young children. Integrated educational, health, nutrition and agricultural programmes promoting the rearing of small animals and consumption of a variety of animal-source foods are needed.
During the cooking demonstrations, the caregivers were taught how to incorporate a variety of nutrient-rich local foods into the existing homemade complementary foods. The use of locally available foods, which required less family resources such as money and time to acquire, was well accepted by the caregivers. This contributed to the significant increase in the proportion of children receiving more diversified diets in the intervention group at endline. The use of locally available foods needs to be included as a component of policies to improve overall dietary quality, especially during the complementary feeding period in order to prevent malnutrition among young children and particularly in resource-poor rural households.
The nutrition education intervention in our study also had a significant effect on the IYCF indicators. A significantly higher proportion of children in the intervention group achieved MDD, MMF and MAD compared with those in the control group at endline. Similar findings were reported in a monthly nutrition education study in rural Karnataka, India that targeted children aged 5–11 months( Reference Kilaru, Griffiths and Ganapathy 49 ). In that study, infants in the intervention group were found to be more likely to have a higher daily meal frequency by being fed at least four times per day and a higher dietary diversity by receiving foods from at least five different food groups compared with their counterparts in the non-intervention group. The calculation of minimum meal frequency and minimum acceptable diet was not done for the non-breast-fed children in our study because data on the minimum number of non-breast-milk feeds they received, which are required for calculation of these indicators, were not available. This limited our study because we were not able to determine the prevalence of MMF and MAD for the non-breast-fed children. There is need to collect data on the number of milk feeds fed to non-breast-fed children in future similar studies.
Another key finding of our study was that the intervention had a significant effect on the nutrition knowledge of the caregivers in the intervention group at endline. Positive effect of educational interventions on nutrition knowledge of caregivers has been reported in other studies. A cluster-randomized controlled trial of education intervention in Peru( Reference Penny, Creed-Kanashiro and Robert 21 ) showed improvements in the nutrition knowledge of caregivers who participated in the educational intervention to improve nutrition in young children. In a study in Indonesia( Reference Inayati, Scherbaum and Purwestri 17 ), the percentage of correct answers on nutrition knowledge in the intensive nutrition education group was significantly higher than in the non-nutrition education group after the intervention. Similarly in a community-based nutrition education intervention study in China( Reference Guldan, Fan and Ma 15 ), mothers in the education group showed significantly higher nutrition knowledge than their control group counterparts. Significantly more mothers in the education group than in the control group reported correct answers on questions about the types of foods that would help their children grow well and the foods that were not good for their infants. In a similar study in China, the percentage of correct answers on nutrition knowledge in the intervention group was significantly higher than that of the control group after the mothers were educated about feeding guidelines for infants and young children( Reference Yin, Li and Yan 50 ).
However, the increase in nutrition knowledge did not have a significant effect on the children’s dietary diversity in the present study. This finding demonstrates that the effect of the intervention on child dietary diversity was not via an increase in nutrition knowledge of the caregivers, and that while increased nutrition knowledge is an important factor, on its own it cannot lead to changes in behaviours. Accordingly nutrition education approaches are most effective when they focus on behaviour change and not merely on information transfer. This is because changes in attitudes and behaviour towards child feeding are reflected by the adoption of appropriate feeding practices( Reference Palwala, Sharma and Udipi 5 ). In our study, the nutrition knowledge scores were based only on three key nutrients and did not refer to knowledge about the importance of a balanced diet and dietary diversity in general. This could explain the missing link from nutrition knowledge to child dietary diversity in the present study (Fig. 4). However, during the nutrition education sessions the importance of using local food resources to achieve a balanced and diverse diet was emphasized. This partly newly gained knowledge could have motivated the caregivers to change their children’s feeding practices.
Our study had a cross-sectional design and targeted children aged 6–23 months and their caregivers. The endline survey was conducted 1 year after the baseline survey. Hence most of the children who were aged 6–23 months at baseline were not eligible to participate in the endline survey as they were aged above the required 23 months, and had to be replaced with a new fresh sample. However, the replaced households with children aged 6–23 months and their caregivers were sampled from the same villages and were comparable to those who were not eligible with respect to sociodemographic and economic characteristics. Thus, the results were compared among two different groups at baseline and endline, showing community and not individual effects. Future studies might target a large sample of young children aged below 1 year and who would still be eligible to participate in both the intervention and endline survey. While through this no children in the age group 12–23 months would be captured at baseline, this would at least enable comparison of data on the same sample and hence analysis of individual effects. In addition, longitudinal study designs are also recommended for future studies to enable follow-up of cases for a longer period in order to also capture seasonal differences and enable more precise estimation of the impact of such interventions on child feeding practices and growth( Reference Yarnoff, Allaire and Detzel 51 ).
The observed development in mean HAZ in the control and intervention groups between the baseline and endline survey might be partially explained by the fact that more than 50 % of the children assessed at baseline were not eligible to participate in the nutrition education sessions and endline survey and were replaced by other children with (inadvertently) shorter mothers. Maternal height is known to significantly influence HAZ of the offspring, which might have contributed to the observed change in mean HAZ values( Reference Kuchenbecker, Jordan and Reinbott 52 ). Breast-feeding was found to influence HAZ, but after controlling for age, the association was no longer statistically significant. This might have been different in a larger study population. Thus, the observed poor nutritional status could be attributed to an interaction of other multiple factors at the individual, family and community levels prior to the intervention, such as inadequate complementary feeding practices, infections and diseases, poor hygiene and access to medical care, and poverty, among other factors( Reference Amugsi, Mittelmark and Lartey 53 , 54 ). Further, as already discussed, the study population was not the same at both times, thus a community effect and not individual effect was observed in the nutritional status of the children. The endline survey was conducted one month after the end of the nutrition education sessions. These results showed the short-term effects of the intervention on child dietary diversity and the nutrition knowledge of the caregivers. To better understand the long-term effects of such an intervention, where dietary diversity is expected to contribute to improvements in growth and overall health of children, there is need to allow for a longer period of time such as 1 year between the end of the intervention and the impact survey. This would enable the assessment of the long-term impact of the intervention on child feeding practices and growth outcomes.
The follow-up visits in our study were found to have a positive and significant influence on the nutrition knowledge scores of the caregivers. The follow-up visits were used to reinforce the messages received during the first two nutrition education sessions. The feedback from the follow-up sessions also informed the decision to review the information and messages delivered during the first two sessions during session three. This was a major strength of our study and contributed to the success of the intervention. Our study had only one follow-up session; hence we recommend that similar studies in the future be accompanied with more follow-up visits to reinforce behaviour change and adoption of improved child feeding practices.
The intervention targeted caregivers, who were mainly the mothers of the children. However, for effectiveness of such nutrition education interventions in the future, it is important to include other members of the family such as husbands and grandmothers who have been shown to have a great influence on child feeding and caring practices in other projects( Reference Aubel 55 ). This could ultimately lead to improvements in child feeding practices which would translate into improved overall health and growth among young children.
Conclusion
Inappropriate feeding practices during the complementary feeding period are known to negatively impact child nutrition, health and overall development. The results from our study have contributed to the evidence about the favourable role of participatory nutrition education interventions focusing on the utilization of locally available food resources in improving the diversity of complementary diets. The results also suggest the need for similar approaches including other family members especially grandmothers and husbands, who would provide a supportive environment that would enable lasting behaviour change among caregivers.
Acknowledgements
Acknowledgements: The authors greatly acknowledge the support from Ms Judith Kuchenbecker who contributed to the development of the data collection tools. Financial support: This work was conducted with unrestricted financial support of the Federal Ministry of Economic Cooperation and Development, Germany, through Deutsche Gesellschaft fuer Internationale Zusammenarbeit (GIZ) and Deutscher Akademischer Austausch Dienst (DAAD). The funder had no role in the design, analysis or writing of this article. Conflict of interest: None. Authorship: L.M.W. was responsible for data collection and the intervention, and drafted the manuscript with contributions from G.B.K., J.H., I.J. and M.B.K. G.B.K. was the principal investigator and contributed to the conceptualization of the study design. J.H. contributed to the statistical analysis. M.B.K. contributed to the revision of the final manuscript. Ethics of human subject participation: Research permission including ethical approval for this study was granted by the National Council of Science and Technology (NCST), Nairobi, Kenya.


