
Abstract
Most people have a clear impression of what the cities, towns and countryside look like in the UK, both physically and in terms of the lives of the people who live there. This article compares rural and urban areas statistically for themes such as working, earnings, services and population, using geographical classifications.
There is quantitative evidence that rural areas are better off than urban areas on a number of different measures, such as unemployment and crime, but there are substantial differences within both rural and urban areas. In a few respects rural areas are worse off. Analysis indicates that house prices are less affordable to local workers in rural areas than urban areas and the costs, travel time and carbon emissions resulting from transport tend to be higher in rural areas.
Using classifications that show sparse areas of England, some topics, such as incomes and qualifications, show ‘two countrysides’ – a better off, less sparse and more accessible one, and a less populous and isolated sparse countryside. Patterns within urban areas often differ, with the most urban areas of England frequently showing different trends from those in other places, and the widest variations.
This article shows that while no single rural/urban classification can be used for all geographies, using such a product helps to better understand the differing characteristics of rural and urban areas in a consistent, transparent way. This article will be of interest to those who wish to explore local authority or small area datasets, covering countries within the UK, for rural/urban differences, as well as those who wish to develop a greater understanding of rural/urban differences in general. It will also be of interest to those involved in local policy development and the allocation of resources within areas, as well as academics, journalists, researchers and members of the public with an interest in the classification and characteristics of rural and urban areas.
Introduction
Despite the continued spread of our towns and cities, the UK geographic landscape is still predominantly rural. Whichever classification is used, for all four countries in the UK, less than one-third of the land area is classified as urban. However, at least 60 per cent of the population is concentrated in these smaller urban areas.
The topographic differences between town and country might be expected to lead to very different experiences for their residents. Transport and access to services are the most obvious areas for study, and this article looks at these as well as population structures, education, health and the physical environment. Although the article does not look at change over time and the recent recession, there is an emphasis on household finances and working lives.
The rural/urban classifications established for different nations and geographies within the UK present excellent opportunities to examine all these themes. The aim of this paper is to apply seven recognised classifications to a variety of datasets to determine if differences and patterns exist in UK life according to how rural or urban a place is.
These classifications allow us to study not just specific places, but ‘place’ in general. They potentially allow differences between places to be shown for big groupings of people, and the bigger the groups, the more quickly or more cheaply robust statistics can be produced. In effect, classifications offer opportunities to help understand complex differences, with less information.
Seeing clear differences between broad groupings of areas may present opportunities for designing, implementing and monitoring policy; but it raises the question – are the differences positive or negative? What effects do they have on the people who live there? Qualitative research is better placed to answer that questionFootnote 1. However, official statistics can be used to consider whether barriers exist (in which case differences might be divisive), or whether people appear to be moving freely, in which case differences could be argued to represent genuine diversity and choice. Both rural and urban areas have been painted positively (idylls and cosmopolitan centres), and as traps. Statistical classifications allow us to dig deeper than stereotypes and impressions.
Sources
Some of the data used in the article were already aggregated to urban and rural area types. However, this is mainly an exercise in taking publicly available datasets, published at local authority or small area level, and matching to a rural/urban classification then aggregating the data directly.
It is worth noting that a wealth of data are available at the small area level from the 2001 Census. This was considered too out of date for analysis for this article. However, when 2011 Census data are released over the next few years there will be many opportunities for rural/urban analysis.
This article aims to complement the large volume and wide variety of rural/urban material published by other UK organisations. For England these include the Commission for Rural
Communities (CRC), the Department for Environment, Food and Rural Affairs (Defra) and the Office for National Statistics (ONS) through its Neighbourhood Statistics Service. The Welsh Government (WG) publishes topic reports and compendia, such as ‘Statistical Focus on Rural Wales’ which gives more information on the local authority level rural/urban classification used here.
The Scottish Government publishes rural/urban material, and, as with other countries, this is both in the form of dedicated reports (for example briefings and key facts documents) and as appendices or sub-sections of wider reports. Different government departments in Northern Ireland publish rural/urban statistics, including the Northern Ireland Statistics and Research Agency (NISRA), Department of Agriculture and Rural Development (DARD) and Department for Social Development (DSD).
The data used in the figures are available at:
www.statistics.gov.uk/downloads/themecompendia/RegionalSnapshot/rt43-rural-urban-areas.xls
Issues and limitations
There are a number of things to bear in mind when interpreting the material in this article.
Interpretation
-
-
Policies designed specifically for urban or rural areas might refer to extremes - inner cities or small villages. Using a statistical classification puts every place in a country, including the areas most people think of as suburbs, into either an urban or a rural area type
-
These classifications make it easy to slip into the ‘ecological fallacy’ - for example thinking of all people in the most deprived areas as deprived, when in fact many people in the most deprived areas are by no means ‘poor’ and the majority of deprived people do not live in deprived areas. Even the biggest rural/urban difference can obscure there being more variation within areas than there is between them
-
On the other hand, it is often hypothesised that neighbourhoods do affect people. For example, studies on deprivation and health sometimes show that even when many other factors are taken into account, simply living in a deprived neighbourhood is associated with poorer health
-
Classifications may feel wrong for particular areas. None of the classifications used in this article take account of the look and feel of a particular place, rather they are modelled using sets of definitions and rules
-
Presentation
-
-
In all cases areas can be split into urban and rural groups (or more accessible, less accessible for local authorities in Northern Ireland), but most classifications give at least one more detailed way of breaking down the data. This report shows a number of different ways of sub-dividing such classifications. However, not all the classifications offer breakdowns of urban areas
-
Urban and rural areas should not be compared using more than one classification, so in general each country is analysed separately
-
Data are not collected and published consistently across the UK, especially for devolved matters such as housing. Although many datasets used here are multi-country, sometimes there has only been space for data analysis for a single country
-
Data accuracy
-
-
In order that official statistics do not identify individual people or businesses, data are subject to disclosure control. In many cases the datasets here have been subject to some degree of rounding or suppression (where some data may not be available). Unfortunately this is more likely to affect smaller areas. Since this article aggregates published data, for local authority datasets the estimates for rural areas (which tend to be less populous) are likely to be less accurate
-
While some datasets, such as those covering crime and General Certificate of Secondary Education (GCSE) or equivalent scores, are derived from administrative sources, in most cases a sample survey has been used. All the figures in this report should be assumed to be estimates and subject to sampling variability, unless stated otherwise
-
Where national figures are published in this report, they may have been aggregated from local data, and therefore may differ from national figures published elsewhere. Different time periods, geographies and use of public (disclosure controlled) datasets may also make figures here difficult to compare with those elsewhere
-
Rural/urban classifications
This article uses two main types of classification to divide areas into rural and urban. To cover small area data and local authority level data for the four countries of the UK requires seven classifications. A summary of each of these, including the data used, publication links, and the headline proportions of urban and rural people, can be found in Appendix A. This section presents a map and a table of key population figures for each one.
Many alternative and older classifications exist - it was estimated in 2007 that 30 different definitions were in use across the UK (Scott, Gilbert and Gelan, 2007). Some classifications cover only some types of area - for example the Commission for Rural Communities’ uplands areas. Other products cover the whole of the UK, but do not focus on rural and urban issues alone. ONS’s Local Authority Classification and Output Area Classification products have some categories that show rural areas; however, these show different geographical distributions from those developed by or with Defra, and are not widely used as rural/urban classifications.
Dedicated rural/urban classifications are generally based on complex modelling exercises. Some aspects have been devised subjectively, for example, selecting the Valleys group of local authorities in Wales using local knowledge and existing policy area boundaries. Thresholds differ, so that any settlement with more than 10,000 people will be considered urban in any UK small area definition; however, settlements with between 3,500 and 10,000 people are treated differently in each classification. Several have been updated, and it is worth noting that a number of government organisations, including Communities and Local Government (CLG), Defra, ONS and WG, are jointly looking into updating the rural/urban definition covering small areas in England and Wales for use with 2011 Census outputs.
What makes a good rural/urban classification? A common approach is to take several continuous data variables, not just one, and look for clusters of areas. Commonly-used factors are population size, population concentration and remoteness (which can be measured as physical distance to other settlements, travel time, or a modelled measure of where people are in relation to each other known as ‘population potential’). Ultimately there is no limit to the kinds of settlements a classification can pick out. Vickers’ 2003 UK district classificationFootnote 2 picks out area groupings such as ‘agricultural fringe’ and ‘averageville’ but this classification has seen less use in recent years than simpler definitions. The perfect classification would be comparable across different nations. Only the Eurostat ‘urban-rural typology’Footnote 3 can offer this at the moment; however, because it is based on larger (NUTS 3Footnote 4) areas than those used in this article, and it does not allow different kinds of urban area to be distinguished, it is not widely used in analyses such as those in this article.
The classifications used in this article are based on different sets of criteria. Individual classifications may have methodological limitations. Such issues tend to be set out in a methodology or technical report for each classification, links to some of which can be found in Appendix A.
The Rural/Urban Definition (England)
Map 1, which uses a small area geography based on Middle Layer Super Output Areas (MSOAs), shows a complex patchwork of area types. Of particular note are the ‘sparse’ areas, both urban and rural, which are few in number, and concentrated in particular areas broadly round the fringes of the country. This definition picks out a far larger number of urban areas than the local authority definitions do, but groups them all together, so that, for example, Westminster and Weston-super-Mare are shown in the same group. It is also worth noting that Town and Fringe – Less Sparse areas almost always lie next to Urban – Less Sparse ones.

The Rural/Urban Definition for MSOAs1 in England
Table 2 shows the predominance of the Urban – Less Sparse area type; no other area type in this report includes such a high proportion of people. There is an interesting symmetry in the difference between urban and rural areas: in England urban areas contain about 80 per cent of the population but cover roughly 20 per cent of the land area, rural areas cover roughly 80 per cent of the land and 20 per cent of the population. Some 42 million people live in urban England by this definition, and just under 10 million in rural England.
Sparse areas, which cover three narrower area types in both rural and urban areas, contain 1.4 per cent of the population. Only 15 per cent of this group are resident in urban areas and the remainder in rural areas. The Urban – Sparse area type, in particular, is very small with a population, of 114,000, which compares, for example, to that of the 2001 Census-defined urban areas of Southport or St Albans. Sparse area types should therefore be expected to have distinct characteristics where survey data are being analysed, as sample sizes are likely to be close to the acceptable minimum. A population pyramid showing the age structure for the rural and urban populations is presented in Figure 52 on page 63.

Population pyramid for England: by area type, mid-2009
The Rural/Urban Definition (Wales)
While the Rural/Urban Definition is the same for Wales (shown in Map 3) as for England, the aggregation of area types into urban and rural wider area types can in practice be done in different ways. For example, in Wales, the Town and Fringe area types may sometimes be divided into urban and rural areas by population size. This report follows the convention of classifying all town and fringe areas as rural.

The Rural/Urban Definition for MSOAs1 in Wales
Table 4 shows that according to the Rural/Urban Definition two-thirds of people in Wales live in urban areas (just below 2 million people), and a third in rural areas (just above 1 million). One in seven Welsh people live in a sparse area; these cover just over 60 per cent of the land area of Wales. With 430,000 people, this is greater than the population of any urban area in Wales from the 2001 Census (Cardiff urban area had a population of 328,000), and roughly equivalent in population size to the Bristol or Sheffield urban areas in England. Higher proportions of the total population live in each sparse area type compared with England, and in most of the rural areas types. At 11 per cent of the population, the Village, Hamlet and Isolated Dwellings (VHID) – Sparse area type is the third biggest in population terms in Wales, and one that covers more than half of the total land area.
Roughly one in eight of the population lives in an area that is both rural and sparse, two in eight in less-sparse rural areas, and five in every eight in urban areas. A population pyramid showing the age structure for the population of Wales is presented in Figure 53 on page 64.

Population pyramid for Wales: by area type, mid–2009
Population by area type (England and Wales)
Figure 5 shows the population of England, Wales and each English region for the six narrower area types. There are three regions that have a similar proportion of their population living in rural areas to Wales: the South West (33 per cent), the East of England (31 per cent) and the East Midlands (29 per cent). Data for Figure 5 and subsequent figures area available at: www.statistics.gov.uk/downloads/theme_compendia/RegionalSnapshot/rt43-rural-urban-areas.xls

Population proportions: by area type, region and country, 2009
The Rural/Urban Local Authority Classification (England)
Map 6 shows which rural/urban area type each local authority in England falls into. Note that this is based on pre-April 2009 boundaries, which gives a higher level of geographical detail for some areas than using current boundariesFootnote 5. However, the methodology for the classification based on the new boundaries has been updated, with a small number of changes, mostly resulting in local authorities moving between the Significant Rural and Other Urban area types. Where new boundaries have been used in this article, this is indicated. See Appendix A for more details.

The Rural/Urban Local Authority Classification (England)
Rural local authorities exist in all regions except London. Most regions have local authorities in all six narrower area types. Note that in some cases local authority types are defined by their population (for example, large urban local authorities have populations of 250,000 to 750,000 people); but the proportion of people in rural areas is used for other types (so Rural-80 local authorities have 80 per cent of their population living in rural areas). Table 7 details key population information for each area type.
Nearly two-thirds of England’s population live in urban local authorities, covering around 15 per cent of the total land area. The classification splits the population into area types of roughly equal numbers of people (with the exception of the much larger Major Urban area type) and similar levels of population growth.
The local authority classification for Wales
Map 8 shows the local authority rural/urban classification for Wales, used for example, in ‘A Statistical Focus on Rural Wales'. For more information, see Appendix A.

The local authority classification for Wales
The map shows a continuous block of Rural local authority areas through the west, centre and north of the country. The Urban and Other area types are split across two different geographical blocks, in the north east and south of Wales. The Valleys local authorities are a group of ex-mining and industrial areas. The local authorities in this group contain the Heads of the Valleys Action Area which is the focus of a programme that takes action on deprivation.
All local authorities in Wales are a mix of urban and rural areas to some degree. There are urban areas within rural local authorities and the reverse.
Two-thirds of Wales’ population of about three million people live in urban local authorities. Such areas cover only a sixth of the total land area of Wales, as set out in Table 9. These urban local authorities are split into three narrower area types of broadly equal population size. It is interesting to note that since mid-2001, populations in the Urban narrower area type have expanded the most, while Valleys local authorities have shown the smallest population growth of any area type. Population densities vary from nine people to every hectare in Urban local authority areas, to just one person to every two hectares in Rural ones.
The Scottish Government Urban Rural Classification
Map 10 shows the distribution of area types for Data zones in Scotland, using the classification with the largest number of area types of any of the classifications used in this article. Large Urban Areas (with populations greater than 125,000) cover Edinburgh, Glasgow, Dundee and Aberdeen. Very Remote Small Towns (which have populations between 3,000 and 10,000 people, and are more than 60 minutes by road and ferry to a settlement of more than 10,000 people) appear in all corners of the country, including the Western Isles and Shetland Isles. The sophisticated measure of remoteness, based on driving time rather than distance, makes a distinction between more accessible rural areas south of Edinburgh and Glasgow, and the more remote areas that start just a short distance north and west of Glasgow.

Scottish Government Urban Rural Classification for Data zones
The proportion of the population living in urban areas according to the Scottish Rural/Urban Classification (shown in Table 11) is more than 81 per cent, covering nearly 6 per cent of Scotland’s land area. This classification could therefore be said to give a ‘tighter’ urban group than the ‘Randall’ definition of local authorities (see below), picking up more people but covering a smaller area. Population growth rates differ too: post-2001 growth is similar in areas defined by local authorities, but far higher in rural areas when defined using Data zones. By contrast Very Remote Rural Areas contain 3 per cent of the population, but cover almost half of the land area.
Populations in all three narrower types of rural areas have shown at least moderate growth since 2001, and average 9 per cent for rural areas as a whole, which is far greater than for urban areas (1.2 per cent). The population within the Remote Small Towns and Very Remote Small Towns area types have actually declined over this period. The classification allows areas to be split by settlement type and remoteness as well. The remote group covers some 305,000 people; the very remote group is even smaller, at 225,000 people, although this is more than the current population of Aberdeen. A population pyramid for the Scottish population is presented in Figure 54 on page 65.

Population pyramid for Scotland: by area type, mid-2009
The 'Randall' definition of Scottish local authorities
Map 12 shows a much simpler geography than that of the small area classification in Map 10. It gives a continuous stretch of Urban local authority areas, sandwiched between Rural local authority areas, running from Dundee in the east to the Isle of Arran, which is part of North Ayrshire local authority, in the west. Aberdeen, which lies in its own local authority area, is classified as Urban; however Inverness, which lies in the Highland Council area and has a low overall population density, is not. These examples show why the more refined small area classification is to be preferred, if data can be produced at the appropriate geographic level.

The 'Randall' definition of Scottish local authorities
Some 70 per cent of Scotland’s population live in the 10 per cent of the land area covered by local authorities classified as Urban, according to the ‘Randall’ definition shown in Table 13. Population densities are extremely low in Rural local authorities, with an average of one person to every five hectares of land.
The Northern Ireland Urban-Rural Classification of settlements
The Northern Ireland Urban-Rural Classification of settlements The Northern Ireland settlement classification in Map 14 does not give continuous spans of particular area types; rather it highlights and classifies particular settlements against a background of small villages, hamlets and open countryside. Less populous urban and more populous rural areas are clustered around Lough Neagh and Belfast, and lie roughly between the middle of the country and the east coast. There is a smaller cluster around Derry in the north west, but some of the larger settlements in the western part of the country are very isolated. Omagh in particular has few urban neighbours.

The Northern Ireland Urban-Rural Classification of settlements for output areas
Of Northern Ireland’s 1.8 million inhabitants, some 36 per cent, or around two-thirds of a million, live in rural areas (Table 15). This is a slightly smaller proportion than in the local government district classification, yet it covers a much greater proportion of the land area – in other words the small area definition is much more precise. This is true of different levels of small area data too. The 2001 Census Output Area geography is used here, because data based on this geography are compatible with a number of other datasets. However, it gives a very slightly lower proportion of the population living in rural areas than data based on precise settlement boundaries.
Table 15 shows band A (Belfast) is the largest settlement area type by population size, with nearly a third of the population of Northern Ireland; bands B to G are much smaller, each covering 4 to 14 per cent of the population and up to 2 per cent of the land area. More than a quarter of the population, just less than half a million people, live in the most rural areas (band H), covering 91 per cent of the country. Population growth since 2001 has been highest in this settlement band and above average in other rural areas. A population pyramid for Northern Ireland is presented in Figure 55 on page 66.

Population pyramid for Northern Ireland: by area type, mid-2008
The less accessible/more accessible Northern Ireland local government district classification
This classification, shown in Map 16, splits the country into two area types. The more accessible group of local authorities, sometimes referred to as ‘urban’, or simply ‘eastern’, is centred in and around Belfast. The less accessible group of local authorities or ‘western’ group can be used to define areas as rural, although this group includes Northern Ireland’s second most populous city, Derry.

Less accessible/more accessible Northern Ireland local government district classification
Table 17 shows that the Northern Ireland local government district classification defines a larger proportion of the total population as rural than the other classifications set out in this section, at 39 per cent of the population. However, this population lives in over two-thirds of the area of the country, suggesting the classification is picking out a distinct area type. Population growth in the less accessible, western group of local authorities has been almost twice that of the more accessible group since 2001.
Working
Job locations
In 2008 the UK had an estimated 32 million jobs and 40 million people aged 16 to 64, which includes students, homemakers, those with multiple jobs, and others not actively seeking work. This jobs estimate is based on workplace location, and includes the self-employed, those on government training schemes and HM Forces. A ‘jobs density’ can be calculated by dividing the number of jobs in an area by the number of residents aged 16 to 64, and is one way of measuring disparities between the number of workers and jobs. It can be produced for local authority areas. The UK average is 0.79 jobs per person; national rates range from 0.71 in Wales to 0.80 in Scotland. This section aims to answer the question, are rural areas generally ‘dormitories’, with more workers than actual jobs? Figures 18 to 21 examine the patterns country by country.
In England two of the urban area types have the highest jobs densities, at 0.83 jobs per person for Other UrbanFootnote 6 and 0.82 for Major Urban, the group of local authorities covering the cities with the biggest populations. There is no clear pattern among the other area types, and differences are small overall. Of the eight rural local authorities with jobs densities above one, six are in the Rural-80 group (the most rural areas). Some are self-contained by virtue of their geography – the Isles of Scilly, for example; others have historic importance – such as Stratford-on-Avon.
Of all urban local authorities, the City of London has an exceptionally high density of 37 jobs per resident aged 16 to 64; Westminster is next highest at 3.3. A number of London boroughs appear at the top and bottom of the urban rankings, with Lewisham showing the lowest jobs density in England at 0.41.
In Wales, the Valleys area type shows the lowest jobs density of any area type at 0.57 jobs per person, while local authorities in the Urban area typeFootnote 7 have the highest jobs density at 0.87. The Rural area type jobs density is only a little lower than that of Wales as a whole. The highest jobs density is for an Urban local authority (Newport, 0.92), the lowest in a Valleys area (Blaenau Gwent, 0.49).

Jobs densities in Wales: by area type, 2008

Jobs densities in Scotland: by area type, 2008

Jobs densities in Northern Ireland: by area type, 2008
There are only small differences in jobs density between Urban and Rural areas in Scotland, with Urban areas showing a jobs density of 0.81 jobs per person, compared with Rural areas at 0.77. Some of the most isolated Rural local authorities have the highest jobs densities – Highland, Shetland Islands and Orkney Islands all have densities above 0.90. However, the highest jobs density, at 1.27, is in an Urban local authority – Aberdeen City – which may relate to jobs offshore in the oil and gas industries. This is three times as high as the lowest jobs density – 0.39 in East Renfrewshire (an Urban area).
The less accessible area type covering local authorities in the western part of Northern Ireland shows a lower than average jobs density, at 0.66 jobs per person. The highest value for this area type is 0.79 for Coleraine – so while this group has fewer jobs than might be expected, there are no highly isolated areas that have high jobs densities because commuting out of these areas is hard. Local authority areas in the more accessible area type vary substantially, from 0.38 in Carrickfergus to 1.33 in Belfast.
There is no evidence that rural areas are simply ‘dormitories’ in any country of the UK. If anything, urban areas could be said to contain a higher proportion of more ‘dormitory’ local authorities, with the highest and lowest jobs densities tending to appear in urban areas.
Working patterns
ONS’s Annual Population Survey (APS) is an on-going social survey based on the Labour Force Survey, which asks a large sample of people a variety of questions about working life. The records include the Rural/Urban (MSOA) Definition area type; Figure 22 examines the urban/rural and less sparse/sparse dimensions. It is worth noting that some aspects of working life not shown here, such as patterns of part-time working, display only very small differences across area types.

Working patterns in England: by area group, 2009/10
Self-employment and working from home (or being based at home) are both more common in rural areas of England than in urban areas. They are more common still in sparse areas, where people are twice as likely to be home-based or self-employed, as those in less sparse areas (one in four in sparse areas compared with roughly one in eight in less sparse areas). While Figure 18 shows that there are fewer jobs per worker than average in rural areas, Figure 22 shows that people access work in different ways in both rural and sparse areas compared with urban and less sparse areas.

Jobs densities in England: by area type, 2008
Rural areas have slightly higher proportions of people in higher managerial and professional occupations (12 per cent of people aged 16 to 64 compared with less than 10 per cent in urban areas), and lower proportions of people who have never worked (which include students) than urban areas. Interestingly, sparse areas show the reverse pattern, with about half the proportion of people in the higher managerial and professional occupation (some 6 per cent) compared with rural areas.
The APS asks a number of questions to estimate how many people want or need to work more than the standard hours for their job. There is no clear pattern in the results – respondents in urban or less sparse areas are somewhat more likely to have worked overtime recently, and to want to work more hours at their current rate of pay (classified as ‘underemployed’). Likewise, respondents in sparse areas are more likely than those in less sparse areas to have a second job (7 per cent of workers compared with 4 per cent in less sparse areas). Figure 23 shows the same data for Wales.

Working patterns in Wales: by area group, 2009/10
Working patterns in Wales show very similar rural/urban differences to those in England. Working based from home or being self employed are far more common in both rural and sparse areas than in urban and less sparse areas. Workers in higher managerial or professional occupations are slightly more common in rural areas and less common in sparse ones. There are only small differences in the proportions of people with second jobs; however, working overtime and wanting to work more hours at the same rate of pay (underemployment) are more common in urban and in less sparse areas.
Employers
The ONS Inter-Departmental Business Register (IDBR), from which the following data are taken, covers the vast majority of UK economic activity, using administrative records and survey estimates. The 2010 IDBR details nearly 2.2 million ‘local units’ in England, and around a further 113,000 in Wales. A local unit is defined as an individual business site, such as a branch of a national retail chain, located in a geographically identifiable place, as opposed to the parent ‘enterprise’ such as a head office. Local units are sometimes referred to as ‘businesses’, however, it is important to remember that they include public sector employers as well as those in the private sector. Figure 24 shows which of the 17 industriesFootnote 8 showed the biggest differences in prevalence between rural and urban areas, using the small area (MSOA) Rural/Urban Definition. Is the rural economy dominated by farming?

Local business units in England for selected industries: by area type, 2010
There were nearly 560,000 rural local units in England in 2010, representing a quarter of all businesses (or some 23 per cent when agriculture, forestry and fishing units are excluded). Given that 19 per cent of all people live in rural areas, the prevalence of local units in rural areas might be greater than that expected, even when agriculture, forestry and fishing is excluded.
Figure 24 shows some of the largest percentage point differences in the prevalence of businesses in urban and rural areas by broad industry group. Just under 15 per cent of all rural local units were in the agriculture, forestry and fishing category, while retail represents a notably higher proportion of local units in urban areas. Construction has a higher proportion of the industry mix in rural areas than in urban areas, with one in eight Rural area units being in that industry. None of the 17 broad industry groups are absent from rural areas, with finance and insurance having the smallest proportion of total units by broad industry group in rural areas. Public administration and defence units, not shown, are also noticeably more prevalent in urban than rural areas, with just 18 per cent of these located in rural areas (compared with 26 per cent of all units).
Nearly half of Wales’ 110,000 local units were located in rural areas. When agriculture, forestry and fishing local units are excluded, this falls to 42 per cent of all local units. When compared with the population living in rural areas (34 per cent of the total population) this is higher than might be expected. Just under a quarter of all rural businesses were in the agriculture, forestry and fishing sector.
Figure 25 shows that several industries, and especially the retail category, have a higher share of the industry mix in urban areas than in rural areas. As is the case in England, there is no industry that shows a very strong urban or rural predominance, beyond agriculture, forestry and fishing. Public administration and defence local units (not shown) are less likely to be located in a rural area than local units are in general, with 37 per cent of such units present here. Two industries, health and finance and insurance (not shown), had fewer than a third of their units in rural areas (at 32 per cent in both cases).

Local business units in Wales for selected industries: by area type, 2010
In relation to their resident population, rural areas are home to a relatively high proportion of local units and they are more likely to be small employers. Some 75 per cent of rural units in both England and Wales have fewer than five employees; this compares with 66 per cent of urban local units in England and just under 60 per cent in Wales.
Unemployment and inactivity
The APS is the main source for official unemployment estimates at sub-regional level. Bespoke data were obtained from the survey using the more geographically detailed 2001 Census Output Area level definition, which separates ‘Villages’ from ‘Hamlets and Isolated Dwellings’. A disadvantage of looking at data this way is that sample sizes for the smallest area types, such as Very Remote Rural areas in Scotland, for example, will give less reliable results than for more populous area types. Figure 26 shows three key measures of economic activity for England for the financial year 2009/10 using the Output Area level definition. Figures 26 to 28 reflect an aggregation of narrower area types.

Labour market activity in England: by area type, 2009/10
Some 7.9 per cent of the economically active population of England was estimated to be unemployed in 2009/10, and 23 per cent of the population aged 16 to 64 was economically inactive. The rural/urban unemployment rates show clear differences, ranging from an estimated 8.6 per cent in urban areas (1.8 million people), to 5.2 per cent in rural areas (260,000 people).
The employment rate is higher and inactivity rate lower than the national average in rural areas. In the most rural settlement types unemployment was estimated at just 4 per cent, just over half the national average. Sparse areas differ in their labour market characteristics from rural areasFootnote 9. On average, sparse areas have a relatively low unemployment rate close to that of the whole rural group, but a rate of economic inactivity that is only slightly below average.
Inactivity covers a broad range of circumstances. In rural areas generally, and in all three rural area types, below national average proportions of the population (aged 16 to 64) are economically inactive students, home-makers, or sick/disabled. However, there are above national average proportions of early retired people. Figure 27 shows the equivalent data for Wales.

Labour market activity in Wales: by area type, 2009/10
The rural/urban differences in Wales are generally smaller than in England. Unemployment is estimated at 6.2 per cent in rural areas, and is roughly half as high again in urban areas, at 9.6 per cent. Interestingly, all three labour market rates are close to average in Town and Fringe areas; the rural pattern is only seen in the Village, and Hamlet and Isolated Dwellings settlement types, where unemployment is less than two-thirds of the national average.
Figure 28 shows the equivalent data for Scotland. Some 7.3 per cent of the economically active population was estimated to be unemployed in 2009/10, and 23 per cent of the population aged 16 to 64 was economically inactive. There is a very strong rural/urban difference in Scottish working life. While in Urban Areas the unemployment rate was estimated to be 8.0 per cent, and 24 per cent of people aged 16 to 64 were economically inactive, Rural Areas had corresponding rates of 4.5 per cent and 20 per cent.

Labour market activity in Scotland: by area type, 2009/10
Compared with Scotland as a whole, economically inactive students or sick/disabled people represent lower proportions of the rural population aged 16 to 64; similar proportions are looking after homes or families, and a higher proportion of people are early-retired. Small Towns have employment and unemployment rates lying between those for Urban and Rural Areas; however, economic inactivity rates, and specific types of inactivity, are closer to those for rural areas generally.
Very Remote areasFootnote 10 had the highest employment rates at an estimated 80 per cent of the population aged 16 to 64 and Accessible areas the lowest at 71 per cent. The unemployment rate in very remote areas, at 3.3 per cent, was less than half that for Scotland as a whole. Unemployment rates for Remote areas show rates in between those of Very Remote and Accessible areas.
Income and earnings
Average incomes
Differences in income, as distinct from earnings or overall wealth (which is difficult to measure at small area level), are a useful indicator of economic wellbeing. Modelled data for MSOAs show that in 2007/08 the average weekly gross income per household in England was £670, and £540 in Wales. When taking account of household composition (a process known as ‘equivalisation’), deductions such as tax, and housing costs, incomes fell to £420 and £380 respectively. Figure 29 shows how incomes in England vary by area type, using the small area (MSOA) definition. Are incomes higher in one type of area?

Average weekly household income: by area type, 2007/08
Considering areas by their rurality and sparsity, however income is measured; the most rural and the least sparse areas perform better. Total weekly income was as high as £751 per week in Village, Hamlet and Isolated Dwellings – Less Sparse (VHID – Less Sparse) households (equivalent to about £39,000 a year), and as low as £533 in Urban – Sparse householdsFootnote 11 (or about £28,000 a year). Urban – Sparse areas had lower incomes than average, ranging from 79 per cent of the national average when using total income, to 83 per cent when taking household structures into account (either before or after household costs). Among less sparse areas there is greater variation in incomes. The highest earning 10 per cent of Urban – Less Sparse MSOAs had almost twice the total income of the bottom 10 per cent of MSOAs. Wales, not shown in Figure 29, shows similar patterns of differences between area types; however, the variations in income between area types tend to be smaller in value.
Poverty
Poverty is conventionally measured by the proportion of all households that fall below the recognised poverty threshold, which is set at 60 per cent of the England and Wales mean weekly equivalised income (after housing costs). In 2007/08 for England and Wales this was estimated at £199 per week (or £862 per month). Figure 30 shows how poverty rates in Wales varied by small area (MSOA) type.

Percentage of households below poverty threshold: by area type, 2007/08
Both sparsity and rurality appear to affect poverty levels. VHID – Less SparseFootnote 12 areas have the lowest estimated poverty rate at one household in five. Sparse areas that fall into the town and fringe or urban settlement types have the highest proportions of households below the poverty threshold; however, results may be less reliable for these areas because they each contain very small proportions of the total population and are more difficult to estimate. No area type is poverty free – there is often more variation within area types than there is between them.
England shows similar differences by area type; however, the two Town and Fringe area types have lower relative poverty. Both types of less-sparse rural area (Town and Fringe and VHID) show well below average poverty levels for England.
Across England and Wales there were 75 MSOAs where more than 50 per cent of households were in poverty, all in urban areas. Of these MSOAs only one was in Wales (in Cardiff) and 21 were in Birmingham. The highest percentage of households in poverty was in a Leicester MSOA at 68 per cent; the lowest level, at less than 5 per cent of households, was an MSOA in Wokingham, Berkshire. Both these MSOAs are classed as Urban – Less Sparse.
Earnings flow
The rural/urban differences in income suggest investigating the flow of earnings for people who earn in one area type and live in another area type. Are rural/urban areas self-sufficient, or dependent on well-paid jobs elsewhere? The ONS Annual Survey of Hours and Earnings (ASHE) estimates workers’ earnings based on both where people live and where they work, at local authority levelFootnote 13. The data in Figures 31 to 32 reflect a snapshot of weekly average earnings as at 1 April 2010. Areas types with a ‘positive’ flow are those where workers living in the area, regardless of where they work, earn more on average than those whose jobs are located in the area, regardless of where they live.
In England all three rural local authority area types have a positive earnings balance for each identified employee type (Figure 31). Differences in the levels of these positive balances are similar for all three rural area types, suggesting that this situation doesn’t just cover people in rural areas adjacent to urban ones, commuting out to take high paid jobs. Conversely earnings are ‘flowing out’ of Major Urban areas at a higher level than in any other area type (that is, employees living in these areas earn less than those working there). The rural/urban earnings flow is much more pronounced for male and full-time workers, although it is important to recognise that more men than women work full-time.

Flow of earnings in England: by area and earner type, 2010
In Wales, for all types of employees, there is a net flow of earnings into Rural local authority areas from non-rural areas; and overall earnings are also flowing into Urban area type local authorities (Figure 32). For the OtherFootnote 14 area type, there is a net earnings outflow for males employees but a larger net earnings inflow for female employees. For both Other and Valleys local authority areas there is a net earnings outflow for all employees, though a net earnings inflow for part-time employees in Valleys areas. These findings suggest that there are important gender differences in earning flows, with women bringing net earnings into Rural and Other areas, and out of Valleys and Urban areas.

Flow of earnings in Wales: by area and earner type, 2010
Within Scotland there is a net earnings flow from Urban local authorities into Rural ones. This effect is more pronounced for full-time and male workers.
Services and life chances
Access to services
Life in any type of area can be much harder if it takes disproportionately longer to travel to basic services, such as shops or GPs. Differences in travel times vary according to transport mode.
Scotland
Scottish data, presented for Data zones, allow both area types and transport modes to be comparedFootnote 15. Figure 33 shows modelled driving times, which were developed for the Scottish Indices of Multiple Deprivation, for five services.

Average drive time to service: by area type, 2009
Driving times to most services for both urban and rural areas could be described as brief, at less than 10 minutes from all but the most remote rural areas. Shopping centres and GPs are typical of services that take longer to reach from both more rural and more remote areas. Driving times to libraries, not shown here, display a similar pattern.
Journey times to petrol stations and primary schools seem to be determined by ‘rurality’ alone, with all three types of rural area showing times that are high in relative terms, but still less than 10 minutes. Driving times to many services – police stations, banks, general stores, and nurseries – are also relatively higher in rural areas only, although the average driving times vary.
Small towns provide similar access to services compared with other urban areas, as do the less remote rural areas; only services such as higher education and citizens’ advice centres (not shown) are relatively quicker to access in the most urban areas (areas such as Aberdeen, Dundee, Edinburgh and Glasgow). Being remote therefore may only mean being remote from ‘specialist’ services, rather than everyday ones.
Public transport travel times shown in Figure 34 are relatively similar in urban areas and small towns areas, at typically 10 minutes for post offices, banks and general stores. Times for rural areas are much higher, rising to over an hour for access to chemists in the most remote rural areas (most of which are in the Shetland Islands). For people without access to a car, therefore, access to even the most everyday services may be a barrier to living in a rural area. Furthermore, the extent to which services can be accessed in different ways (for example by offering home delivery) may vary between area types.
England
-
Modelled travel time estimates for Lower Layer Super Output Areas (LSOAs) are published as part of the Department for Transport’s (DfT) 2009 Core Accessibility IndicatorsFootnote 16. This shows that in 2009 on average eight key services (employment; primary schools; secondary schools; further education; GP; hospital; food store; and town centre) could be accessed within a reasonable time by 60 per cent of users in urban areas compared with 48 per cent in rural areas. Differences were highest for hospitals and town centres, but lowest for primary schools.
Analysis of the ‘employment centre’ estimates from this data source shows that similar proportions of people have (by walking or public transport) access to work in different kinds of areas. Bigger differences occur when looking at the availability of public transport required for these journeys. In less sparse urban areas the availability indicator is close to the maximum. It is far lower for sparser and more rural areas, and falls to just 40 per cent in Village, Hamlet and Isolated Dwellings (VHID) – Sparse areasFootnote 17.
Wales
-
Data for Wales show estimated travel times for LSOAs for nine different services by public transport or walking. These data are the geographical access to services indicators for the Welsh Index of Multiple Deprivation 2008, produced by WG. Travel times are similar for urban areas and town and fringe areas, so most people can be said to have ‘reasonable’ levels of access. VHID – Less Sparse areas showed substantially higher travel times, while the equivalent sparse areas have travel times 40 per cent to 70 per cent higher again.
Internet access and use
-
There are multiple ways of measuring access to the internet: broadband coverage; actual take-up; speed of access; and how often people use it. Figures produced by Ofcom, the internet regulator, show survey results on internet access for urban and rural areas based on the ‘Locale classification’ which covers the whole of the UKFootnote 18. In each UK country the proportion of people with access to the internet was somewhat higher in rural areas than urban ones. In Scotland, however, the difference was very small; although a slightly higher proportion of the rural population reported an intention to acquire internet access in the following year.
Is access to the internet a status symbol in rural areas, or a functional tool? Figure 35 shows the proportions of adults (defined here as aged 15 and over) with internet access reporting specific uses of the internet within each wider area type in England.
Figure 35 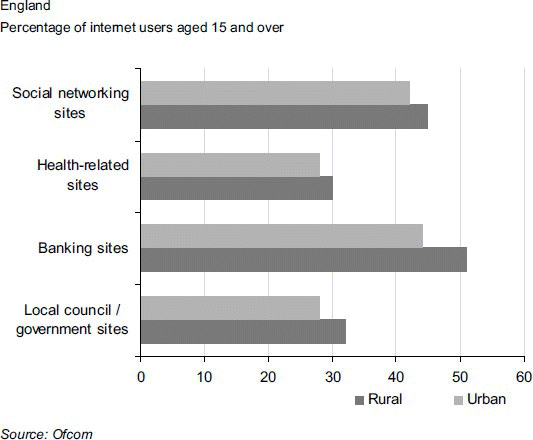
Use of different types of internet site: by area type, 2010
Although this is based on a small list of many possible internet uses, the findings do suggest that adults in rural areas with access to the internet are more likely to use each kind of site. The biggest difference occurs in the use of banking sites in rural areas, with a majority of adults in rural areas (51 per cent) reporting this use, compared with 44 per cent of urban area internet users. The internet seems to compensate for poorer access to physical servicesFootnote 19.

Expenditure
-
The Living Costs and Food Survey uses respondent diaries to capture the expenditure of around 16,000 households across Great Britain. In the period 2007 to 2009 rural households on average spent an estimated £500 per week, 11 per cent more than the £450 spent on average by urban households. Note this definition combines the Defra Rural/Urban definition for England and Wales and the Scottish Government Urban Rural Classification. Figure 36 shows this spending broken down into categories, sorted in order of the absolute rural/urban difference in expenditure.
Figure 36 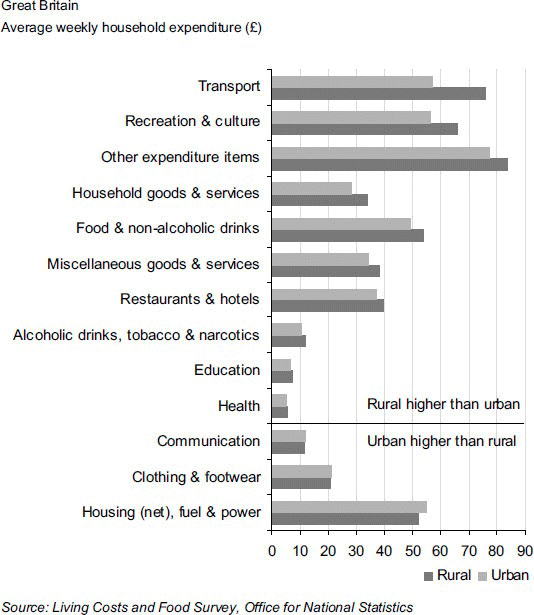
Average household weekly expenditure: by category and area type 2007 to 2009
There are two material aspects of rural life that may appear to make rural areas worse places to live: older, harder-to-heat housing stock, and poorer transport connectionsFootnote 20. However, rural households are estimated to be spending less on total housing costs than urban ones (excluding mortgage interest payments and council tax), but substantially more on transport. The difference in transport spending is estimated to be just below £20 per week, or 43 per cent of the overall difference in expenditure between urban and rural households. Rural households also spend more on a range of goods and services, including food, restaurants and hotels and household goods and services. These figures could be interpreted to indicate that life in the countryside is more expensive; but equally it could be argued that people in the countryside are enjoying the benefits of higher disposable incomes.


Average travel time, by public transport: by area type, 2009
Education
Early years
-
The Department for Education in England publishes rural/urban area figures comparing how teachers assess their pre-school pupils, entitled ‘Achievement in Early Years Foundation Stage Profile’. In 2010 some 76 per cent of all pre-school pupils living in urban areas achieved ‘78 points across all scales’ which is a recognised development standard, while 55 per cent were thought to show ‘a good level of development’. These figures are 7 and 6 percentage points lower than in rural areas, respectively. Is pre-school education better in rural areas? This is not necessarily the case when deprivation is considered, as Figure 37 shows.
Figure 37 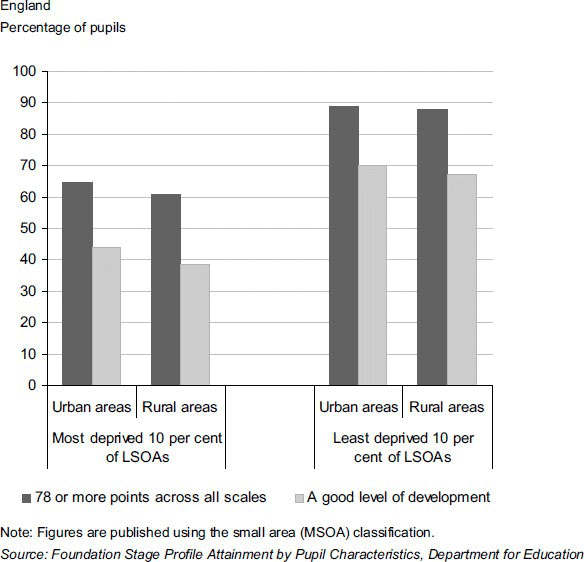
Assessments of early years pupils: by deprivation decile and area type 2010
Comparing rural and urban areas within each 10 percentage point group of the Income Deprivation Affecting Children IndexFootnote 21 (IDACI) shows only small differences in performance levels on the ‘78 or more points across all scales’ measure. There was little difference between rural and urban areas within the least deprived group. In the most deprived group, however, for the pre-school pupils living in approximately 81,000 urban areas, they outperformed those living in approximately 550 rural areas. For the ‘good level of development measure’ urban areas outperformed their equally-deprived rural counterparts in all but two deprivation groups, albeit by only a small margin. Overall then, it seems that low deprivation is important to a good start in the education system; area type only appears to have an influence through the fact that rural areas are less likely to be deprived.

GCSE and equivalent results
-
GCSE and equivalent qualification results are a very useful benchmark of education levels, providing a record (as opposed to survey-based estimates) of performance in the final year of compulsory education in England. In 2008/09, 51 per cent of eligible pupils achieved five or more A*–C grades at GCSE or equivalent including English and Maths. Some 54 per cent gained two or more A*–C GCSE grades or equivalent in science subjects. Figure 38 shows these by area type at the MSOA level.
Figure 38 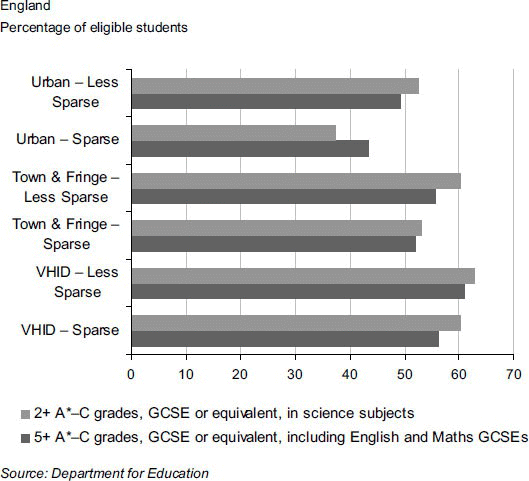
Proportion of pupils achieving GCSE and equivalent targets: by area type, 2008/09
The proportion of pupils achieving the English and Maths target varied considerably, from 44 per cent for those living in Urban – SparseFootnote 22 areas, to 61 per cent for those living in VHID – Less
Sparse areas. The difference between these two area types is even more extreme when looking at the target for science subjects. There is a broad pattern: the more rural an area is, the better its pupils’ results; the more sparse it is, the worse. However, as shown in Figure 37, rural and urban levels of deprivation are very different and comparing similarly deprived areas may show a different story.

Qualifications
-
Another way of looking at education is to examine patterns in the qualifications of the adult population. Figure 39 shows data on the highest level of qualification obtained by the employed people in each area type, derived from the APS for 2009. Using the National Qualifications Framework (NQF) qualifications can be grouped, with Level 2 being equivalent to GCSEs graded A* to C, and Level 4 covering higher education qualifications (certificates, diplomas, degrees) and equivalents.Footnote 23 Results are presented twice – once splitting out the urban and rural areas, and again comparing sparse areas with those that are less sparse, based on the Output Area each respondent lives in.
Figure 39 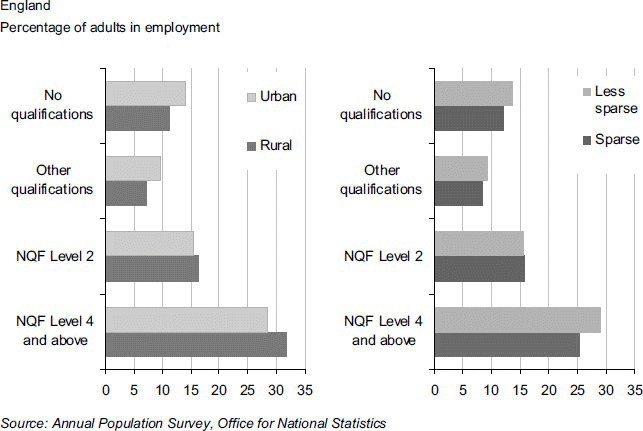
Adult highest qualification levels in England: by area group, 2009
Rural areas have somewhat higher proportions of employed adults with qualifications from Level 2 (GCSEs grade A*–C or equivalent) to Level 4 (a degree or equivalent), and with trade apprenticeships (not shown). Urban areas have higher proportions of employed adults with below Level 2 qualifications (not shown), no qualifications, and the ‘other’ qualifications group.
Sparsity shows a different pattern. Sparse areas, which contain only 2 per cent of the eligible adults covered by the survey, have below average levels of employed adults with no qualifications or ‘other’ qualifications, like rural areas. Unlike rural areas, however, sparse areas have below average levels of the highest levels of qualifications. This highest level varies by area type from 36 per cent of employed adults in Hamlet and Isolated Dwellings – Less Sparse areas, to half that rate (18 per cent) in Urban – Sparse areas.
The reason for these differences is not clear. Differences might reflect employers requiring different levels of qualifications, differences in access to education, or commuters with high qualifications moving to particular areas (earnings flow analysis in Figures 31 and 32 suggest high earners are commuting between area types). Figure 40 shows the same data for Wales.
Figure 40 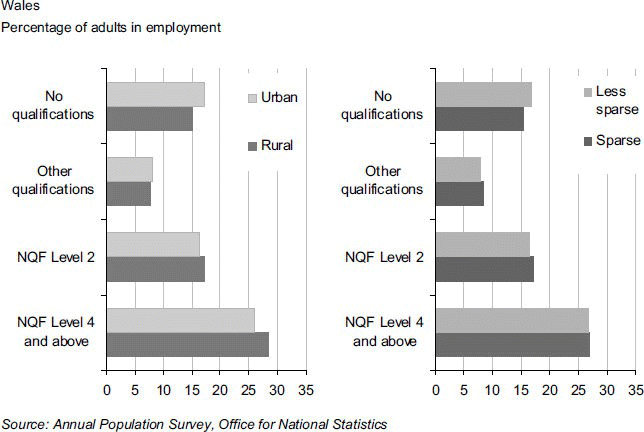
Adult highest qualification levels in Wales: by area group, 2009
The qualifications of employed adults in Wales show little rural/urban variation although, those in rural areas are more likely than average to be qualified to degree level or equivalent (Level 4) and are less likely than average to have no qualifications. Differences between sparse and less sparse areas are very small, however, with no difference between the two groups in the rates of employed adults with the highest level of qualifications.


Health
-
One key indicator of health in an area is life expectancy, which is an estimate of the number of years that a person can expect to live, on average, in a given population. An ONS study (Kyte and Wells, 2010) explored variations in life expectancy at birth between rural and urban areas of England during the period 2001 to 2007. The Rural/Urban Definition and the Index of Multiple Deprivation (IMD) 2007 were used to explore differences between area types, taking levels of deprivation into account.
They found that:
-
people in rural areas lived longer than those in urban areas - an additional 2.1 years for males and 1.4 years for females
-
there was a difference of 7.8 years for males and 5.4 years for females between the most deprived and least deprived fifth of areas, suggesting that pockets of poor health exist across England
-
in the least deprived fifth of areas, urban life expectancies were slightly higher than rural life expectancies for both men and women. However, in the other fifths, life expectancy was lower in urban areas than in rural areas
-
in terms of sparsity, there was little difference in life expectancy between sparse and less sparse areas within the rural and urban area types. However, variations were observed when deprivation was taken into account and greater differences were evident in less sparse areas than in sparse areas
-
figures for local authorities in England show that life expectancy improved in all areas over the 1991-93 to 2006-08 period, by 4.2 years on average for males and 2.9 years for females. However, although variations in life expectancies between regions in England have reduced, differences between the local authorities with the highest and lowest figures widened over this period
-
Physical environment
Carbon Emissions
Carbon dioxide emissions (referred to here simply as ‘carbon emissions’) result predominantly from the combustion of fossil fuels. They can result, for example, from transport, use of buildings, production of food or the manufacturing of goods. In 2008 domestic sources accounted for 30 per cent, and transport for just over 25 per cent of all carbon emissions in the UK. The Land Use, Land Use Change, and Forestry (LULUCF) sector shows positive carbon emissions in some areas; in others the sector acts as a ‘sink’ absorbing carbon dioxide and so emissions are counted as being negative. The final group of sources, Industry and Commercial, accounted for more than 40 per cent of the half a billion tonnes of carbon dioxide emitted in the UK. Figures 41 to 44 show carbon emissions for local authority area types for each UK country, using the locations of end users (so homes using electricity rather than power stations generating it). Are carbon emissions higher per person in urban areas?

Carbon emissions per person in England: by area type, 2008

Carbon emissions per person in Wales: by area type, 2008

Carbon emissions per person in Scotland: by area type, 2008

Carbon emissions per person in Northern Ireland: by area type, 2008
Carbon emissions in England ranged from 6.5 tonnes per person in 2008 in Major Urban local authority areas to 11.6 tonnes per person, per year in Rural-50 areas, compared with an England average of 8.0 tonnes. The four local authorities with very high emissions per person include two Rural-50 local authorities, North Lincolnshire and Wansbeck (north of Tyneside), plus City of London (a Major Urban local authority with far more workers than residents) and Redcar and Cleveland (Large Urban).
Carbon emissions per head from domestic fuel were around 5 per cent below the England average in each type of urban area, but higher in each rural type, especially in Rural-80Footnote 24 where carbon emissions 12 per cent above average might result from older, larger housing stock in poorer condition, or from differences in heating systems. However, Road Transport represents the key rural/urban difference, with carbon emissions ranging from 35 to 47 per cent above the England average in rural areas.
Carbon emissions in Wales averaged 10.8 tonnes per head in 2008, 2 tonnes more than the next highest UK country, Northern Ireland. Industry and Commercial carbon emissions account for the greatest difference between area types in Wales which were as high as 52 tonnes per head in Neath Port Talbot. This resulted in higher total carbon emissions per head in the Other area typeFootnote 25, despite them having average Domestic and Road Transport emissions.
In rural local authority areas Road Transport and Domestic carbon emissions per head were 13 to 14 per cent above average. In Wales, rural domestic fuel consumers do appear to be responsible for somewhat higher carbon emissions than urban ones, a difference which might result from differences in heating systems and the housing stock in each area type.
Carbon emissions in Scotland averaged 7.9 tonnes per person in 2008. In Rural areas carbon emissions for the Domestic sector were almost 10 per cent higher than the average, and a third higher for Road Transport. Rural and Urban differences from Industry and Commercial were small, however it is the LULUCF sector where the largest differences are seen – rural Scotland is effectively absorbing 4 million tonnes of carbon each year because of this sector.
Urban local authorities with notably higher carbon emissions in Scotland in 2008 include Clackmannanshire, East Lothian and Falkirk, each producing between 14 and 20 tonnes per person.
As a nation, Northern Ireland emitted just under 8.9 tonnes of carbon dioxide per person in 2008. There was a clear rural/urban difference: carbon emissions from both Industry and Commercial, and from Road Transport were around 30 per cent above the Northern Ireland average in the less accessible (rural) local authorities, and almost 20 per cent below average in more accessible ones. Domestic carbon emissions, however, were lower in rural areas. Two rural local authorities were responsible for carbon emission levels per person around twice the national average – Fermanagh and Cookstown, while there were four local authorities, all more accessible, with carbon emissions below 7 tonnes per person.
Crime
-
Crime may be seen as a feature of everyday life through media coverage; however, crime is experienced on a personal level much more rarely. Does this vary by area type – is crime an urban phenomenon? Differences in income, population density, transport and housing stock could all potentially result in differences in crime levels between area types.
Local authorityFootnote 26 level data are published for England showing notifiable offences recorded by the police, as opposed to British Crime Survey estimates of the number of crimes experienced. These show that when rural/urban differences in estimated population sizes are taken into account, there are more than three offences recorded by the police per resident in urban areas for every two in rural areas (in 2009/10). This equates to one recorded crime per resident, every 13 years in urban areas, compared with every 21 years in rural areas.
For England as a whole there were 66 crimes recorded per 1,000 residents. This varied substantially by area type, from 39 in the most rural areas (Rural-80) to 79 in the most urban areas (Major Urban). While recorded crime per resident is therefore substantially higher in urban areas, it is something that happens everywhere, and is not simply an ‘urban phenomenon’. Figure 45 shows a selection of specific offences which give a range of patterns by area type.
Figure 45 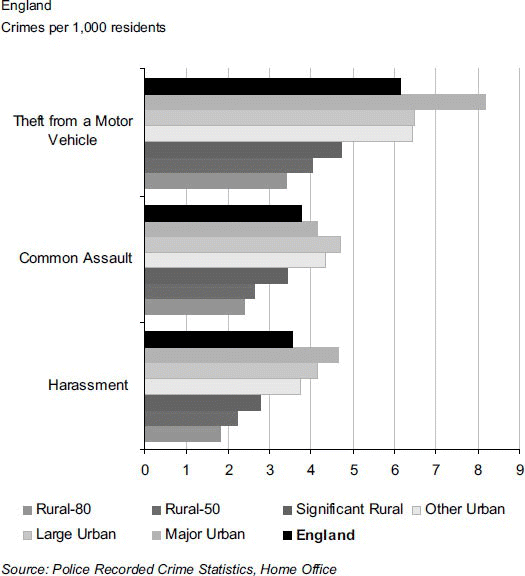
Notifiable offences: by area type, 2009/10
Harassment decreases in similar sized steps, halving from the most urban areas (Major Urban) to the most rural (Rural-80). Theft from a motor vehicle shows similar differences within rural areas, but a much higher level in Major Urban areas than in the other urban area types. However, common assault occurs at a lower rate in Major Urban areas than the other two urban area types. Crime is one subject where it is useful to distinguish different types of urban area, rather than treating them as a homogenous group.

Housing affordability – private sector
-
House prices, and how they change over time, attract much media attention and debate. Comparing local incomes with house prices gives a more balanced picture of whether people can afford to live somewhere. The number of homes being sold and their price (in this case mean average prices from 2009) can be obtained for local authoritiesFootnote 27 in England and Wales from the Land Registry via Communities and Local Government (CLG) or ONS, and used in conjunction with gross annual earnings of full-time workers taken from the Annual Survey of Hours and Earnings (ASHE). It is worth noting that this method is similar to that used by CLG, but has been calculated from mean prices and earnings, rather than medians or lower quartiles. It has fewer similarities to the methods used by mortgage lenders, which take account of purchaser household incomes and deposits.
For England the mean price of all homes sold in 2009 was £216,000. These Land Registry house prices exclude some transaction types, and are not adjusted for the mix of dwelling types. In all three rural area types, the variation from this average was between £2,000 and £3,000; in Major Urban areas the mean price was roughly £40,000 above the national average; in the other two urban area types it was roughly £40,000 below. When area types are grouped, both urban and rural areas have house prices very close to the average. Figure 46 shows housing affordability calculated using mean house prices and mean earnings.
Figure 46 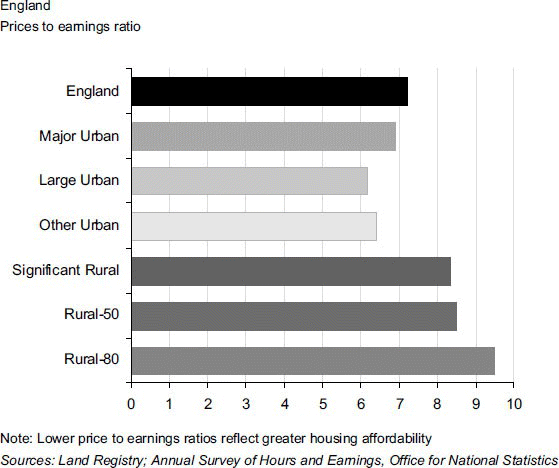
Mean house price affordability, England: by area type, 2009
For England as a whole this particular way of calculating affordability shows that the average home sold in 2009 cost 7.2 times the average salary of full-time workers. Although this measure is not comparable with mortgage multipliers, it seems that no area type in England is particularly affordable by this measure. For rural local authorities the price to earnings ratio ranged from 4.0 in Copeland, Cumbria (Rural-80), to 15.9 in Chiltern, Buckinghamshire (Significant Rural). For urban local authorities it ranged from 3.6, for Kingston upon Hull (Large Urban) to 28.4 in Kensington and Chelsea (Major Urban).
Of the area types, Large Urban areasFootnote 28 have the lowest housing affordability indicator, at 6.2 times the average full-time earnings of people working in those areas. Rural-80 areasFootnote 29, have the highest affordability scores, at 9.5; while Major Urban workers have higher average full-time salaries than workers in rural or the other two urban area types, resulting in affordability close to the national average. Combined, the rural area types have roughly average house prices but lower salaries, and therefore worse affordability (at 8.7). Urban areas combined have average house prices, but great variations by area type, and higher salaries that result in more affordable housing (at 6.6).
Figure 47 compares average earnings with average house price data in the same way for Wales. Compared with the national average of £152,000, homes in the Urban and Rural area types are more expensive (by £10,000 and £14,000 respectively). The Valleys areas have prices that are £42,000 below average, and so the average house price across all urban local authority types is £14,000 below the national average. How does the pattern change when earnings are brought in?
Figure 47 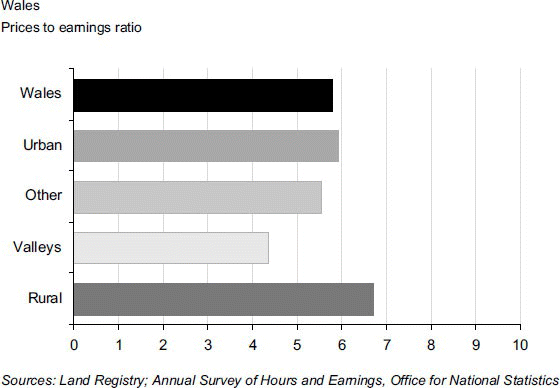
Mean house price affordability, Wales: by area type, 2009
There are substantial differences between affordability ratios for different area types in Wales. Rural local authority areas are the least affordable, with a price to earnings ratio of 6.7; Valleys areas are the most affordable by this method, with a price to earnings ratio of 4.4. Interestingly these differences are similar to the differences in house prices – earnings do not vary dramatically by area type, although Rural areas do show the lowest average earnings as well as the highest average house prices.
In the Rural area type, price to earnings ratios varies from 5.4 in Denbighshire to 8.5 in Monmouthshire. In the urban area types price to earning ratios varied from 3.6 in Blaenau Gwent to 7.0 in the Vale of Glamorgan. This illustrates that there is often as much or more variation in housing affordability within urban or rural areas than there is between them – but that important rural/urban differences still exist.


Affordable public sector housing
-
Social housing, often seen as a basic ‘safety net’ in society, is provided by local authorities and Registered Social Landlords (RSLs), such as housing associations. In 2000/01 just over 1 million households in England were on a social housing waiting list; by 1 April 2009 the level stood at 1.8 million. Just 56,000 additional affordable homes were provided in 2008/09, or one home per 32 households on the waiting list (not accounting for homes sold). It is therefore likely that the rate at which households leave the social housing sector is the key factor in access to an affordable home. While it is not possible to compare turnover of affordable housing by area type, Figure 48 compares the number of households on waiting listsFootnote 30 with the number of existing dwellings in the social rented sector (not including ‘intermediate housing’ schemes such as key worker housing), as at 1 April 2009.
Figure 48 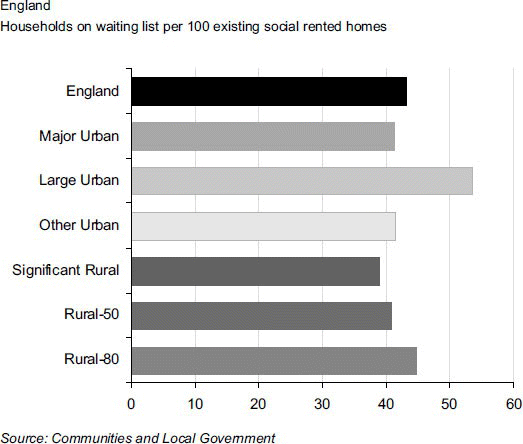
Households on waiting list per 100 existing social rented homes: by area type, 2009
Based on the Rural/Urban local authority classification, for every 100 existing social rented homes in England there are, on average, 43 households on the waiting list. No area type shows a very low ratio – it ranges from 39 in Significant Rural areasFootnote 31 to 54 in Large Urban onesFootnote 32. In general, waiting lists suggest that barriers to accessing social housing are high everywhere but do not show a strong rural/urban pattern, with Large Urban local authorities the only area type to stand out.

Tourism and leisure
-
Tourism is a measure of the attractiveness of urban/rural areas as places to visit. The UK Tourism Survey asks tourists and non-business visitors, normally resident in the UK, about specific trips. Data are presented separately for people saying they visited different area types defined by the respondents themselves. These include: seaside, large city/large town, small town or countryside/village areas. Do we all like to be beside the seaside?
Of the 18 million visits (visits to friends and relatives, as opposed to ‘tourism trips’) in England in 2009, nearly half were to ‘large cities/large towns’ (Figure 49), which is where most people live. Of the 45 million short holiday trips (tourism trips lasting fewer than four days) in England in 2009, around 20 per cent were to the seaside, and 40 per cent to large cities/large towns. For the 22 million holidays lasting four days or longer, this pattern was reversed, with more trips to the seaside. The effect is that nearly as many tourism bed nights are spent at the seaside as in large cities/large towns. The share of tourism trips to both small towns and the countryside was consistent for both long and short-duration trips, and they are somewhat less popular than more urban locations in terms of time spent there.
Figure 49 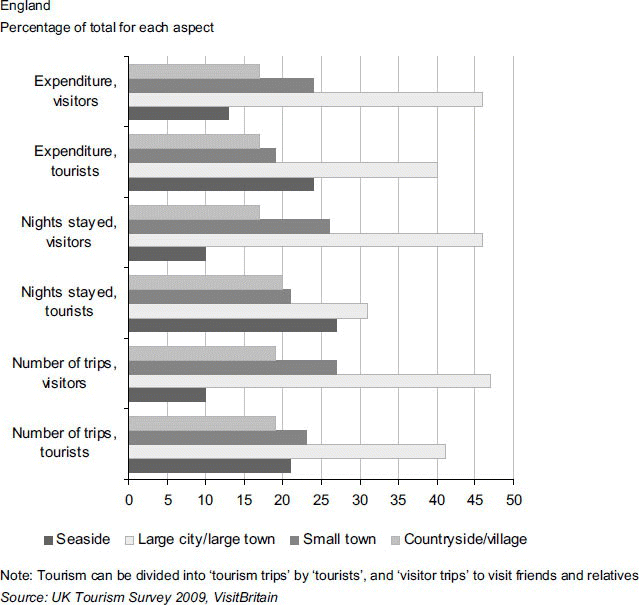
Different aspects of tourism in England: by destination, 2009
All of the measures in Figure 50 show the popularity of the seaside and countryside/villages as tourist destinations in Wales. Of the £1.4 billion spent on visitor and tourist trips in Wales in 2009, more than 40 per cent was spent during trips to the seaside; a similar proportion of the 33 million tourist nights were spent in these areas. The seaside was popular for short trips, at 38 per cent of all short trips, and even more popular for long holidays, with 50 per cent. Overall, the seaside appears to be the key tourist attraction in Wales; although this might involve stays in both rural and urban areas.
Figure 50 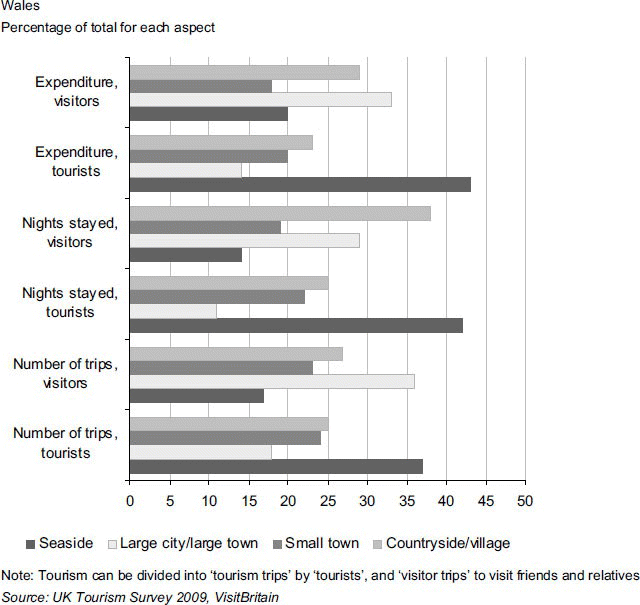
Different aspects of tourism in Wales: by destination, 2009
Large towns and cities were still popular destinations, but only when looking at number of visits, or expenditure on those occasions. However, the number of nights spent visiting friends and relatives in the countryside/villages was notably high, perhaps reflecting the large rural population in Wales.
Figure 51 show that, on all measures, visits to large cities and towns were the most popular choice for tourism trips and visits in Scotland in 2009. Small towns and countryside/village areas had similar proportions of visitor or tourist trips, while the seaside received the fewest visitor or tourist trips.
Figure 51 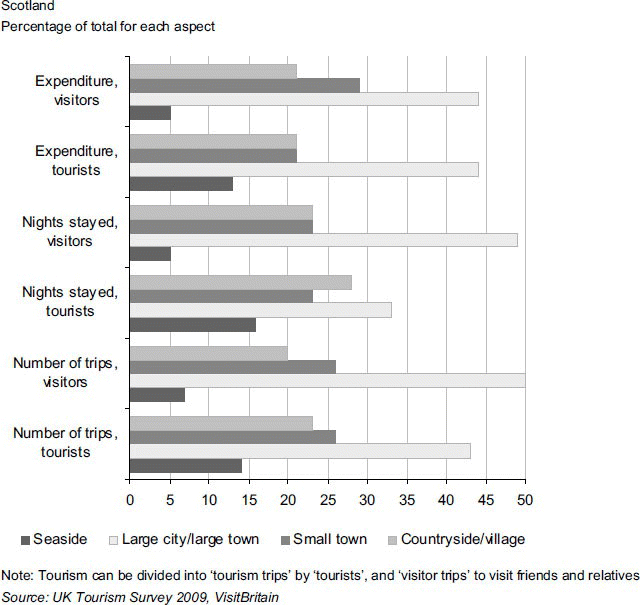
Different aspects of tourism in Scotland: by destination, 2009
For longer holidays, countryside and village locations were the most popular destinations, covering two-fifths of such trips. Long holidays, however, represent less than a third of the total number of trips in Scotland; so overall tourists appear to be more attracted to urban areas than rural ones.
Of the £2.7 billion spent by tourists in Scotland in 2009, 44 per cent was spent in large cities and towns. The total expenditure represents 13 per cent of the total for the whole UK; Scotland has a slightly lower share than this when looking at tourist trips, or tourist nights.


Population and demography
While material on household structures and composition is not readily available for small areas, it is known that some differences exist. The Living Costs and Food Survey estimates that the average urban household in Great Britain had 2.4 people in 2007 to 2009, compared with 2.3 for those in rural areas. This is not a dramatic difference: should populations therefore be expected to be similar as well?
Population structure
England
-
Population pyramids demonstrate the age and gender structure of a population. Figure 52 shows the populations of urban small areas (MSOAs) in England as bars, compared with rural ones, shown as lines.
The English population pyramid for rural areas has a corseted appearance. There are relatively low proportions of people aged 20 to 39 in rural areas, a roughly average proportion aged 40 to 44, and particularly high proportions thereafter, peaking at age 60 to 64.
The higher proportion of people in their late 40s and above-average proportion of children aged 10 to 14 in rural areas may indicate migration to the countryside by parents with school-age children, from either urban areas or abroad. Alternatively, fertility rates may have differed in the past between urban and rural areas and then converged; however migration seems a more plausible driver of this pattern.
In rural areas there are 6 men aged 20 to 24 for every 5 women in that age group. The pattern reverses as age increases so that for 35 to 39-year-olds there are 9 men for every 10 women, but at age 45 to 49 there are approximately equal proportions of men and women in rural areas.
Wales
-
Figure 53 shows the populations of urban small areas in Wales as bars, compared with rural ones, shown as lines.
The Welsh population pyramid for rural areas, like that for England, has a corseted appearance. The rural population is half the size of the urban one but this varies from as little as a third for 20 to 24-year-olds,to two-thirds for 65 to 69-year-olds. Overall, England and Wales show similar patterns with certain age groups being more likely than average to live in rural areas in respect to their population size – 10 to 14-year-olds, and the over-40s, but especially those aged 50 to 74. However, the ‘gender imbalances’ seen in England are not seen in Wales.
Scotland
-
Single-year-of-age data allow the median age for different area types to be estimated, as an overall indicator of differences in population structures. In Scotland urban males are the youngest, with a median age of 37.4; urban females are older, at 40.5. Rural males and females are both somewhat older, and there is less of a gender difference, with median ages of 42.7 for males and 43.9 for females. Figure 54 examines population differences in more detail.
As in England and Wales, rural areas have relatively low proportions in the 20 to 34 age bands. Rural areas have a distinctive ‘middle-aged’ population, with the proportion of the population by age group almost doubling when comparing the 30 to 34 and the 40 to 44 age groups.
There are roughly equal proportions of men and women in rural areas. There are exceptions, however, by age band: for 20 to 24-year-olds there are 6 men for every 5 women, but for the 35 to 39 age group there are 9 men for every 10 women. If migration is causing this, women move earlier than men.
Northern Ireland
-
Figure 55 shows that there are few noticeable differences in the age structure for both males and females between rural and urban areas in Northern Ireland, as defined in the classification of settlements for Output Areas. Both rural and urban areas have young age profiles, with high proportions of residents aged less than 30.
There are some differences. Rural areas have higher proportions of children aged 0 to 14 than urban areas, but lower proportions of adults in their 20s. There are also differences between men and women, with rural areas showing lower proportions of people aged over 45 than urban areas, but for women only.
Population change – migration
-
Together with natural change (births less deaths), migration is a key element of population change, and a topic that receives a large amount of news coverage and interest. There were 5.4 million internal migrants within Great Britain in the year to mid-2009 (in this instance defined as moves between different local authoritiesFootnote 33); an individual moving multiple times over the course of a year would only be counted once to reflect the change in location between the start and end of the period. Some 549,000 international in-migrants came into Great Britain from abroad, and 374,000 international out-migrants left Great Britain. Unfortunately it is not possible to easily link the area type of the start and end point of an internal migration – so figures here show migration to urban local authority areas, for example, but do not show whether those migrants came from other urban or rural local authority areas (subsequently referred to in this section as urban or rural areas).
England
-
Figure 56 compares the proportion of internal and international in- and out-migrants for rural and urban local authorities in England. The pattern of people moving into and out of areas results in population turnover or ‘churn’; although overall population numbers may remain relatively stable, the age structure may change as a result of population turnover.
Figure 56 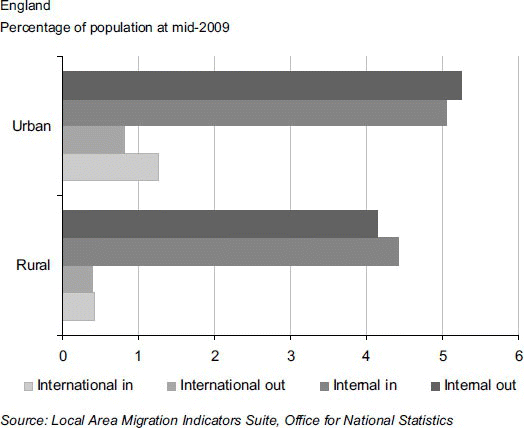
Migration: by type and area type, mid-2008 to mid-2009
At local authority level, internal migration is generally a larger driver of population change than international migration and this is true for both urban and rural areas (as shown in Figure 56). In rural areas there was both net internal and international in-migration (where numbers of internal and international in-migrants exceeded numbers of out-migrants). In rural areas, net internal in-migration (reflecting migration between local authorities in Great Britain) was considerably higher than net international in-migration. A key difference between migration in rural and urban areas is that internal migration results in population gain in rural areas and losses in urban areas, while net international in-migration results in much larger population gains in urban areas than in rural areas, when considered against their respective population sizes.

Wales
-
Net in-migration results in population increases in all area types in Wales. Rural area populations increased a little over the period mid-2008 to mid-2009 as a result of net internal in-migration between local authorities in Great Britain, while population change resulting from international migration was negligible. Urban areas showed growth from migration at almost twice the rural area rate, at 0.22 per cent, with net internal out-migration and net international in-migration from outside Great Britain.
Scotland
-
The urban area local authority population in Scotland grew by 0.40 per cent in between mid-2008 and mid-2009 from net migration (ignoring births and deaths), with a small net internal in-migration (of people within Great Britain). Rural area populations saw small levels of both net internal in-migration and net international in-migration. As with other countries there were far more internal migrants than international – but the 2.1 per cent of residents who had moved into an urban area were largely balanced by the 2.1 per cent of residents moving out of these areas.
Residents’ perception of their area
As previously mentioned the statistical analysis of areas does not always describe the look and feel of a neighbourhood. Key considerations when asking questions about places might be: do people like where they live? Does a particular area type foster wellbeing? The most accurate way to measure this is to ask people directly.
England
-
Responses to the 2008 Place Survey in England, 2008, show the proportions of people answering positively or very positively to questions about their area and home. Figure 57 shows that differences by area type are small, but that some patterns do exist.
Figure 57 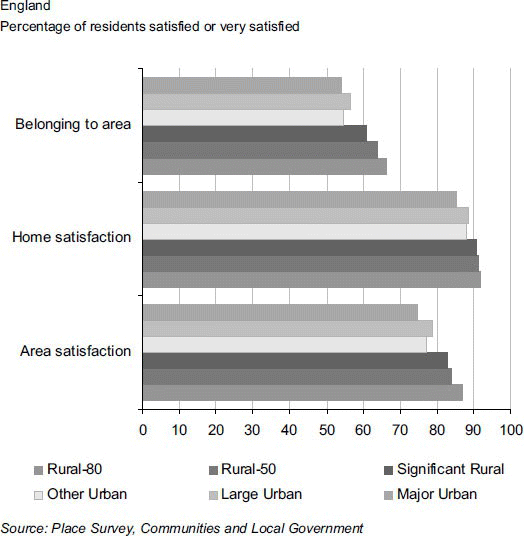
Satisfaction with area in England: by area type, 2008
Based on the Rural/Urban local authority classification, people in rural areas were slightly more likely to feel they belonged to their area, and satisfied with their area and home. Satisfaction was higher in the most rural (Rural-80) areas, and lowest in the most urban (Major Urban). Within urban areas, the Large UrbanFootnote 34 area type showed more positive results than the others. In 30 local authorities 90 per cent or more of their residents were estimated to be satisfied with their area. These are a mixture of all three rural area types, and four Urban area local authorities, comprising three London boroughs, City of London, Richmond upon Thames, and Kensington and Chelsea, and one coastal retirement area (Christchurch, in Dorset).

Scotland
-
Similar questions are asked in Scotland through the Scottish Household SurveyFootnote 35. Figure 58 shows satisfaction using the ‘six-fold’ version of the small area (Data zone) classification. In total some 94 per cent of adults rated their area as being a ‘very good’ or ‘fairly good’ place to live.
Figure 58 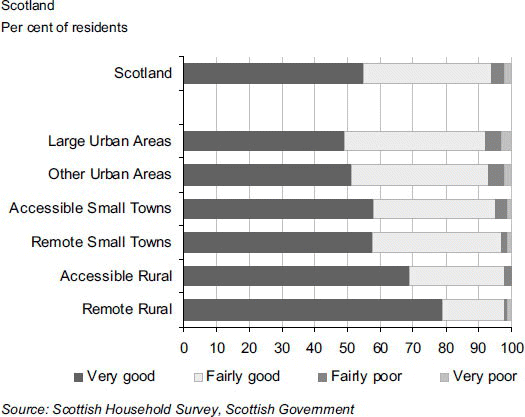
Satisfaction with area in Scotland: by area type, 2009
Satisfaction, or rather rating of the neighbourhood as a good place to live varied little by area type, from 92 per cent in Large Urban to 98 per cent in both types of rural area. No single area type demonstrates widespread dissatisfaction among residents. However, more people in the two types of rural area reported their area to be ‘very good’ than in the four types of urban area.

Conclusion
Four-fifths of the populations of England and Scotland live in urban areas (defined at small area level); roughly two-thirds in Wales and Northern Ireland. Rural/urban classifications also allow differences to be identified between more and less sparse (or remote and accessible) area types. What are the main differences between urban/rural areas and sparse/less sparse areas, and what do they tell us about choice?
In some regards rural areas are clearly different from urban areas:
-
employment rates are higher and unemployment rates lower in the more rural areas of England, Wales and Scotland. In the most rural area types unemployment was as low as half each country’s national average
-
comparing the earnings of an area’s workers to those of its residents shows a net flow of money into all types of rural area in England, Wales and Scotland
-
average house prices are less affordable to local workers in rural areas than in urban areas
-
levels of home working (or working based from home) and self-employment in rural areas in England and Wales are substantially above the national average
-
rural areas of England and Wales have higher proportions of local business units in relation to their total population, even when farming business units are excluded; although rural units are likely to employ fewer people than those in urban areas
-
the industry mix in rural areas includes most of the agricultural units and has relatively low proportions of retail, and finance and insurance local units
-
levels of internet access in each UK country are higher (sometimes only very slightly) in rural areas than urban ones. This suggests that people in rural areas are no longer reliant on physical access to services that tend to be urban, such as banking
-
reported crime levels in urban areas equate to one crime per resident every 13 years; much higher than the rural equivalent of 21 years
-
the populations of rural areas have smaller proportions of young adults and average or above-average levels of middle-aged people, children aged 10 to 14, and, except for females in Scotland and Northern Ireland, people aged 60 and over
Where remoteness or sparsity can be shown, ‘two countrysides’ often emerge: one group of more well-off, better connected areas spread across England and Wales; and one much smaller group of less well-off areas concentrated in a handful of areas in the two countries, and in central Wales in particular.
-
Areas that are rural but less sparse show the highest levels of household income, and the lowest levels of poverty of any area type. Each kind of sparse area, urban or rural, shows much lower levels of income and higher levels of poverty than its less sparse counterpart
-
The levels of people qualified to at least degree level or equivalent, or working in higher managerial or professional occupations, are higher than average in rural areas, but average or below average in sparse areas
Some datasets show substantial differences between and within urban area types:
-
the very small group of Urban - Sparse areas shows the lowest average household income, and the highest level of household poverty
-
looking at local authority areas, the Major Urban area type often shows some distinct characteristics, with, for example, earnings flowing out of these areas at a higher level than for the other two urban area types
-
large variations are seen within urban areas, even within the same area type, for example jobs densities show great variation within London
-
incomes vary dramatically within the heavily populated Urban - Less Sparse areas of England, showing both very high and very low incomes
Some datasets show substantial differences between and within rural area types:
-
rural areas in England have better pre-school and GSCE results than urban ones; however when areas with similar levels of deprivation are compared, differences in the pre-school results, for example, can almost disappear
-
a similar pattern occurs with life expectancies: boys born in rural areas are expected to live 2 years longer than their urban counterparts; girls, 1.4 years. Within the most deprived group of areas, people born in urban areas are actually expected to live longer than those in rural areas, although in less deprived areas the opposite is found
A pattern emerges of interdependence between urban and rural areas:
-
population structures suggest that young adults move out of rural areas to urban ones, and that people in their 40s with older children move in
-
the residents of rural areas earn more than those who work in those areas, showing that rural incomes are at least partially dependent on the ability to commute, especially for full-time workers and for men. Higher transport expenditure accounts for almost half the higher expenditure by rural households than urban ones in Great Britain
Differences in how people say they feel about their area are not dramatic. Surveys in both England and Scotland asking people about their satisfaction with the area where they live show that differences in levels of dissatisfaction are small, although residents in rural areas express higher levels of satisfaction.
In summary, it is difficult with the available data to assess whether rural-urban differences represent genuine free choices in lifestyles, or traps that make it difficult to live how one would like. Some of the findings suggest that certain groups are exercising choice - people in their 40s and those with the means to work in one area type and live in another. Perhaps the more important differences lie within rural and urban areas - between sparse and less sparse rural areas, or particular kinds of urban areas; whether these represent choice is unclear.
Many possibilities exist for further research. Change over time often allows different stories to emergeFootnote 36. Combining urban/rural classifications with other geography products can produce illuminating results. For example, mixing the rural/urban definition for England and Wales with the 2001 Census Output Area ClassificationFootnote 37 gives an ‘urban fringe’ group split across the urban and rural area types (Allen, 2008). Differences can be interpreted in systematic ways, so that different patterns in data can be compared to some extent (Poverty Site, 2009). European comparisons can put issues in a useful context; however with rural/urban analysis this involves either using different classifications or using the Eurostat classification for the comparatively large NUTS 3 areas. When 2011 Census data become available a great many more small area datasets will be publicly available for rural/urban analysis.
Notes
The Commission for Rural Communities (CRC) has commissioned qualitative ‘rural insight’ surveys.
For an example of this classification being used, see ONS’s Population Trends 134, available at: www.statistics.gov.uk/StatBase/Product.asp?vlnk=6303&Pos=1&ColRank=1&Rank=272
More information on the Eurostat ‘urban-rural typology’, which can be used to compare urban and rural regions across different countries, can be found here: http://epp.eurostat.ec.europa.eu/statistics_explained/index.php/Urban-rural_typology
Some 133 ‘Nomenclature of Territorial Units for Statistics level 3’ areas cover the UK, and tend to cover groups of local authorities, resulting in areas such as ‘Lancashire’ in England, and ‘Monmouthshire and Newport’ in Wales.
On 1 April 2009 the reorganisation of some local authorities in England resulted in the creation of nine new unitary authorities, replacing 37 former local authorities (including the Isles of Scilly which is considered as a unitary authority for coding purposes).
The Other Urban area type includes cities (such as Derby), ‘historic’ towns and cities (such as Oxford and Worcester), and towns (such as Hastings and Barrow-in-Furness). For more information see Appendix A or Map 6.
The Urban area type in Wales includes only the most urban local authorities – Cardiff, Swansea and Newport.
These 17 industries are derived from the United Kingdom Standard Industrial Classification of Economic Activities (SIC) 2007. For more information see: www.statistics.gov.uk/statbase/Product.asp?vlnk=14012
The sparse group in both England and Wales is made up of a small proportion of all the rural areas, and an even smaller proportion of all urban areas.
Very remote areas are Data zones mostly located in the Shetland Islands, and in eastern Scotland.
Urban – Sparse areas are a very small group of MSOAs spread across England and Wales, covering settlements such as Berwick-upon-Tweed, Scarborough, Aberystwyth and Carmarthen.
Village, Hamlet and Isolated Dwellings (VHID) areas are the most rural types of LSOA or MSOA for the rural/urban definition for England and Wales – see Classifications section or Appendix A for more details.
Local authority areas after the April 2009 boundary reorganisation are used; the classification for these local authorities uses a slightly different methodology from that used for the pre-2009 boundaries shown in Map 6.
Other areas in Wales includes local authorities in the north such as Wrexham, and local authorities in the south such as Bridgend – see Map 8 for more information.
These are not the same measures as those used to create the ‘remoteness’ aspect of the Scottish Government Urban Rural Classification, which is based on travel time to nearest urban area. Only 5 of the 17 services have travel times above 30 minutes in very remote areas.
Available at: www.dft.gov.uk/pgr/statistics/datatablespublications/ltp/coreaccessindicators2009
For a variety of analyses of access to services for England, see the Commission for Rural Communities’ ‘State of the Countryside 2010’ report: www.defra.gov.uk/crc/documents/state-of-the-countryside-report/
This definition is based on population size of settlements – for both England and Scotland this will define more settlements as urban than the official classifications would. For more information see the ‘technical appendix’ at: http://stakeholders.ofcom.org.uk/market-data-research/media-literacy/medlitpub/medlitpubrss/2010-metrics-bulletin/
For a variety of analyses of access to services for England, see the Commission for Rural Communities’ ‘State of the Countryside 2010’ report: www.defra.gov.uk/crc/documents/state-of-the-countryside-report/
See ‘Indicators of Poverty and Social Exclusion in Rural England, 2009’, the Commission for Rural Communities; available from The Poverty Site: www.poverty.org.uk/reports/rural%202009.pdf
The IDACI shows the proportion of children aged 0 to 15 in an LSOA that live in an income deprived household.
Urban – Sparse areas are a very small group of MSOAs spread across England and Wales, covering settlements such as Berwick-upon-Tweed, Scarborough, Aberystwyth and Carmarthen.
For more information see: www.direct.gov.uk/en/EducationAndLearning/QualificationsExplained/DG_10039017
The Rural-80 area type includes many areas in the South West region – see Map 6 for more information.
Other areas in Wales include local authorities in the north such as Wrexham, and Bridgend in the south – see Map 8 for more information.
Local authority areas after the April 2009 boundary reorganisation are used; the classification for these local authorities uses a slightly different methodology from that used for the pre-2009 boundaries shown in Map 6.
Local authority areas after the April 2009 boundary reorganisation are used; the classification for these authorities uses a slightly different methodology from that used for the pre-2009 boundaries shown in Map 6.
Large Urban Areas include local authorities such as Sheffield, Bournemouth and Coventry. For more
The Rural-80 area type includes many local authorities in the South West region.
Note that this may underestimate the numbers on waiting lists – RSLs sometimes have their own separate lists.
Significant Rural local authorities include for example Guildford, Lancaster, New Forest, and Bedford.
Large Urban local authorities include for example Sheffield, Bournemouth and Coventry.
Local authority areas after the April 2009 boundary reorganisation are used; the classification for these authorities uses a slightly different methodology from that used for the pre-2009 boundaries shown in Map 6.
The Large Urban area type includes local authorities such as Sheffield, Bournemouth and Coventry.
Results are presented on the Scottish Neighbourhood Statistics Website, and in Rural Scotland Key Facts 2010
For example, the Commission for Rural Communities’ ‘State of the Countryside 2010’ presents change over time for some topics. See: www.defra.gov.uk/crc/documents/state-of-the-countryside-report/
For more information see: www.statistics.gov.uk/about/methodology_by_theme/area_classification/
References
Allen P (2008) ‘Comparing area classifications’, Regional Trends 40, pp 21-30, available at: www.statistics.gov.uk/cci/article.asp?ID=1975
Kyte L and Wells C (2010) ‘Variations in life expectancy between rural and urban areas of England, 2001–07, ’ Health Statistics Quarterly 46, pp 27-52, available at: www.statistics.gov.uk/cci/article.asp?ID=2425
Poverty Site (2009) Indicators of poverty and social exclusion in rural England 2009: www.poverty.org.uk/reports/rural%202009.pdf
Scott A, Gilbert A and Gelan A (2007), ‘The Urban-Rural Divide: Myth or Reality’, The Macaulay Land Use Research Institute, available at: www.macaulay.ac.uk/ruralsustainability/RS_applications.php
Author information
Authors and Affiliations
Appendix A: More information on rural/urban classifications
Appendix A: More information on rural/urban classifications
With all rural/urban classifications care needs to be taken to make sure that where data are rates or proportions these are first multiplied by a ‘denominator’ variable (such as estimated population) before being added up, to compensate for different sizes in different areas (Birmingham local authority has a far larger population than Braintree, for example). This article has only aggregated individual areas based on counts. Where a denominator, such as the number of people is not published alongside a rate an external dataset, typically population estimates, has been matched to the same geography before grouping area types.
The Eurostat ‘urban rural typology’, based on a methodology developed by the Organisation for Economic Co-operation and Development (OECD), although not used in this report, can be used to compare urban and rural regions across different countries. More information can be found here: http://epp.eurostat.ec.europa.eu/statistics_explained/index.php/Urban-rural_typology

The Rural/Urban Definition (England and Wales

The Rural/Urban Local Authority Classification (England)


Rights and permissions
About this article
Cite this article
Pateman, T. Rural and urban areas: comparing lives using rural/urban classifications. Reg Trends 43, 11–86 (2011). https://doi.org/10.1057/rt.2011.2
Published:
Issue Date:
DOI: https://doi.org/10.1057/rt.2011.2