


Abstract
Background: Preclinical and observational studies suggest a relationship between dietary fat intake and breast cancer, but the association remains controversial. We carried out a randomized, prospective, multicenter clinical trial to test the effect of a dietary intervention designed to reduce fat intake in women with resected, early-stage breast cancer receiving conventional cancer management. Methods: A total of 2437 women were randomly assigned between February 1994 and January 2001 in a ratio of 40 : 60 to dietary intervention (n = 975) or control (n = 1462) groups. An interim analysis was performed after a median follow-up of 60 months when funding for the intervention ceased. Mean differences between dietary intervention and control groups in nutrient intakes and anthropometric variables were compared with t tests. Relapse-free survival was examined using Kaplan–Meier analysis, stratified log-rank tests, and Cox proportional hazards models. Statistical tests were two-sided. Results: Dietary fat intake was lower in the intervention than in the control group (fat grams/day at 12 months, 33.3 [95% confidence interval {CI} = 32.2 to 34.5] versus 51.3 [95% CI = 50.0 to 52.7], respectively; P <.001), corresponding to a statistically significant ( P = .005), 6-pound lower mean body weight in the intervention group. A total of 277 relapse events (local, regional, distant, or ipsilateral breast cancer recurrence or new contralateral breast cancer) have been reported in 96 of 975 (9.8%) women in the dietary group and 181 of 1462 (12.4%) women in the control group. The hazard ratio of relapse events in the intervention group compared with the control group was 0.76 (95% CI = 0.60 to 0.98, P = .077 for stratified log rank and P = .034 for adjusted Cox model analysis). Exploratory analyses suggested a differential effect of the dietary intervention based on hormonal receptor status. Conclusions: A lifestyle intervention reducing dietary fat intake, with modest influence on body weight, may improve relapse-free survival of breast cancer patients receiving conventional cancer management. Longer, ongoing nonintervention follow-up will address original protocol design plans, which called for 3 years of follow-up after completion of recruitment.
The question of the influence of dietary fat on breast cancer has been controversial. Whereas preclinical and human ecologic studies have suggested an association of higher dietary fat intake with breast cancer risk ( 1 , 2 ) , cohort studies have reported less consistent effects ( 3 – 5 ) . Similarly, observational studies of dietary fat influence on breast cancer recurrence have had mixed results ( 6 , 7 ) , with some suggesting that higher fat intake is associated with higher risk of recurrence, especially in postmenopausal women ( 8 – 10 ) . The varying associations may be due to the modest range of fat intake seen and the difficulty in accurately measuring fat intake with current methods ( 11 , 12 ) .
Feasibility trials have demonstrated that dietary fat reduction can be achieved within the context of standard multimodality breast cancer management ( 13 , 14 ). The Women's Intervention Nutrition Study (WINS) was subsequently designed to test the hypothesis that a dietary intervention targeting fat intake reduction would prolong relapse-free survival in women with resected breast cancer.
P ATIENTS AND M ETHODS
Study Overview
In this phase III multicenter randomized trial, the effect on relapse of a dietary intervention designed to reduce fat intake was compared with that of a control condition with minimal dietary counseling in women with early-stage, resected breast cancer receiving conventional cancer management. Patients in this study were accrued in approximately 7 years, between February 1994 and January 2001. This report represents an interim analysis after a median of 60 months of follow-up. The WINS trial protocol is available online as supplementary data at http://jncicancerspectrum.oxfordjournals.org/jnci/content/vol98/issue24 .
Study Population
Women were recruited from 39 clinical centers. Eligibility criteria included histologically confirmed, resected, unilateral invasive breast carcinoma; lymph node evaluation; age between 48 and 79 years; life expectancy of at least 10 years excluding the cancer diagnosis; acceptable adjuvant systemic therapy (see below); at least 20% of calories obtained from fat; medically able to accept either randomization assignment; and trial entry within 365 days of surgery. Exclusion criteria included inflammatory carcinoma; chest wall or skin involved; tumor size less than 1 cm with negative nodes; tumor size greater than 5 cm with positive nodes; 10 or more nodes positive; preoperative chemotherapy; or any previous neoplasm other than carcinoma in situ of the cervix or basal cell skin carcinoma. Eligibility was confirmed by central review of medical records and pathology reports. The Institutional Review Board of each participating institution approved the study protocol. All patients gave written informed consent.
Standard Breast Cancer Management
Standard breast cancer management was protocol defined, including adequate surgery and radiotherapy. Estrogen receptor (ER) and progesterone receptor (PgR) status (positive or negative) was defined by local laboratory standards. Women with ER-positive tumors received tamoxifen (20 mg per day) for 5 years. Chemotherapy with a protocol-approved regimen (adriamycin plus cyclophosphamide; cyclophosphamide plus methotrexate plus 5-fluorouracil in two schedules; 5-fluorouracil plus adriamycin plus cyclophosphamide in two schedules [5-fluoruracil–adriamycin–cyclophosphamide or cyclophosphamide–adriamycin–fluorouracil]; or adriamycin–cyclophosphamide followed by paclitaxel) was required for women with ER-negative tumors and optional for those with ER-positive tumors. As an eligibility criterion, chemotherapy had to be initiated within 4 months after diagnosis for women given chemotherapy, and tamoxifen had to be initiated within 6 months after diagnosis for those given only tamoxifen. Recommended drug dosages and schedules paralleled those in use by cooperative group trials at the time ( 15 – 17 ).
Randomization
Adaptive randomization was carried out at the Statistical Coordinating Unit of the WINS study using a random stratified permuted block design. The trial was designed with an unbalanced randomization (60% control subjects, 40% dietary intervention subjects) to facilitate resource allocation to the dietary intervention. Women were initially stratified according to lymph node status (negative or positive) and systemic adjuvant therapy received (tamoxifen alone, tamoxifen plus chemotherapy, or chemotherapy alone). An additional stratum for sentinel node evaluation (yes or no) was introduced in 1999 to reflect clinical practice trends.
Dietary Intervention and Study Assessments
The goal of the dietary intervention was to reduce percentage of calories from fat to 15% while maintaining nutritional adequacy. Feasibility studies had indicated that this goal would result in a sustained reduction in fat intake to approximately 20% of calories ( 14 ) , which was the basis for the sample size calculation. Women in the dietary intervention group were given an individual fat gram goal and counseled by registered dieticians who implemented a previously developed low-fat eating plan ( 14 – 18 ) . Study dieticians were trained centrally on diet intervention and dietary and anthropometric data collection. Training continued with annual workshops incorporating training on motivational interviewing and with monthly conference calls.
The low-fat eating plan, which was based on nutritional and behavioral science principles ( 18 ) , incorporated social cognitive theory and included self-monitoring (fat gram counting and recording), goal setting, modeling, social support, and relapse prevention and management. Individual fat gram goals were based on energy intake needed to maintain weight, and no counseling on weight reduction was provided. The low-fat eating plan was initiated during eight biweekly individual, in-person counseling sessions, each lasting approximately 1 hour. Subsequent dietician contacts (visits or calls) occurred every 3 months, with available, optional monthly dietary group sessions. Women in the dietary intervention group were instructed to keep a written record of their fat gram intake daily throughout the trial using a previously developed “keeping score” book ( 18 ) . Control subjects had one baseline dietician visit and contacts with a dietician every 3 months subsequently. They received written information on general dietary guidelines and were counseled on nutritional adequacy for vitamin and mineral intake only.
Questionnaires administered at baseline were used to collect information on demographic characteristics; medical, reproductive, and family history; personal habits such as smoking and alcohol use; prior use of menopausal hormone therapy and oral contraceptives; and current use of medications and dietary supplements. Weight and height were measured at baseline and annually using standardized techniques on calibrated scales/stadiometer ( 19 ) . Body mass index (BMI) was calculated as weight (in kilograms) divided by height (in meters) squared.
Unannounced telephone calls were used to estimate dietary intakes. Trained interviewers who were blinded to randomization status collected dietary information; the information was entered into the Nutrition Data System for Research interactive software as previously described ( 18 ) . A multilayered quality control process was used to maintain nutrition data quality ( 20 ) . Data on dietary intakes from three follow-up calls (including one on a weekend day) were collected over 2 weeks for eligibility determination regarding dietary fat intake. Two additional follow-up calls (including one on a weekend day) were made annually to collect updated data on dietary intakes for all women.
Recurrence information was solicited during the every-3-month dietician contacts. Recurrences were confirmed initially by medical record and pathology report review by the clinical director (RTC) and subsequently by the WINS Pathology Committee, both of whom were blinded to random assignment.
Outcome Definitions
The primary study endpoint was relapse-free survival, defined as the time from random assignment to breast cancer recurrence at any site. Relapse events included local, regional, and distant recurrence; ipsilateral breast recurrence after lumpectomy; and contralateral breast cancer. Overall survival, defined as the time from randomization to death from any cause, was a secondary endpoint. For comparability to other adjuvant trials ( 15 , 21 – 24 ) , disease-free survival and recurrence-free survival were also examined. Disease-free survival events included any secondary invasive cancers, excluding basal and squamous skin cancers, and death without breast cancer recurrence. Recurrence-free survival events included local, regional, distant, or ipsilateral breast recurrence after lumpectomy but excluded contralateral breast cancer. Breast cancer size and nodal status were used to calculate tumor size–node–metastasis stage ( 25 ) at baseline.
Termination of the Dietary Intervention
WINS was supported by a multicenter RO1 grant from the National Cancer Institute, with continued funding dependent on ongoing peer review. Funding for the clinical centers and the active dietary intervention ended in May 2004, even though the protocol-defined follow-up period had not been completed and even though secular trends in therapy had reduced recurrence events compared with the number of events projected at the time the study was designed. The WINS External Advisory Committee reviewed results of the last (November 2003) interim analysis (which incorporated nutrient data through August 31, 2003, and all available efficacy data through October 31, 2003), after a median follow-up of 60 months. Based on the change in trial status, both the WINS External Advisory Committee and the WINS Executive Committee supported reporting the available results but recognized the need for additional follow-up. These results were presented at the American Society of Clinical Oncology annual meeting ( 26 ) on May 17, 2005, and were provided to study participants by mail. This interim efficacy report provides details of that dataset. The protocol design called for 3 years of follow-up after completion of recruitment through January 2004. Currently ongoing nonintervention follow-up will address the original design plans.
Statistical Analysis
Sample size was based on a model that generated power estimates via simulation. Using published information from cooperative group trials involving tamoxifen ( 27 , 28 ), we calculated a total sample size of 2502 under assumptions of 6 years of accrual, 3 years of follow-up after completion of accrual, and a 7.5% increase in relapse-free survival with a drop-in (defined as control group women with intake <20% of calories from fat at any interval while on study) rate of 10% and a drop-out rate of 30% for 84% power at a two-sided alpha level of .05.
The primary efficacy analysis was a stratified log-rank test. Exploratory Cox proportional hazards models for relapse-free survival were investigated, as were various Cox models for prognostic factors in addition to those used in the stratified randomization. The final Cox model included randomized group, stratification factors (ER status [positive versus negative] and tumor size [<2 versus ≥2 cm]), and surgery type (mastectomy versus lumpectomy) based on their established influences on breast cancer outcomes. The cumulative incidence method was applied for Cox model analyses. Model assessment suggested a reasonable data fit. The assumption of proportionality for Cox models was verified by graphical and numerical methods of Lin et al. ( 29 ) . The P value for the Kolmogorov-type supremum test (for group) based on 1000 simulations was 0.5170, supporting the proportional hazards assumptions.
Analyses included all randomly assigned patients, following the intent-to-treat paradigm. All P values were derived from a two-sided test for significance. The 95% confidence interval (CI) for the hazard ratio (HR) was obtained for each term in the final Cox model, with particular attention to the interaction between treatment and other factors in the model. The P values and confidence intervals are exploratory. Five protocol-planned interim analyses were carried out between February 2000 and November 2003. The Haybitle–Peto approach to the α-spending function was used to account for interim analyses ( 30 ) . The Kaplan–Meier method was used to calculate probability estimates for relapse-free and overall survival. In exploratory analyses, which were not defined prospectively, dietary effects on relapse-free survival in subgroups based on BMI, hormone receptor status, and nodal status were examined using the Cox model. Tests for interaction used Cox models and a likelihood ratio test. Differences in baseline variables between and within groups were analyzed using t tests or paired t tests or the appropriate tests with categorical variables. The t tests were performed to compare differences in the nutrient intakes and anthropometric variables, and corresponding 95% confidence intervals are reported.
R ESULTS
A total of 2437 apparently eligible women were randomly assigned, 975 to the dietary intervention group and 1462 to the control group ( Fig. 1 ). Thirty-four women (12 in the dietary group and 22 in the control group) were subsequently found to be ineligible, most commonly based on a longer interval from diagnosis and/or use of other chemotherapy (n = 10), pagetoid nipple involvement (n = 9), or size or margin issues (n = 5). However, all randomly assigned patients are included in the presented analyses.
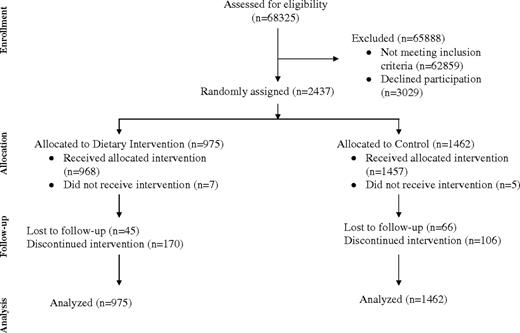
CONSORT trial flow diagram. Detailed reasons for not completing study were as follows. Not receiving intervention, intervention group: lost interest in study (n = 4), personal–family problem (n = 2), did not like low-fat eating plan (n = 1). Not receiving intervention, control group: lost interest in study (n = 2), did not like control group allocation (n = 3). Lost to follow-up, intervention group: unable to contact participant (n = 24), not interested in study (n = 3), personal–family problem (n = 2), did not like low-fat eating plan (n = 3), medical problem (n = 3), time commitment (n = 2), 5 years was enough (n = 2), moved (n = 1), refused to be contacted (n = 4), unknown (n = 1). Lost to follow-up, control group: unable to contact participant (n = 39), not interested in study (n = 5), personal–family problem (n = 2), did not like control group (n = 2), medical problem (n = 2), time commitment (n = 2), 5 years was enough (n = 2), moved (n = 2), refused to be contacted (n = 6), unknown (n = 4). Discontinued study, intervention group: unable to contact the participant (n = 49), not interested in study (n = 15), personal–family problem (n = 26), did not like low-fat eating plan (n = 21), medical problem (n = 12), time commitment (n = 10), 5 years was enough (n = 23), moved (n = 7), refused to be contacted (n = 3), unknown (n = 4). Discontinued study, control group: unable to contact the participant (n = 51), not interested in study (n = 7), personal–family problem (n = 6), did not like control group (n = 1), medical problem (n = 3), time commitment (n = 5), 5 years was enough (n = 15), moved (n = 3), refused to be contacted (n = 8), unknown (n = 7).
The characteristics of the participants were well balanced across the two groups ( Table 1 ). The characteristics of the breast cancers of study participants and the therapy given for these cancers by treatment group are provided in Table 2 . Breast cancer characteristics were closely comparable in the two groups. Breast cancer therapy was also closely comparable in the two groups, except for the type of primary surgery. More women in the dietary intervention compared to control group had mastectomy rather than breast-conserving therapy ( P = .004).
Characteristics of participants at baseline by intervention group *
| Characteristic | Dietary intervention (N = 975) | Control (N = 1462) |
|---|---|---|
| Age (y), mean (95% CI) | 58.6 (44.4 to 72.8) | 58.5 (43.6 to 73.4) |
| Race or ethnic group, No. (%) | ||
| White | 826 (84.7) | 1235 (84.5) |
| Black | 52 (5.3) | 75 (5.1) |
| Hispanics | 37 (3.8) | 58 (4.0) |
| Asian or Pacific Islander | 58 (4.0) | 86 (5.9) |
| American Indian | 1 (0.1) | 2 (0.1) |
| Unknown | 1 (0.1) | 6 (0.3) |
| Education, No. (%) | ||
| Less than high school | 21 (2.6) | 39 (2.7) |
| More than high school | 326 (33.6) | 452 (31.0) |
| College degree | 232 (23.9) | 394 (27.1) |
| Graduate school | 236 (24.4) | 334 (23.0) |
| Unknown | 160 | 243 |
| Current alcohol use, No. (%) | ||
| None | 292 (30.1) | 452 (31.1) |
| Some | 677 (69.9) | 1002 (68.9) |
| Unknown | 6 | 8 |
| Smoking status, No. (%) | ||
| Never | 483 (49.9) | 708 (48.7) |
| Past | 428 (44.2) | 641 (44.1) |
| Current | 57 (5.9) | 105 (7.2) |
| Unknown | 7 | 8 |
| BMI (kg/m 2 ), No. (%) | ||
| <26 | 440 (46.0) | 664 (46.6) |
| 26–29 | 256 (26.8) | 383 (26.9) |
| ≥30 | 261 (27.3) | 377 (26.5) |
| Unknown | 18 | 38 |
| Waist circumference (cm) | 1 | |
| Mean (SD) | 87.36 (14.2) | 87.12 (14.0) |
| ≤88, no. (%) | 562 (59.7) | 819 (57.9) |
| >88, No. (%) | 379 (40.3) | 596 (42.1) |
| Unknown | 34 | 47 |
| Diabetes, No. (%) | ||
| Yes | 28 (5.4) | 40 (4.8) |
| No | 512 (94.6) | 787 (95.2) |
| Unknown | 435 | 635 |
| Daily dietary intake † | ||
| Kcal, mean (SD) | 1667.3 (500.6) | 1659 (417.0) |
| Fat (g/d), mean (SD) | 57.62 (24.4) | 56.33 (23.2) |
| Fat, % of caloric intake (SD) | 29.61 (7.1) | 29.60 (6.7) |
| First degree family history of breast cancer, No. (%) | ||
| No | 722 (74.2) | 1083 (74.2) |
| Yes | 251 (25.8) | 377 (25.8) |
| Unknown | 2 | 2 |
| Prior bilateral oophorectomy, No. (%) | 963 | 1447 |
| Yes | 153 (15.9) | 208 (14.4) |
| No | 801 (83.1) | 1229 (84.9) |
| Unknown | 21 | 25 |
| Prior menopausal hormone therapy, No. (%) | 969 | 1455 |
| None | 332 (34.3) | 516 (35.5) |
| Yes | 633 (65.3) | 931 (64.0) |
| Unknown | 10 | 15 |
With the exception of the race or ethnic group category, percentages are given relative to participants with known values for each characteristic. Differences in baseline variables between groups were analyzed using t tests, paired t tests, or the appropriate tests with categorical variables. None of the comparisons between intervention groups were statistically significant at the two-sided P <.05 level. CI = confidence interval; BMI = body mass index; SD = standard deviation.
Information on dietary intake was available for all 975 intervention group participants and 1461 control women.
Characteristics of breast cancers and breast cancer therapy by intervention group *
| Characteristic | Dietary intervention (N = 975) | Control (N = 1462) |
|---|---|---|
| Histologic type, No. (%) | ||
| Infiltrating ductal (only) | 842 (86.4) | 1277 (87.4) |
| Infiltrating lobular (+/− other) | 98 (10.1) | 125 (8.6) |
| Other | 35 (3.6) | 60 (4.0) |
| Tumor size (cm) | ||
| Mean (SD) | 1.93 (0.9) | 1.89 (0.9) |
| <0.5, No. (%) | 2 (0.2) | 7 (0.5) |
| >0.5–1, No. (%) | 108 (11.1) | 153 (10.5) |
| >1–2, No. (%) | 573 (58.8) | 871 (59.6) |
| >2–5, No. (%) | 284 (29.1) | 422 (28.9) |
| >5, No. (%) | 8 (0.8) | 9 (0.6) |
| Nodal Status | ||
| Mean No. positive (SD) | 2.02 (1.5) | 2.02 (1.6) |
| Negative, No. (%) | 708 (73.1) | 1060 (72.9) |
| 1–3 positive nodes, No. (%) | 230 (23.8) | 338 (23.3) |
| >3 positive nodes, No. (%) | 30 (3.1) | 56 (3.8) |
| Unknown | 7 | 8 |
| Stage | ||
| I | 531 (54.5) | 797 (54.5) |
| II A | 312 (32.0) | 467 (31.9) |
| II B | 102 (10.5) | 140 (9.6) |
| III A | 30 (3.1) | 58 (4.0) |
| ER status, No. (%) | ||
| Positive | 770 (79.0) | 1189 (81.3) |
| Negative | 205 (21.0) | 273 (18.7) |
| PgR status, No. (%) | ||
| Positive | 641 (69.6) | 960 (69.4) |
| Negative | 268 (29.1) | 414 (29.9) |
| Borderline | 12 (1.3) | 9 (0.7) |
| Unknown | 54 | 79 |
| Type of surgery, No. (%) | ||
| Mastectomy | 343 (35.5) † | 434 (29.9) |
| Breast conserving | 624 (64.5) | 1018 (70.1) |
| Unknown | 8 | 10 |
| Radiation therapy, No. (%) | ||
| Yes | 659 (68.7) | 1019 (70.5) |
| No | 300 (31.3) | 427 (29.5) |
| Unknown | 16 | 16 |
| Type of nodal evaluation, No. (%) | ||
| Axillary dissection/sampling, No. (%) | 918 (94.8) | 1361 (93.6) |
| Sentinel node procedure, No. (%) | 50 (5.2) | 93 (6.4) |
| No lymph node dissection | 7 | 8 |
| Systemic therapy, No. (%) | ||
| Tamoxifen alone | 465 (47.7) | 693 (47.4) |
| Tamoxifen plus chemotherapy | 375 (38.5) | 555 (38.0) |
| Chemotherapy alone | 135 (13.9) | 214 (14.6) |
| Chemotherapy regimens, No. (%) ‡ | 505 | 763 |
| Adriamycin–cyclophosphamide, No. (%) | 169 (33.5) | 243 (31.9) |
| Cyclophosphamide–methotrexate–5-fluorouracil | 269 (53.5) | 410 (53.7) |
| 5-Fluorouracil–adriamycin–cyclophosphamide/cyclophosphamide–adriamycin–5-fluorouracil | 35 (7.0) | 53 (7.0) |
| Adriamycin–cyclophosphamide → paclitaxel | 32 (6.3) | 57 (7.5) |
Percentages are given relative to participants with known values for each characteristic. Differences in breast cancer characteristics and breast cancer therapy were analyzed using t tests, paired t tests, or the appropriate test with categorical variables. All P values were two-sided. ER = estrogen receptor; PgR = progesterone receptor; SD = standard deviation.
Statistically significant difference in the frequency of mastectomy versus breast-conserving surgery in dietary intervention versus control subjects, P = .004.
Data on chemotherapy regimens were available for 505 of the 510 women in the dietary intervention group who had chemotherapy and 763 of the 769 women in the control group who had chemotherapy.
As of October 31, 2003, 95% of the women in the dietary intervention group and 94% of those in the control group were being followed as part of the study or had experienced a study event, with 84% of women in the dietary intervention group and 89% of those in the control group contacted within 12 months of October 31, 2003 ( Fig. 1 ). The median interval between last contact and the analysis closeout date was 2.6 months for women in the dietary intervention group and 3.1 months for those in the control group.
Adherence to Dietary Intervention
The dietary intervention adherence results are based on telephone follow-up calls. The reported dietary intake differences by randomization group over time are outlined in Table 3 . In all, 80% of women provided dietary data for at least three time periods after baseline. After 1 year, mean daily fat gram intake was slightly reduced in the control group (from 56.3 g at baseline to 51.3 g at 12 months, mean difference = −5.09 g, 95% CI = −6.5 to −3.7, P <.0001) but was reduced to a statistically significantly greater extent in the dietary intervention group (from 57.3 g at baseline to 33.3 g at 12 months, mean difference = −24.4 g, 95% CI = −26.1 to −22.6, P <.0001; P <.001 comparing the mean difference between groups). The difference in fat gram intake was maintained through 5 years (difference in fat grams per day in dietary versus control groups of −18.0 g [95% CI = −19.9 to −16.1] at 12 months and −19.0 g [95% CI = −22.1 to −16.0] at 60 months [both P <.0001]). Similar differences were seen for all fat categories and in percentage of calories from fat ( Table 3 ). In addition, energy intake was somewhat lower and fiber intake slightly higher in intervention group participants ( Table 3 ). Nutrient adequacy was maintained in both groups, with the exception of calcium, vitamin D, and vitamin E, for which intakes were somewhat below recommended levels at baseline and throughout the trial in both groups, a situation that was addressed with counseling and supplement use. No adverse events were associated with the dietary intervention.
Mean values (with 95% confidence intervals) of nutrient intakes and anthropometric data at baseline and subsequently, by intervention group *
| Baseline | At year 1 | Dietary intervention minus control at year 1 | Dietary intervention minus control at year 3 | Dietary intervention minus control at year 5 | |||||
|---|---|---|---|---|---|---|---|---|---|
| Variable | Dietary intervention | Control | Dietary intervention | Control | |||||
| Daily dietary intake † | |||||||||
| Total fat (g) | 57.3 (55.7 to 58.8) | 56.3 (55.1 to 57.5) | 33.3 (32.2 to 34.5) | 51.3 (50.0 to 52.7) | −18.0 (−19.9 to −16.1), P <.0001 | −19.7 (−21.9 to −17.5), <.0001 | −19.0 (−22.1 to −16.0), P <.0001 | ||
| Fat (% of calories) | 29.6 (29.2 to 30.1) | 29.6 (29.3 to 29.9) | 20.3 (19.8 to 20.9) | 29.2 (28.8 to 29.6) | −8.9 (−9.6 to −8.2), P <.0001 | −9.0 (−9.8 to −8.1), P <.0001 | −8.0 (−9.1 to −6.9), P <.0001 | ||
| Saturated fat (g) | 18.7 (18.1 to 19.3) | 18.5 (18.1 to 19.0) | 10.4 (10.0 to 10.9) | 16.6 (16.1 to 17.1) | −6.2 (−6.9 to −5.5), P <.0001 | −6.7 (−7.5 to −5.9), P <.0001 | −6.6 (−7.8 to −5.5), P <.0001 | ||
| Polyunsaturated fat (g) | 12.2 (11.8 to 12.5) | 11.9 (11.6 to 12.2) | 7.3 (7.0 to 7.6) | 10.8 (10.4 to 11.1) | −3.5 (−3.9 to −3.0), P <.0001 | −3.9 (−4.4 to −3.7), P <.0001 | −3.7 (−4.4 to −2.9), P <.0001 | ||
| Monounsaturated fat (g) | 21.6 (21.0 to 22.3) | 21.3 (20.8 to 21.8) | 12.3 (11.8 to 12.7) | 19.6 (19.1 to 20.2) | −7.3 (−8.2 to −6.6), P <.0001 | −7.9 (−8.8 to −7.0), P <.0001 | −7.6 (−8.8 to −6.3), P <.0001 | ||
| Energy (kcal) | 1687 (1656 to 1719) | 1660 (1635 to 1684) | 1460 (1433 to 1487) | 1531 (1506 to 1556) | −71 (−1.9 to −33), P = .0002 | −142 (−184 to −100), P <.0001 | −167 (−223 to −111), P <.0001 | ||
| Fiber (g/d) | 18.4 (18.0 to 18.9) | 18.0 (17.6 to 18.3) | 19.5 (18.9 to 20.1) | 17.3 (16.9 to 17.7) | 2.2 (1.6 to 2.9), P <.0001 | 1.2 (0.4 to 2.0), P = .0035 | 2.4 (0.4 to 2.4), P = .0045 | ||
| Anthropomorphic factors | |||||||||
| BMI (kg/m 2 ) ‡ | 27.6 (27.2 to 28.0) | 27.5 (27.2 to 27.8) | 26.8 (26.4 to 27.2) | 27.6 (27.3 to 27.9) | −0.8 (−1.3 to −0.3) | −0.77 (−1.3 to −0.2) | −1.1 (−1.9 to −0.4) | ||
| Weight (kg) § | 72.7 (71.7 to 73.7) | 72.6 (71.8 to 73.4) | 70.6 (69.6 to 71.6) | 72.8 (72.0 to 73.7) | −2.3 (−3.6 to −1.0) | −1.8 (−3.1 to −0.2) | −2.7 (−4.5 to −0.9) | ||
BMI = body mass index. Differences in breast cancer characteristics and breast cancer therapy were analyzed using t tests, paired t tests, or the appropriate test with categorical variables. All statistical tests were two-sided.
Information on dietary intake was available for 975 and 1461 of women in the dietary intervention group and the control group, respectively, at baseline; for 840 and 1328 women, respectively, at year 1; for 654 and 1077 women, respectively, at year 3; and for 380 and 648 women, respectively, at year 5.
Information on BMI was available for 957 and 1424 of women in the dietary intervention group and the control group, respectively, at baseline; for 755 and 1230 women, respectively, at year 1; for 600 and 981 women, respectively, at year 3; and for 313 and 534 women, respectively, at year 5.
Information on weight was available for all 975 and 1462 women in the dietary intervention group and the control group, respectively, at baseline; for 854 and 1310 women, respectively, at year 1; for 698 and 1044 women, respectively, at year 3; and for 386 and 998 women, respectively, at year 5.
Body weight was not an intervention target. However, there was a modest but statistically significant ( P = .005) weight difference of about 6 pounds between groups, with dietary intervention women weighing less through 5 years of observation. Changes in BMI in both groups reflect the weight changes observed ( Table 3 ).
Efficacy
After a median of 60 months, 277 relapse-free survival events and 389 disease-free survival events were reported ( Table 4 ). Recurrence events were confirmed by central review in 99.5% of cases. For relapse-free survival—the primary endpoint—the hazard ratio of an event in the dietary intervention compared with the control group was 0.76 (95% CI = 0.60 to 0.98) ( Fig. 2 , P = .077 for stratified log rank and P = .034 for adjusted Cox model analysis). For recurrence-free survival (i.e., excluding contralateral breast cancers), the HR was 0.71 (95% CI = 0.53 to 0.94; stratified log rank P = .050). For disease-free survival, the HR was 0.81 (95% CI = 0.65 to 0.99; stratified log rank P = .078). There was no difference in overall survival comparing women receiving the dietary intervention with control group women (HR = 0.89; 95% CI = 0.65 to 1.21; stratified log rank P = .56). Based on the effects on the primary endpoint, 38 women would need to adopt a lifestyle intervention reducing dietary fat intake to prevent one additional breast cancer recurrence.
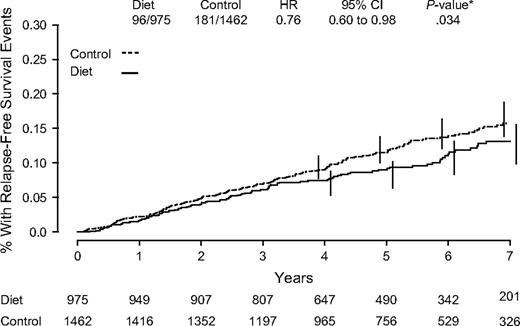
Kaplan–Meier estimates of relapse-free survival. Number of events/number of patients in the dietary intervention and control groups are indicated. Hazard ratio (HR) and 95% confidence interval (CI) were calculated from adjusted Cox proportional hazard model comparisons of control to dietary intervention groups through the 60-month median follow-up period. P value is two-sided. Numbers of patients at risk are indicated below the graph.
Endpoints, including breast cancer recurrences, by intervention group
| Events | Dietary intervention (n = 975) | Control (n = 1462) |
|---|---|---|
| Recurrence | ||
| Local recurrence, No. (%) | 3 (0.3) | 8 (0.6) |
| Regional recurrence, No. (%) | 6 (0.6) | 12 (0.8) |
| Distant recurrence (except opposite breast), No. (%) | 52 (5.3) | 93 (6.4) |
| Ipsilateral breast recurrence in patients with lumpectomy, No. (%) | 11 (1.1) | 31 (2.1) |
| New breast cancer in the contralateral breast, No. (%) | 24 (2.5) | 37 (2.5) |
| Relapse-free survival events, total No. (%) * | 96 (9.8) | 181 (12.4) |
| Second primary cancer (excludes opposite breast cancer), No. (%) | 28 (2.9) | 50 (3.4) |
| Death (without breast cancer recurrence), No. (%) | 15 (1.5) | 19 (1.3) |
| Disease-free survival events, total No. (%) † | 139 (14.3) | 250 (17.1) |
Relapse-free survival events include local, regional, and distant recurrence, ipsilateral breast recurrence after lumpectomy, and contralateral breast cancer.
Disease-free survival events include those for relapse-free survival and also include any secondary invasive cancer, excluding basal and squamous skin cancer, and death without breast cancer recurrence.
Dietary intervention effects were examined based on BMI, hormone receptor, and nodal status in subgroup analyses by using adjusted Cox model. A total of eight subgroup analyses were performed, and none of the interactions tested were statistically significant. However, the dietary intervention had a greater effect on relapse-free survival in women with ER-negative cancer (HR = 0.58; 95% CI = 0.37 to 0.91) than in women with ER-positive disease (HR = 0.85; 95% CI = 0.63 to 1.14); interaction test, P = .15 ( Fig. 3 ). Findings by PgR status were similar ( Table 5 ).
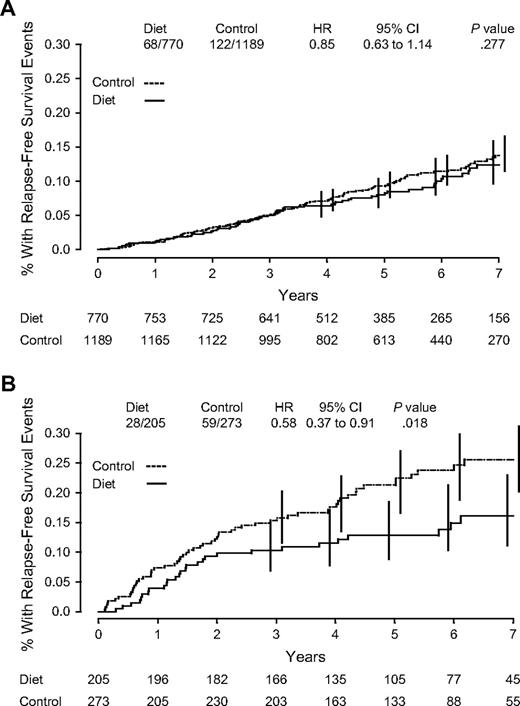
Kaplan–Meier estimates of relapse-free survival. ( A ) Estrogen receptor–positive subjects. ( B ) estrogen receptor–negative subjects. Number of events/number of patients in the dietary intervention and control groups are indicated. Hazard ratios (HRs) and 95% confidence intervals (CIs) were calculated from adjusted Cox proportional hazard model comparisons of control to dietary intervention groups through the 60-month median follow-up period. P values are two-sided. Numbers of patients at risk are indicated below the graph.
Relapse-free survival, by baseline characteristics and intervention group *
| Relapse events/total N | ||||
|---|---|---|---|---|
| Variable | Dietary intervention | Control | HR (95% CI) | |
| BMI † | ||||
| <25 | 33/371 | 55/563 | 0.83 (0.54 to 1.27) | |
| 25–30 | 33/325 | 62/484 | 0.77 (0.51 to 1.18) | |
| >30 | 29/261 | 61/377 | 0.66 (0.42 to 1.04) | |
| Axillary lymph nodes ‡ | ||||
| Positive | 40/258 | 72/392 | 0.83 (0.57 to 1.21) | |
| Negative | 56/710 | 109/1062 | 0.77 (0.56 to 1.07) | |
| ER § | ||||
| Positive | 68/770 | 122/1189 | 0.85 (0.63 to 1.14) | |
| Negative | 28/205 | 59/273 | 0.58 (0.37 to 0.91) | |
| PgR ‖ | ||||
| Positive | 55/641 | 97/960 | 0.83 (0.59 to 1.15) | |
| Negative | 28/268 | 75/414 | 0.54 (0.35 to 0.83) | |
| Receptor subgroups ‖ | ||||
| ER+, PgR+ | 49/598 | 90/921 | 0.83 (0.58 to 1.17) | |
| ER+, PgR− | 12/121 | 27/199 | 0.73 (0.37 to 1.46) | |
| ER−, PgR+ | 6/43 | 7/39 | 0.57 (0.17 to 1.87) | |
| ER−, PgR− | 16/147 | 48/215 | 0.44 (0.25 to 0.77) | |
HR = hazard ratio; CI = confidence interval; BMI = body mass index; ER = estrogen receptor; PgR = progesterone receptor.
BMI = weight in kg/(height in m) 2 . Adjusted for nodal status (positive or negative), systemic adjuvant therapy (chemotherapy alone, tamoxifen alone, or chemotherapy plus tamoxifen), ER status (positive or negative), tumor size (<2 or ≥2 cm), and mastectomy (yes or no); excludes 56 women without baseline body weight measurements.
Adjusted for systemic adjuvant therapy, ER status, tumor size, and mastectomy; excludes 15 women with no axillary node dissection.
Adjusted for systemic adjuvant therapy, nodal status, tumor size, and mastectomy.
Excludes 154 patients with no PgR information or who were classified as borderline PgR by their local laboratory; adjusted for systemic adjuvant therapy, nodal status, tumor size, and mastectomy.
D ISCUSSION
WINS is, to our knowledge, the first large-scale randomized trial to test whether a dietary intervention can improve the clinical outcome of women with breast cancer. The WINS results indicate that a lifestyle intervention designed to reduce dietary fat intake can be successfully implemented in women with early-stage, resected breast cancer receiving conventional cancer management in a multicenter clinical trial setting. After approximately 5 years of follow-up, women in the dietary intervention group had a 24% lower risk of relapse than those in the control group (HR = 0.76; 95% CI = 0.60 to 0.98). Although these results are suggestive of benefit for the dietary intervention, given the level of statistical significance ( P = .034 for adjusted Cox model analysis), the higher relapse-free survival seen in the dietary group could also be a result of chance.
Secondary analyses suggested a stronger effect for dietary fat reduction on breast cancer recurrence in women with hormone receptor–negative cancers compared with women whose cancers were hormone receptor positive; however, the interaction between dietary intervention and hormone receptor status was not statistically significant. These findings are consistent with trends suggestive of a differential dietary influence by hormone receptor status on breast cancer incidence recently described in the Women's Health Initiative randomized primary prevention trial and in a Nurse's Health Study cohort ( 31 , 32 ) . A differential influence of dietary fat on breast cancer recurrence based on hormone receptor status will require confirmation. However, some of the most active adjuvant breast cancer interventions, including aromatase inhibitors ( 21 – 24 ) and trastuzumab ( 33 – 35 ) , are effective only in biologically defined subgroups, and interactions have been observed between ER status and adjuvant chemotherapy effect ( 36 ) . Thus, it would not be surprising to find that a lifestyle intervention has an effect on only some categories of breast cancer.
Because ER-positive cancers are under estrogen influence, a predominant influence of diet on ER-negative cancers would implicate factors other than estrogen ( 37 , 38 ) as mediators. Other potential mechanisms include reduced insulin levels ( 39 , 40 ) , reduced insulin resistance ( 41 ) , reduced insulin-like growth factor 1 ( 42 , 43 ) , or reduced inflammation markers—all factors that may be influenced by dietary fat decrease and/or weight loss ( 44 , 45 ) . Planned analyses of serial fasting blood samples in the two groups will address these issues.
The most appropriate endpoint for breast cancer adjuvant trials is controversial, and even the definitions of these endpoints are inconsistent ( 46 ) . Endpoints from recent selected adjuvant therapy trials are compared to the relapse-free survival endpoint of the WINS trial in Table 6 . Collectively, these reports define the endpoint of “disease-free survival” in four different ways ( 21 – 24 , 27 ) . We defined relapse-free survival, the prospectively identified primary study endpoint in WINS, in the same way that Goss et al. ( 22 ) recently defined a disease-free survival endpoint. To facilitate comparison of our study with others, we included death without breast cancer recurrence and second primary cancers as events in additional analyses; all results led to similar conclusions regarding the effects of the dietary intervention. Establishment of a common terminology for breast cancer adjuvant trial endpoints should be a future priority of the research community.
Primary study endpoints in selected adjuvant therapy trials in early breast cancer *
| Endpoint: as defined in each trial | Group/trial† | Local–regional recurrence | Distant recurrence | Ipsilateral breast tumor recurrence ‡ | Contralateral breast cancer | Death without recurrence | New primary cancer |
|---|---|---|---|---|---|---|---|
| Relapse-free survival | WINS | X | X | X | X | O | O |
| Disease-free survival | MA-17 | X | X | X | X | O | O |
| Disease-free survival | IES | X | X | X | X | X | O |
| Recurrence-free survival | ATAC | X | X | X | X | X | O |
| Disease-free survival | NSABP | X | X | O | X | X | X |
| Disease-free survival | BIG 1-98 | X | X | X | X | X | X |
An “X” indicates the endpoint was included in the definition, an “O” indicates the endpoint was not included in the definition.
WINS = Women's Intervention Nutrition Study; MA-17 = Mammary Study-17 ( 22 ) ; IES = International Exemestane Study ( 23 ) ; ATAC = anastrozole, tamoxifen alone, and combined ( 21 ) ; NSABP = National Surgical Adjuvant Breast and Bowel Project ( 15 , 27 ) ; BIG 1-98 = Breast International Group ( 24 ) .
Among patients with lumpectomy.
This study has several potential limitations. One is the imbalance of surgical treatments between the groups: 5.6% more women in the control group than in the intervention group had breast-conserving therapy. As a result, 55 more women in the control group with such surgery were at risk for an ipsilateral recurrence. However, considering all 1018 control group women with breast-conserving surgery, only 2.1% experienced ipsilateral recurrence. Consequently, only about one additional in-breast recurrence would be anticipated based on the surgical distribution. Thus, the modest imbalance in surgical management is unlikely to explain the difference in clinical outcome that we observed. In addition, in a large National Surgical Adjuvant Breast and Bowel Project Cancer randomized trial comparing mastectomy with lumpectomy plus radiation, women with mastectomy had a similar rate of local and regional recurrences after approximately 5 years of follow-up, even when ipsilateral breast recurrences were included (45 such recurrences were seen in the mastectomy group compared with 43 in the lumpectomy plus radiation group) ( 47 ) . Moreover, our adjustment for surgery type (mastectomy versus lumpectomy) in the Cox proportional hazards models should have controlled for the effect of the differences in surgical management.
A second limitation of the study is its reliance on self-report of dietary intake because no validated “gold standard” exists for assessing dietary fat intake ( 48 ) . However, body weight was statistically significantly lower in the dietary group, providing biologic plausibility that a dietary change did occur in women on the low-fat eating plan. Although the dietary intervention focused on reducing fat intake, intake of other nutrients changed, as did body weight. Thus, it is possible that weight change ( 49 , 50 ) and/or dietary factors other than fat intake influenced the breast cancer outcome. Planned future analyses will examine time trends and associations of changes in body weight and other dietary factors with breast cancer recurrence.
Study strengths include the randomized study design, closely comparable anticancer systemic therapies provided to women in the two randomization groups, and the degree of dietary adherence achieved by study participants. The reduction in dietary fat intake seen in the WINS trial is similar to or greater than that reported in other trials evaluating breast cancer and diet associations either for primary prevention ( 31 , 51 ) or recurrence ( 52 ) .
Replication in clinical practice of this dietary intervention will likely require on-going counseling with a dietician trained in these techniques. The WINS low-fat eating plan was intensive, individualized, and delivered using a standardized protocol by registered dieticians who had received centralized training which included motivational interviewing techniques.
In summary, an interim efficacy analysis suggests that a lifestyle intervention reducing dietary fat intake with modest body weight loss may improve the relapse-free survival of postmenopausal breast cancer patients. Ongoing follow-up will address original protocol design plans calling for 3 years of follow-up after completion of recruitment.
The following investigators were members of the WINS: Los Angeles Biomedical Research Institute at Harbor-UCLA Medical Center—R. T. Chlebowski, L. Lillington, M. Jackson; Institute for Cancer Prevention—E. L. Wynder (deceased), D. W. Nixon, B. Winters, K. Hoy, J. Richie; Beth Israel Deaconess Medical Center—G. L. Blackburn, T. Copeland; University of California Los Angeles—R. Elashoff, T. Johnson, W. Liu, M. N. Brooks; John Wayne Cancer Institute—A. Giuliano; Cedars-Sinai Medical Center—P. McAndrew; University of California Irvine Clinical Cancer Center—J. Butler; University of Hawaii—M. Goodman; Kaiser Permanente Medical Group, Oakland—B. Caan; Nutrition Information Consultants—K. Storch; North Shore University Hospital—V. Vinciguerra; Saint Barnabas Medical Center—R. Michaelson; Evanston Hospital, Kellogg Cancer Care Center—D. Merkel; Memorial-Sloan Kettering Cancer Center—C. Hudis; Lombardi Cancer Research Center—C. Issacs; Rhode Island Hospital—M. Winkler; Wayne State University—M. Simon; University of Arizona—C. Thomson; Fred Hutchinson Cancer Research Center—A. Kristal; Kaiser Permanente Center for Health Research, Portland—K. Karanja; Ohio State University—W. Farrar; Medical University of South Carolina—R. Hall; Duke University—W. Demark-Wahnefried; Bennett Cancer Center Hematology and Oncology—S. Del Prete; Geisinger Medical Center—A. Bernath; Park Nicollet Institute Oncology Research—A. Shapiro; Medical College of Wisconsin—G. Schectman; Christus Spohn Breast Care Program—E. Salloum; Good Samaritan Medical Center—E. McKeen; University of Miami—G. Shor-Posner; Midwestern Regional Medical Center—P. Vashi; University of Iowa—L. Snetselaar; Bay State Medical Center—G. Markari-Judson.
The following nutritionists delivered the WINS dietary intervention: N. Adamowicz, L. Ahrens, S. Anderson, M. Beddome, R. Beller, K. Bierl, D. Brake, A. Campa, M. Chrabaszewski, C. Coy, S. Dahlk, F. Ebel, N. Falla, E. Falk, S. Anikstein Feldman, J. Ferrares, V. Fortunato, J. Galicinao, A. Gallagher, P. Gregory, S. Heilman, W. Hirsch, M. Horan, P. Jensen, L. Kelleher, K. Lombardi, M. Lubin, A. M. Maggi, M. Malone, S. Marshall, V. Marsoobian, D. Moran, K. Mulligan, E. Nardi, L. Nylin, J. T. Papoutsakis, J. Pleuss, K. Radokovich, J. Reddan, C. Rheingruber, C. Richardson, J. Schenk, K. Schwab, S. Shannon, . Shepard, S. Sloan, M. Sokil, D. Strong, A. Snyder, M. Vides, B. Whilden, C. Willeford, D. Wilson, L. Wolf, R. Zinaman.
The following investigators are members of the WINS Executive Committee: R. T. Chlebowski, Executive Committee Chair, Clinical Director and Principal Investigator; G. Blackburn, Chair, Nutrition Committee; R. Elashoff, Director, Statistical Coordinating Unit; and K. Hoy, National Coordinator. Former Executive Committee chairs included E. L. Wynder (deceased) and D. W. Nixon.
The following investigators were members of the the WINS External Advisory Committee: Sunnybrook Health Science Center—K. Pritchard, Chair; Mt Sinai Hospital—P. Goodwin; Tufts University—J. Dwyer; University of Hawaii—L. Kolonel; Harvard University—W. Willett; and Cornell University—B. Turnbull.
The following investigators were members of the Pathology Committee: R. Chlebowski, Chair, Los Angeles Biomedical Research Institute at Harbor-UCLA Medical Center; M. Sanchey, Englewood Hospital; and T. Ahmed, New York Medical College.
This study was primarily funded by the National Cancer Institute, National Institutes of Health, Department of Health and Human Services. Funding for supplemental projects was provided by the Breast Cancer Research Foundation and the American Institute for Cancer Research. This study was supported by an investigator-initiated RO1 grant. The WINS investigators (with input from the independent WINS External Advisory Committee) were solely responsible for the design; data collection, analysis, and interpretation; writing of the manuscript; and decision to submit for publication.
References
Wynder EL, Cohen LA, Muscat JE, Winters B, Dwyer JT, Blackburn G. Breast cancer: weighing the evidence for a promoting role of dietary fat.
Prentice RL. Future possibilities in the prevention of breast cancer: fat and fiber and breast cancer research.
Willett WC, Stampfer MJ, Colditz GA, Rosner BA, Hennekens CH, Speizer FE. Dietary fat and the risk of breast cancer.
Bingham SA, Luben R, Welch A, Wareham N, Khaw KT, Day N. Are imprecise methods obscuring a relation between fat and breast cancer?
Boyd NF, Stone J, Vogt KN, Connelly BS, Martin LJ, Minkin S. Dietary fat and breast cancer risk revisited: a meta-analysis of the published literature.
Holmes MD, Stampfer MJ, Colditz GA, Rosner B, Hunter DJ, Willett WC. Dietary factors and the survival of women with breast carcinoma [erratum in Cancer 1999;86:2707–8].
Goodwin PJ, Ennis M, Pritchard KI, Koo J, Trudeau ME, Hood N. Diet and breast cancer: evidence that extremes in diet are associated with poor survival.
Jain M, Miller AB, To T. Premorbid diet and the prognosis of women with breast cancer.
Zhang S, Folsom AR, Sellers TA, Kushi LH, Potter JD. Better breast cancer survival for postmenopausal women who are less overweight and eat less fat. The Iowa Women's Health Study.
Saxe GA, Rock CL, Wicha MS, Schottenfeld D. Diet and risk for breast cancer recurrence and survival.
Prentice RL. Methodologic challenges in chronic disease population research.
Freedman LS, Potischman N, Kipnis V, Midthune D, Schatzkin A, Thompson FE, et al. A comparison of two dietary instruments for evaluating the fat-breast cancer relationship.
Chlebowski RT, Rose D, Buzzard IM, Blackburn GL, Insull W Jr, Grosvenor M, et al. Adjuvant dietary fat intake reduction in postmenopausal breast cancer patient management. The Women's Intervention Nutrition Study (WINS).
Chlebowski RT, Blackburn GL, Buzzard IM, Rose DP, Martino S, Khaddekar JD, et al. Adherence to a dietary fat intake reduction program in postmenopausal women receiving therapy for early breast cancer. The Women's Intervention Nutrition Study.
Fisher B, Anderson S, Tan-Chiu E, Wolmark N, Wickerham DL, Fisher ER, et al. Tamoxifen and chemotherapy for axilary node-negative, estrogen receptor-negative breast cancer: findings from National Surgical Adjuvant Breast and Bowel Project B-23.
Buzdar AU, Kau SW, Smith TL, Hortobagyi GN. Ten-year results of FAC adjuvant chemotherapy trial in breast cancer.
Henderson IC, Berry DA, Demetri GD, Cirrincione CT, Goldstein LJ, Martino S, et al. Improved outcomes from adding sequential paclitaxel but not from escalating doxorubicin dose in an adjuvant chemotherapy regimen for patients with node-positive primary breast cancer.
Winters BL, Mitchell DC, Smiciklas-Wright H, Grosvenor MB, Liu W, Blackburn GL. Dietary patterns in women treated for breast cancer who successfully reduce fat intake: the Women's Intervention Nutrition Study (WINS).
Lohman TG, Roche AF, Martorell F, editors. Anthropometric standardization reference manual. Champaign (IL): Human Kinetics Publishers, Inc;
Copeland T, Grosvenor M, Mitchell DC, Smiciklas-Wright H, Marsobian V, Blackburn G, et al. Designing a quality assurance system for dietary data in a multicenter clinical trial: Women's Intervention Nutrition Study.
Baum M, Budzar AU, Cuzick J, Forbes J, Houghton JH, Klijn JG, et al. Anastrozole alone or in combination with tamoxifen versus tamoxifen alone for adjuvant treatment of postmenopausal women with early breast cancer: first results of the ATAC randomized trial.
Goss PE, Ingle JN, Martino S, Robert NJ, Muss HB, Piccart MJ, et al. A randomized trial of letrozole in postmenopausal women after five years of tamoxifen therapy for early-stage breast cancer.
Coombes RC, Hall E, Gibson LJ, Paridaens R, Jassen J, Delozier T, et al. A randomized trial of exemestane after two to three years of tamoxifen therapy in postmenopausal women with primary breast cancer.
Thurlimann B, Keshaviah A, Coates AS, Mouridsen H, Mauriac L, Forbes JF, et al.; The Breast International Group (BIG) 1-98 Collaborative Group. A comparison of letrozole and tamoxifen in postmenopausal women with early breast cancer.
Singletary SE, Allred C, Ashley P, Bassett LW, Berry D, Bland KI, et al. Revision of the American Joint Committee on Cancer staging system for breast cancer.
Chlebowski RT, Blackburn GL, Elashoff RE, Thomson C, Goodman MT, Shapiro A, et al. Dietary fat reduction in postmenopausal women with primary breast cancer: Phase III Women's Intervention Nutrition Study (WINS).
Fisher B, Costantino J, Redmond C, Poisson R, Bowman D, Couture J, et al. A randomized clinical trial evaluating tamoxifen in the treatment of patients with node-negative breast cancer who have estrogen-receptor-positive tumors.
Fisher B, Redmond C, Legault-Poisson S, Dimitrov NV, Brown AM, Wickerham DL, et al. Postoperative chemotherapy and tamoxifen compared with tamoxifen alone in the treatment of positive-node breast cancer patients aged 50 years and older with tumors responsive to tamoxifen: results from the National Surgical Adjuvant Breast and Bowel Project B-16.
Lin D, Wei L, Ying, Z. Checking the Cox model with cumulative sums of martingale residuals.
Haybitle JL. Repeated assessment of results in clinical trials of cancer treatment.
Prentice RL, Caan B, Chlebowski RT, Patterson R, Kuller LH, Ockene JK, et al. Low-fat dietary pattern and risk of invasive breast cancer. The Women's Health Initiative randomized controlled dietary modification trial.
Fung TT, Hu FB, Holmes MD, Rosner BA, Hunter DJ, Colditz GA, et al. Dietary patterns and the risk of postmenopausal breast cancer.
Salmon DJ, Leyland-Jones B, Shak S, Fuchs H, Paton V, Bajamonde A, et al. Use of chemotherapy plus a monoclonal antibody against HER2 for metastatic breast cancer that overexpresses HER2.
Romond EH, Perez EA, Bryant J, Suman VJ, Geyer CE Jr, Davidson NE, et al. Trastuzumab plus adjuvant chemotherapy for operable HER2-positive breast cancer.
Piccart-Gebhart MJ, Procter M, Leyland-Jones B, Goldhirsch A, Untch M, Smith I, et al. Trastuzumab after adjuvant chemotherapy in HER2 positive breast cancer.
Berry DA, Cirrincione C, Henderson IC, Citron ML, Budman DR, Goldstein LJ, et al. Estrogen-receptor status and outcomes of modern chemotherapy for patients with node-positive breast cancer.
Rose DP, Connolly JM, Chlebowski RT, Buzzard IM, Wynder EL. The effects of a low-fat dietary intervention and tamoxifen adjuvant therapy on the serum estrogen and sex hormone-binding globulin concentrations of postmenopausal breast cancer patients.
Wu AH, Pike MC, Stram DO. Meta-analysis: dietary fat intake, serum estrogen levels, and the risk of breast cancer.
Goodwin PJ, Ennis M, Pritchard KI, Trudeau ME, Koo J, Hartwick W, et al. Fasting insulin and outcome in early-stage breast cancer: results of a prospective cohort study.
Borugian MJ, Sheps SB, Kim-Sing C, Van Patten C, Potter JD, Dunn B, et al. Insulin, macronutrient intake, and physical activity: are potential indicators of insulin resistance associated with mortality from breast cancer?
Pollack MN, Chapman JW, Shepherd L, et al. Insulin resistance, estimated by serum C-peptide level, is associated with reduced event-free survival for postmenopausal women in NCIC CTG MA.14 adjuvant breast cancer trial.
Toniolo P, Bruning PF, Akhmedkhanov A, Bonfrer JM, Koenig KL, Lukanovia A, et al. Serum insulin-like growth factor-I and breast cancer.
Wolf I, Sadetzki S, Catane R, Karasik A, Kaufman B. Diabetes mellitus and breast cancer.
Barnard RJ, Gonzalez JH, Liva ME, Ngo TH. Effects of a low-fat, high-fiber diet and exercise program on breast cancer risk factors in vivo and tumor cell growth and apoptosis in vitro.
Clifton PM, Keogh JB, Foster PR, Noakes M. Effect of weight loss on inflammatory and endothelial markers and FMD using two low-fat diets.
Piccart-Gebhart M. New stars in the sky of treatment for early breast cancer.
Fisher B, Bauer M, Margolese R, Poisson R, Pilch Y, Redmond C, et al. Five year results of a randomized clinical trial comparing total mastectomy and segmental mastectomy with or without radiation in the treatment of breast cancer.
Hunter D. Biochemical indicators of dietary intake. In: Willett W, editor. Nutritional epidemiology. New York: Oxford University Press;
Chlebowski RT, Aiello E, McTiernan A. Weight loss in breast cancer patient management.
Whiteman MK, Hillis SD, Curtis KM, McDonald JA, Wingo PA, Marchbanks PA. Body mass and mortality after breast cancer diagnosis.
Boyd NF, Greenberg C, Lockwood G, Little L, Martin L, Byng J, et al. Effects at two years of a low-fat, high-carbohydrate diet on radiologic features of the breast: results from a randomized trial. Canadian Diet and Breast Cancer Prevention Study Group.
Pierce JP, Faerber S, Wright FA, Rock CL, Newman V, Flatt SW, et al. for the Women's Healthy Eating and Living (WHEL) Study Group. A randomized trial of the effect of a plant-based dietary pattern on additional breast cancer events and survival: the Women's Healthy Eating and Living (WHEL) Study.

