


Abstract
Artificial sweeteners are used widely to replace caloric sugar as one of the strategies to lessen caloric intake. However, the association between the risk of obesity and artificially sweetened soda consumption is controversial. The objective of this meta-analysis aimed to assess the association between consumption of sugar and artificially sweetened soda and obesity.
A literature search was performed using MEDLINE, EMBASE, Cochrane Database of Systematic Reviews, and Cochrane Central Register of Controlled Trials from inception through May 2015. Studies that reported relative risks, odd ratios, or hazard ratios comparing the risk of obesity in patients consuming either sugar or artificially sweetened soda vs. those who did not consume soda were included. Pooled risk ratios (RRs) and 95% CI were calculated using a random-effect, generic inverse variance method.
Eleven studies were included in our analysis to assess the association between consumption of sugar-sweetened soda and obesity. The pooled RR of obesity in patients consuming sugar-sweetened soda was 1.18 (95% CI, 1.10–1.27). Three studies were included to assess the association between consumption of artificially sweetened soda and obesity. The pooled RR of obesity in patients consuming artificially sweetened soda was 1.59 (95% CI, 1.22–2.08).
Our study demonstrated a significant association between sugar and artificially sweetened soda consumption and obesity. This finding raises awareness and question of negative clinical impact on both sugar and artificially sweetened soda and the risk of obesity.
Introduction
Obesity prevalence has significantly risen in the USA and worldwide. Globally, the prevalence of obesity and overweight combined increased by 27% in adult and 47% in children from 1980 to 2013.1 Specifically, in the USA, ∼37% of adult and 17% of children were affected by obesity based on National Health and Examination Survey (NHANES).2,3 Because of the obesity epidemic and substantial increasing trend in obesity and its comorbidities particularly non-communicable diseases, government in many countries has responded by increasing public health awareness and implementing policy and regulation.
Sugar-sweetened beverages largely contribute as one of a source of additional calories in daily diet consumed by US population. Previous evidences demonstrated inconsistent and mix results on an association between the risk of obesity and higher consumption of sugar-sweetened beverages although some studies revealed a modest relationship.4–6 The strength of association was inconclusive because of the heterogeneity and the type of studies conducted made an evaluation of sugar-sweetened beverages and obesity risk still unclear.4–6
Artificial sweeteners such as aspartame, sucralose and saccharine are commonly used as an alternative to lower calories in many types of beverages including soft drink, fruit juice and energy drink as presumably healthier choices. Therefore, it may seem logical that artificial sweeteners would have provided less weight gain, and prevented cardiometabolic risks. With this regard, the numbers of people in the USA who consumed artificially sweetened beverages have substantially risen with 24% of adult and 12% of children reported consuming low caloric sweetened beverages based on 2007–08 NHANES data.7 Several studies have suggested that artificially sweetened beverages might not provide health benefit as one might expect. Greater risk of metabolic syndrome and type 2 diabetes were reported across various large prospective cohorts.8,9 Nevertheless, previous reports on artificially sweetened beverages on obesity and weight gain are conflicting.
The objective of this systematic review and meta-analysis was to assess the association between obesity and the consumption of sugar and artificially sweetened beverages.
Research design and methods
Search strategy
Two investigators (C.T. and W.C.) independently searched published studies indexed in MEDLINE, EMBASE and the Cochrane databases from inception through May 2015 using the search strategy described in item Supplementary material S1. A manual search for supplementary relevant studies utilizing references from retrieved articles was also completed. In order to assess the quality and publication bias of all studies, conference abstracts and unpublished studies were excluded. This systematic review was conducted in accordance with the PRISMA (Preferred Reporting Items for Systematic Reviews and Meta-Analysis) guidelines.10 PRISMA checklist is shown in online Supplementary material S2.
Study selection
The inclusion criteria were (i) randomized controlled trials (RCTs) or observational studies (case-control, cohort studies or cross-sectional) published as original studies to appraise the risk of obesity in patients consuming either sugar or artificially sweetened soda, (ii) odds ratios, relative risks, hazard ratios or standardized incidence ratio with 95% CIs were presented and (iii) a reference group composed of participants who did not consume soda. No limits were implemented to language.
Study eligibility was independently ascertained by the two investigators noted earlier. Differing decisions were settled by common consensus. The quality of each included study was independently assessed by individual investigator using Newcastle-Ottawa quality assessment scale.11
Data collection process and data items
A standardized information collection form was utilized to obtain the following information: last name of the first author, type of study, country of origin, year of publication, sample size, characteristics of included participants, definition of soda consumption, definition used to diagnose obesity including body mass index (BMI), waist circumference (WC), confounder adjustment and adjusted effect estimates with 95% CI. The two investigators mentioned earlier independently performed this data extraction.
Statistical analysis
All data analyses were performed using Review Manager 5.3 software from the Cochrane Collaboration. Point estimates and standard errors were derived from individual studies and were consolidated by the generic inverse variance approach of DerSimonian and Laird.12 Due to the high likelihood of between-study variances, we applied a random-effect model rather than a fixed-effect model. Statistical heterogeneity was assessed using the Cochran’s Q test. This statistic is complemented with the I2 statistic, which quantifies the proportion of the total variation across included studies that are due to heterogeneity rather than chance. A value of I2 of 0–25% represents insignificant heterogeneity, 26–50% low heterogeneity, 51–75% moderate heterogeneity and >75% high heterogeneity.13 The presence of publication bias was assessed by funnel plots of the logarithm of odds ratios vs. their standard errors.14
Results
Our search strategy yielded 3478 potentially relevant articles. A total of 3219 articles were excluded based on title and abstract for not fulfilling inclusion criteria by the type of article, study design, population or outcome of interest. A total of 259 articles underwent full-length article review, and 246 articles were excluded (133 articles were not observational studies or RCTs, 113 articles did not report the outcomes of interest). We identified 13 articles included in the data analysis, 11 studies for the association between obesity and sugar-sweetened soda and 3 studies for the association between obesity and artificially sweetened soda. Item S2 in Supplementary material S1 outlined our search methodology and selection process. Table 1 showed the detailed characteristics and quality assessment of the included studies.
Main characteristics of the studies included in this meta-analysis
| Bes-Rastrollo et al.17 | Dhingra et al.16 | Fowler et al.26 | Nettleton et al.27 | |
|---|---|---|---|---|
| Country | Spain | USA | USA | USA |
| Study design | Cohort study | Cohort study | Cohort study | Cohort study |
| Year | 2006 | 2007 | 2008 | 2009 |
| Total number | 7194 | 6039 person-observations | 5158 | 6814 |
| Study sample | Spanish University Alumni | Framingham Offspring Study (offspring cohort participants who attended any 2 consecutive examinations from 4th–7th (1998–2001) examination cycles) | Mexican and non-Hispanic white adult residents of San Antonio aged 25–64 years | MESA (Caucasian, African American, Hispanic and Chinese adults, aged 45–84 years) |
| Exposure definition | Consumption of sugar-sweetened soft drinks (ml/d) | Number of soft drink serving per day | Artificially sweetened soft drink | Diet soda intake |
| Exposure measurement | Semiquantitative FFQ that included 136 food items and nutrient scores was calculated | Questionnaire on average of soft drink consumed per day and FFQ | Artificially sweetened questionnaire | Self-reported |
| Outcome definition | Highest quintile of weight gain ≥ 3kg in previous 5 years |
| Obesity: BMI ≥30 kg/m2 | High WC:
|
| Outcome ascertainment | Self-administered questionnaires that are sent by mail every 2 years | Standardized physical exam and anthropometry | Standard Anthropometric measurement | WC was measured at the umbilicus using a standard tape measure |
| Adjusted OR or RR |
|
|
|
|
| Confounder adjustment | Age, sex, total energy intake from non-sugar sweetened soft drink sources, fiber intake, alcohol intake, milk consumption, leisure-time physical activity (LTPA), smoking status, snacking, television watching and baseline weight | Baseline level of the metabolic syndrome component and age, sex, physical activity index, smoking, dietary consumption of saturated fat, trans fat, fiber, magnesium, total calories and glycemic index | Gender and ethnicity; baseline age, education, socioeconomic index, BMI, exercise frequency and smoking status; and interim change in exercise level and smoking status | Study site, age, sex, race/ethnicity, energy intake education, physical activity, smoking status, pack-years and weekly supplement use or more |
| Quality assessment (Newcastle-Ottawa scale) |
|
|
|
|
| Duffey et al.18 | Phelan et al.15 | Hatami et al.21 | Martinez-Gonzalez et al.22 | Emond et al.23 | |
|---|---|---|---|---|---|
| Country | USA | USA | Iran | Spain | USA |
| Study design | Cohort study | Cohort study | Cross-sectional study | Cross-sectional study | Cross-sectional study |
| Year | 2010 | 2010 | 2012 | 2012 | 2013 |
| Total number | 2774 | 1869 | 1157 | 7447 | 250 |
| Study sample | CARDIA cohort, adult aged 18–30 years | Overweight and obese African and Caucasian American without major diseases | Adolescents aged 10–18 years in primary, secondary and high school | Women (60–80 years old) or men (55–80-years old) without prior cardiovascular disease, but at high cardiovascular risk from Spanish Primary Care Centers | Data are from the Energetics Dietary Assessment study; healthy, non-smoking adults aged 21–69 years from greater Los Angeles |
| Exposure definition | Increase in sugar-sweetened beverage consumption from year 0 and year 7 | Soft drink consumption (serving/day; year 2005) | Soft drink sweetened drink consumption | Soda drink >1/d | Sugar-sweetened beverage intake |
| Exposure measurement | Interviewer-administered FFQ | Diet history questionnaire | Self administered questionnaire | face-to-face interview FFQ | DietDay, a validated, web-based, 24-h dietary recall assessment |
| Outcome definition | High WC:
| Overweight or obesity according to WHO criteria |
|
| Overweight/obesity according to WHO criteria |
| Outcome ascertainment | WC was measured as the average of 2 measures at the minimum abdominal girth (nearest 0.5 cm) from participants standing upright | Weight and height were measured in light clothing and without shoes using calibrated equipment. | All measurements were conducted based on published training and practical guides by WHO. The weight was measured in light clothing with no shoes to the nearest 0.1 kg by a portable digital scale. The height was measured while subjects were in the standing position without shoes to the nearest 0.1 cm by a portable/wall mounted standiometer with a movable headpiece | Weight, height and WC were directly measured by registered nurses who had been previously trained and certified to implement the PREDIMED protocol and were hired to work full-time for this trial | Height were collected at the baseline visit; weight was measured in triplicate at each clinic visit |
| Adjusted OR/RR | 1.09 (1.04–1.15) | 1.25 (1.11–1.43) |
|
|
|
| Confounder adjustment | Race, sex, exam center and baseline age, weight, smoking status, energy from food, total physical activity, energy from the three other beverages and energy from alcohol | Race, gender, marital status, dieting history, history of diabetes, physical activity, psychosocial variables | Age and sex | Sex, age, smoking, and center | Age, education, total caloric intake and fiber intake |
| Quality assessment (Newcastle-Ottawa scale) |
|
|
|
|
|
| Boggs et alet al. (19) | French et alet al. (24) | Funtikova elt al. (20) | Park et alet al. (25) | |
|---|---|---|---|---|
| Country | USA | Australia | Spain | USA |
| Study design | Cohort study | Cross-sectional study | Cohort study | Cross-sectional study |
| Year | 2013 | 2013 | 2014 | 2014 |
| Total number | 19 479 | 1015 (374 sugar-sweetened drinks only, 204 sugar and diet, 177 diet drink only) | 2181 | 38 978 |
| Study sample |
| Western Australian resident aged 16–65 years | 1 city population-based survey | Adults aged 18 or older from 6 states (Delaware, Hawaii, Iowa, Minnesota, New Jersey, and Wisconsin) |
| Exposure definition | Regular soft drinks | Soft drink consumption (diet and/or sugar-sweetened) | 100 Kcal increased in soft drink consumption | Sugar-sweetened beverages (include non-diet soda and fruit drinks that are not 100% juice) ≥1 time/day |
| Exposure measurement | Self-report via mailed or emailed FFQ | Telephone interview | Validated FFQ, administered by a trained interviewer | The standardized Behavioral Risk Factor Surveillance System Optional Module for assessing sugar sweetened beverage intake (Telephone interview) |
| Outcome definition | Obesity: BMI ≥30 kg/m2 | Overweight/obesity according to WHO criteria | Abdominal obesity:
| Obesity ≥ 30 kg/m2 |
| Outcome ascertainment | Participants reported height and current weight via mail questionnaire | Self reported | WC was measured midway between the lowest rib and the iliac crest, with the participant lying horizontally and the measurement was rounded to the nearest 0.5 cm. | Self reported |
| Adjusted OR or RR |
|
| 1.1 (0.18–2.03) |
|
| Confounder adjustment | Age, baseline BMI, vigorous physical activity, walking for exercise, education, geographic region, smoking status, alcohol intake, parity and prudent and western dietary patterns | Gender, location, age group, socioeconomic status | Sex, age and baseline WC, smoking, energy intake, smoking, educational level, LTPA, modified Mediterranean diet score, energy under- and over-reporting | Age, sex and race/ethnicity |
| Quality assessment (Newcastle-Ottawa scale) |
|
|
|
|
Abbreviations: BMI, Body mass index; WC, waist circumference; FFQ, food-frequency questionnaire; CARDIA, the Coronary Artery Risk Development in Young Adults; MESA, Multi-Ethnic Study of Atherosclerosis; WHO, World Health Organization.
The risk of overweight/obesity in patients consuming sugar-sweetened soda
Eleven studies15–25 [six cohort studies15–20 and five cross-sectional studies21–25] with 88 383 patients consuming sugar-sweetened soda were included in the analysis for the risk of obesity. The pooled risk ratio (RR) for overweight/obesity in individuals consuming sugar-sweetened soda was 1.18 (95% CI, 1.10–1.27). The statistical heterogeneity was low with an I2 of 40%. Figure 1 shows the forest plot of the included studies. We performed an analysis excluding cross-sectional studies (data not shown), and the result remained significant (RR 1.2 [95% CI, 1.08–1.32]); with moderate heterogeneity I2 of 57%.
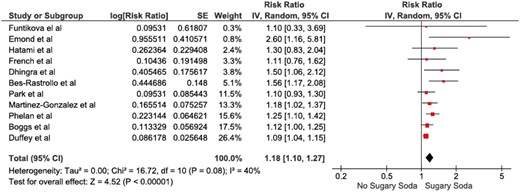
Forest plot of the included studies comparing risk of overweight and obesity in patients who consumed sugar-sweetened soda and those who did not; square data markers represent risk ratios (RRs); horizontal lines, the 95% CIs with marker size reflecting the statistical weight of the study using random-effects meta-analysis. A diamond data marker represents the overall RR and 95% CI for the outcome of interest. IV, inverse variance; SE, standard error.
The risk of high WC in patients consuming sugar-sweetened soda
Four studies16,18,20,22 [Three cohort studies16,18,20 and one cross-sectional study22] with 18 441 patients consuming sugar-sweetened soda were included in the analysis for the risk of high WC. The pooled RR for high WC in individuals consuming sugar-sweetened soda was 1.20 (95% CI, 1.04–1.37). The statistical heterogeneity was moderate with an I2of 52%. Figure 2 shows the forest plot of the included studies.

Forest plot of the included studies comparing risk of high waist circumference in patients who consumed sugar-sweetened soda and those who did not; square data markers represent risk ratios (RRs); horizontal lines, the 95% CIs with marker size reflecting the statistical weight of the study using random-effects meta-analysis. A diamond data marker represents the overall RR and 95% CI for the outcome of interest. IV, inverse variance; SE, standard error.
The risk of overweight/obesity in patients consuming artificially sweetened soda
Three studies24,26,27 [all cross-sectional studies] with 12 987 patients consuming artificially sweetened soda were included in the analysis for the risk of overweight/obesity. The pooled RR for obesity in individuals consuming artificially sweetened soda was 1.59 (95% CI, 1.22–2.08). The statistical heterogeneity was low with an I2of 36%. Figure 3 shows the forest plot of the included studies.
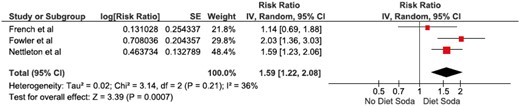
Forest plot of the included studies comparing risk of overweight and obesity in patients who consumed artificially-sweetened soda and those who did not; square data markers represent risk ratios (RRs); horizontal lines, the 95% CIs with marker size reflecting the statistical weight of the study using random-effects meta-analysis. A diamond data marker represents the overall RR and 95% CI for the outcome of interest. IV, inverse variance; SE, standard error.
Evaluation of publication bias
Funnel plots to evaluate publication bias for the risk of obesity in patients consuming sugar-sweetened soda and artificially sweetened soda were summarized in Supplementary Figures S1 and S2. The graph provides a suggestion for insignificant publication bias of the risk of obesity in patients with sugar-sweetened soda and artificially sweetened soda consumption.
Discussion
Our meta-analysis demonstrated a statistically significant association between sugar-soda consumption and weight with 1.18-fold increased the risk of overall overweight and obesity, and 1.2-fold increased the risk of higher WC compared with those who did not consume sugar-sweetened beverages. Interestingly, the positive association was also observed in people who regularly consumed artificially sweetened beverages with 1.59-fold increased the risk of overweight and obesity compared with those who did not.
Our findings confirmed a greater risk of obesity linked to excessive calories intakes from sugary beverages. The risk of obesity and high WC increased by 18–20% with consumption of sugar-sweetened beverages. This strength of association was consistent with previous meta-analysis.6 There have been several mechanisms explained the cause of weight gain from added sugars. Obviously, added sugars directly increased the amount of caloric intake that exceeded energy balance.6 In addition, previous studies had demonstrated a lack of compensatory mechanism and less satiating effect of isoenergetic liquid food such as sugar-sweetened beverages when compared with solid food consumption.28,29 Thus, there was no reduction in total or subsequent solid food intake when an individual consumed more beverages resulting in greater weight gain. De Castro demonstrated that consumption of either caloric or low caloric beverages did not replace other forms of food in the subsequent meal or over the entire day which indicated the elasticity of eating pattern and influence of non-regulatory factors such as circadian, seasonal and social circumstances.29
Sugar in the form of soda and other sugary drinks such as fruit juices are the highest source of added calories in the diet in the USA.30 North America and Latin America are the current largest consumers of sugar-sweetened beverages.31 However, the trends of sugar containing beverages sale are remarkably rising in low- and middle-income countries particularly in China, Thailand, Brazil and Chile.31 Hence, in 2015, World Health Organization recommended decreasing free sugars (added to foods and beverages by the company, cook or consumer, and sugars naturally being in honey, syrups, fruit juices and fruit juice concentrates) intake to <10% of total energy intake in both adults and children.31
Interestingly, our study is the first meta-analysis to demonstrate that regular consumption of artificially sweetened soda is significantly associated with overall increased risk of overweight and obesity. Previous studies on the association between consumption of artificially sweetened beverages and weight outcome have provided inconsistent results particularly in adults which are likely due to different type of studies, baseline participants’ characteristics and outcomes of interest measurement. The plausible explanations on the effect of low- or non-caloric sweetened beverages on weight have been widely studied. In vitro studies showed that some of the non-caloric sweeteners up-regulated Na/glucose cotransporter on the apical (luminal) membrane resulting in increasing glucose transporter 2 insertion on the basolateral membrane of the gut cell and hence, increased glucose absorption.32 It has been demonstrated in randomized crossover study that artificial sweeteners increase glucagon-like peptide 1 (GLP-1) secretion by 34% after oral glucose ingestion when compared with carbonated water,33 while another study showed no difference in plasma GLP-1 during intraduodenal infusion of sucralose vs. saline in combination with glucose.34 It has been proposed that increased GLP-1 secretion by artificial sweeteners would increase insulin secretion and subsequently lower glucose level, thus increase appetite.32
Emerging evidences in both animal and human studies have shown that gut microbiome could be one of the potential causal links between excessive consumption of non-caloric sweeteners and negative health effects. Suez et al.35 extensively examined the relationship between artificial sweeteners consumption and gut microbiota mediated metabolic dysregulation. When compared with glucose fed mice, artificial sweeteners-consuming mice had impaired glucose tolerance that ameliorated by gram positive and gram negative targeting antibiotics administration. Examining of fecal microbiota composition, artificial sweeteners-consuming mice exhibited alteration of groups of bacteria by over-representation of the Bacteroides and under-representation of the Clostridiales. Moreover, germ-free mice recipients receiving fecal transplantation from mice drinking saccharin demonstrated impaired glucose tolerance which indicated artificial sweeteners induced poor metabolic response through alteration of gut microbiota. Suez et al.35 also demonstrated similar effect of non-caloric artificial sweeteners consumption in human. In a cohort of 381 non-diabetic participants, poor metabolic syndrome markers (BMI, HbA1c, glucose tolerance test) and alteration of microbes notably for the Enterobacteriales and the Clostridiales were positively correlated in the individuals consuming artificial sweeteners. In a smaller human study, after 1 week of exposure to maximal acceptable daily intake of saccharin, four out of seven healthy volunteers who do not normally consume artificially sweetened beverages developed poor glycemic responses and altered gut microbiome composition while there was no response in the remaining individuals. Interestingly, microbiome compositions appear to be different even prior to exposure to saccharin in participants who had worsen metabolic response compared with participants who did not which indicated distinct nutritional individual responses in human.35
Although most of the included studies are of moderate to high quality as evaluated by Newcastle-Ottawa scale, there are some of limitations to note. Our meta-analysis included the studies involving only adult so the result does not reflect childhood obesity. A majority of the studies were conducted using diet recall questionnaire that provided less accurate data and lack of repeated assessments of diet intake or adjusted for other dietary component could possibly cause dietary misclassification and lead to reporting bias. Additionally, there is heterogeneity of the analysis including type of artificial sweeteners consumption, outcomes of interest (BMI, and WC), and difference in adjusted confounders. Although sample sizes were relatively large, a few studies of artificially sweetened beverages were included in our meta-analysis due to inclusion criteria so it might lead to publication bias. The studies included in this meta-analysis are observational studies either cohort or cross-sectional thus, the result can be drawn only by association but not causal relationships.
In summary, our study demonstrated significant links between both sugar and artificially sweetened soda and obesity. This finding should raise public awareness and governmental responses for policy and regulation on potential negative health impacts particularly weight and metabolic dysregulation on excessive consumption of sugar and artificially sweetened beverages. A prospective well-designed interventional study is warranted to better understand causal mechanisms and lead to nutritional guidances.
Supplementary material
Supplementary material is available at QJMED online.
Conflict of interest: None declared.
