Role of diet in type 2 diabetes incidence: umbrella review of meta-analyses of prospective observational studies
BMJ 2019; 366 doi: https://doi.org/10.1136/bmj.l2368 (Published 03 July 2019) Cite this as: BMJ 2019;366:l2368
- Manuela Neuenschwander, doctoral researcher1,
- Aurélie Ballon, masters student1,
- Katharina S Weber, postdoctoral researcher2 3,
- Teresa Norat, principal research fellow5,
- Dagfinn Aune, postdoctoral researcher and associate professor4 5 6,
- Lukas Schwingshackl, postdoctoral researcher7 8,
- Sabrina Schlesinger, senior research associate1 3
- 1Institute for Biometrics and Epidemiology, German Diabetes Centre, Leibniz Centre for Diabetes Research at Heinrich Heine University Düsseldorf, Auf’m Hennekamp 65, D-40225 Düsseldorf, Germany
- 2Institute for Clinical Diabetology, German Diabetes Centre, Leibniz Centre for Diabetes Research at Heinrich Heine University Düsseldorf, Düsseldorf, Germany
- 3German Centre for Diabetes Research, München-Neuherberg, Germany
- 4Department of Epidemiology and Biostatistics, Imperial College London, London, UK
- 5Department of Nutrition, Bjørknes University College, Oslo, Norway
- 6Department of Endocrinology, Morbid Obesity and Preventive Medicine, Oslo University Hospital, Oslo, Norway
- 7Institute for Evidence in Medicine, Faculty of Medicine and Medical Centre-University of Freiburg, Freiburg, Germany
- 8Department of Epidemiology, German Institute of Human Nutrition Potsdam-Rehbruecke, Nuthetal, Germany
- Correspondence to: S Schlesinger sabrina.schlesinger{at}ddz.de
- Accepted 8 May 2019
Abstract
Objective To summarise the evidence of associations between dietary factors and incidence of type 2 diabetes and to evaluate the strength and validity of these associations.
Design Umbrella review of systematic reviews with meta-analyses of prospective observational studies.
Data sources PubMed, Web of Science, and Embase, searched up to August 2018.
Eligibility criteria Systematic reviews with meta-analyses reporting summary risk estimates for the associations between incidence of type 2 diabetes and dietary behaviours or diet quality indices, food groups, foods, beverages, alcoholic beverages, macronutrients, and micronutrients.
Results 53 publications were included, with 153 adjusted summary hazard ratios on dietary behaviours or diet quality indices (n=12), food groups and foods (n=56), beverages (n=10), alcoholic beverages (n=12), macronutrients (n=32), and micronutrients (n=31), regarding incidence of type 2 diabetes. Methodological quality was high for 75% (n=115) of meta-analyses, moderate for 23% (n=35), and low for 2% (n=3). Quality of evidence was rated high for an inverse association for type 2 diabetes incidence with increased intake of whole grains (for an increment of 30 g/day, adjusted summary hazard ratio 0.87 (95% confidence interval 0.82 to 0.93)) and cereal fibre (for an increment of 10 g/day, 0.75 (0.65 to 0.86)), as well as for moderate intake of total alcohol (for an intake of 12-24 g/day v no consumption, 0.75 (0.67 to 0.83)). Quality of evidence was also high for the association for increased incidence of type 2 diabetes with higher intake of red meat (for an increment of 100 g/day, 1.17 (1.08 to 1.26)), processed meat (for an increment of 50 g/day, 1.37 (1.22 to 1.54)), bacon (per two slices/day, 2.07 (1.40 to 3.05)), and sugar sweetened beverages (for an increase of one serving/day, 1.26 (1.11 to 1.43)).
Conclusions Overall, the association between dietary factors and type 2 diabetes has been extensively studied, but few of the associations were graded as high quality of evidence. Further factors are likely to be important in type 2 diabetes prevention; thus, more well conducted research, with more detailed assessment of diet, is needed.
Systematic review registration PROSPERO CRD42018088106.
Introduction
Diabetes mellitus is a global health problem, with a prevalence of 8.8%. Both the incidence and prevalence of the disorder are projected to rise. An estimated 425 million adults are living with diabetes mellitus worldwide.1 Patients with diabetes mellitus are at increased risk for many other health problems, which are associated with high healthcare costs.23 According to the International Diabetes Federation, associated healthcare costs in 2017 were an estimated US$727bn (£574bn; €652bn) worldwide, which is an 8% rise compared with 2015.1 Thus, the prevention and management of this disease is of major importance to public health interest. Type 2 diabetes is the most common type of diabetes mellitus and accounts for 90% of all cases of diabetes.1 Although unmodifiable factors such as family history and age partly have a role in the causal pathway of type 2 diabetes, modifiable factors such as lifestyle factors (including diet) contribute to the onset of the disorder as well.4 Changes in these lifestyle factors could reduce the risk of type 2 diabetes and influence the progression of this disease.567
A large body of research is available on the association between dietary factors and the incidence of type 2 diabetes. In the past few decades, many published systematic reviews and meta-analyses have summarised evidence on the associations between dietary behaviours or diet quality indices, food groups, single foods and beverages, alcohol, specific macronutrients and micronutrients, and the incidence of type 2 diabetes. These findings could be of importance for the prevention of the disease. However, the strength, precision, and influence of potential bias regarding these associations need to be clarified.
Umbrella reviews are useful tools that provide a comprehensive overview of evidence of published systematic reviews and meta-analyses on a specific topic. They can elucidate the strength of evidence and the precision of the estimates, and evaluate risk of bias of the published reports.8 Recent reports summarised evidence for selected dietary factors regarding prevention of type 2 diabetes.91011 Strong evidence was observed for a decreased incidence of type 2 diabetes with higher consumption of whole grains1011 and higher adherence to a healthy dietary pattern,10 as well as an increased incidence of the disease for a higher intake of total red meat,11 processed meat,1011 and sugar sweetened beverages.1011 Micha and colleagues summarised findings with probable or convincing evidence and found a higher incidence of type 2 diabetes with a low intake of whole grain, yogurt, nuts or seeds, and dietary fibre as well as with high consumption of unprocessed red meat, processed meat, foods with a high glycaemic load, and sugar sweetened beverages.9 However, none of these studies focused on any existing evidence between dietary factors (such as dietary behaviours or diet quality indices, food groups, foods and beverages, alcoholic beverages, macronutrients, and micronutrients) and incidence of type 2 diabetes. Furthermore, the methodological quality of the meta-analyses and quality of evidence remain to be assessed by validated tools. Thus, this study aimed to conduct an umbrella review of meta-analyses to gain a systematic, comprehensive overview of the existing evidence of prospective observational studies on dietary factors (including those mentioned above) and incidence of type 2 diabetes in adults and to assess its strength and validity.
Methods
Our protocol has been registered in PROSPERO (CRD42018088106). The systematic literature search was conducted according to the preferred reporting items for systematic reviews and meta-analyses (PRISMA) guidelines.12
Literature search
The systematic literature search was conducted in PubMed, Web of Science, and Embase until August 2018 for meta-analyses of observational studies investigating the association between diet and type 2 diabetes, using a predefined search strategy (supplementary table 1). We did not apply any restrictions or filters. We also screened the reference lists of relevant reviews and meta-analyses. The literature search was conducted by two authors (MN, SS). Disagreements were resolved by consensus.
Selection of meta-analyses
Studies were included if they met the following criteria: (1) included meta-analysis of observational prospective cohort studies in adults with multivariable adjusted summary risk estimates and corresponding 95% confidence intervals, (2) considered the incidence of type 2 diabetes as the outcome, (3) investigated the association of different dietary factors assessed by established dietary assessment instruments (eg, food frequency questionnaires, diet history, 24 hour dietary recalls, and dietary records) with incidence of type 2 diabetes. Eligible dietary factors included:
Dietary behaviours or diet quality indices, including dietary patterns as combinations of nutrients, foods, and beverages. Examples are breakfast skipping for dietary behaviours; glycaemic index, glycaemic load, or potential renal acid load for dietary quality indices; the Healthy Eating Index (HEI), Dietary Approaches to Stop Hypertension (DASH), Mediterranean diet, or vegetarian diet for a priori dietary patterns; and the application of principal component analysis, factor analysis, or reduced rank regression for exploratory-derived dietary patterns
Food groups, foods, and beverages, including dairy products, eggs, meat, fish, fats (eg, butter) and oils, potatoes, whole grain, grains, cereals, rice, legumes, nuts, vegetables, fruit, tea, coffee, sugar sweetened beverages, and alcoholic beverages
Macronutrients (carbohydrates, fats, protein), micronutrients (vitamins, minerals), fibre, and polyphenols.
Studies were excluded if they were primary studies, if no summary estimate was reported (eg, systematic reviews without meta-analysis), if they were pooled analyses of cohorts with individual patient data, or if the meta-analyses considered type 1 diabetes or gestational diabetes as outcome. We also excluded publications reporting on exposure of plasma levels or biomarkers rather than dietary intake. If more than one published meta-analysis on the same association was identified, we chose only one meta-analysis for each exposure to avoid the inclusion of duplicate studies. In that case, we included the one with the largest number of primary studies. If more than one published meta-analysis included the same number of studies, the one with the largest number of people with type 2 diabetes was chosen. If more than one published meta-analysis fulfilled both criteria, the one with more available information (eg, dose-response meta-analysis) was selected.
Data extraction
Data was extracted by one author (MN) and double-checked by a second author (AB). For each published meta-analysis, we extracted the following data: name of the first author, publication year, exposure (including dose of exposure), number of included studies, study design of the primary studies, total number of cases and participants, type of comparison (high v low meta-analysis or dose-response meta-analysis), quality score of primary studies (mean) if reported, publication bias, information on funding, and conflict of interest.
For each primary study included in the published meta-analysis, we extracted the first author’s name, year of publication, exposure (including dose of exposure), number of total cases, number of participants, and hazard ratios that adjusted for the most confounders, along with their 95% confidence intervals, as well as adjustment factors included in the model to check if relevant confounders were accounted for. Based on the literature, the most important potential confounders in the investigation between dietary factors and incidence of type 2 diabetes include age, sex, smoking, physical activity, overweight, and other dietary factors, including total energy intake, alcohol intake, and family history of diabetes.
Assessment of methodological quality
The methodological quality of each included published meta-analysis was evaluated by the validated AMSTAR tool (a measurement tool to assess the methodological quality of systematic reviews).131415 It includes 11 items about the conduct of a meta-analysis, including the literature search, study selection and data extraction, reporting of included and excluded studies, quality assessment of the included studies, statistical methods for the meta-analysis, publication bias, and conflict of interest. Each question can be answered with “yes,” “no,” “can’t answer,” and “not applicable.” A “yes” scores one point, whereas the other answers score 0 points.15 An overall score of at least 8 points was defined as the cutoff value for high quality, 4-7 points as moderate quality, and 3 points or less as low quality.16
Evaluation of quality of evidence
The quality of evidence was evaluated by using a modified version of NutriGrade17 (modifications described in supplementary table 5). It is a numerical scoring system (maximum 10 points), which includes eight items:
Risk of bias, study quality, or study limitations (mean of all primary studies included in the published meta-analysis; 0-2 points)
Precision of the estimate (0-1 points)
Heterogeneity (0-1 point)
Directness (eg, whether there were differences in the study populations or interventions; 0-1 point)
Publication bias (0-1 point)
Funding bias (0-1 point)
Effect size (0-2 points)
Dose-response association (0-1 point).
An overall score of at least 8 points was assigned to high quality of evidence, which means that there is high confidence in the effect estimate and that further research probably will not change that confidence in the effect estimate. An overall score of 6 to <8 points was assigned to moderate confidence in the effect estimate, where further research could add evidence on the confidence and could change the effect estimate. An overall score of 4 to <6 points meant that there was low confidence in the effect estimate, and that further research would provide important evidence on the confidence and would likely change the effect estimate. Scores less than 4 points was assigned to very low quality of evidence, which meant that the quality of evidence was very limited and uncertain.17 Therefore, the quality of evidence for an association could be high despite possible shortcomings (eg, high heterogeneity and indication for publication bias) if the meta-analysis scores the maximum amount of points for the other items.
Data analysis
Assessment of summary effects
For each exposure, we recalculated the chosen meta-analysis using hazard ratios of the primary studies included in the published meta-analyses that adjusted for the most confounders. We recalculated the adjusted summary hazard ratios and corresponding 95% confidence intervals by using the random effects model by DerSimonian and Laird, which takes into account heterogeneity both within and between studies.18 We used this approach to ensure that all adjusted summary hazard ratios were calculated by a random effects model and to receive further information for the evaluation of the quality of evidence (including τ2, 95% prediction intervals, I2, and publication bias). Since this method has been used in previous meta-analyses, we chose this approach to ensure comparability with the published meta-analyses.
When the published meta-analysis presented hazard ratios from the same cohort separately by sex or race, we first combined the hazard ratios per cohort using fixed effect methods, before conducting the overall meta-analysis. If the published meta-analysis included retrospective case-control studies or cross sectional studies as well as prospective cohort studies, we only included results from the prospective cohort studies in our meta-analysis. If the published meta-analysis included a primary study only reporting unadjusted estimates, this study was excluded from the reanalysis. We recalculated dose-response meta-analyses if the dose-response estimate for each primary study was presented separately. If this information was missing, we could not recalculate the dose-response meta-analysis, but extracted the adjusted summary hazard ratios from the published meta-analysis. If the 95% confidence interval of an adjusted summary hazard ratio included the null value and the quality of evidence was moderate, low, or very low, this was interpreted as no clear association. If the quality of evidence was high, the adjusted summary hazard ratio of 1.0 (or close to 1.0, respectively), and the 95% confidence interval of the adjusted summary hazard ratios was very narrow and included the null value, we assumed that an association was unlikely. All calculations were conducted with Stata 14.1.
Assessment of heterogeneity
In each meta-analysis, we evaluated heterogeneity by using the I2 statistic. The I2 value ranges from 0% to 100% and represents the percentage of the total variation across studies that can be explained by heterogeneity.19 However, I2 is dependent on the study size (it increases with increasing study size). Therefore, we also calculated τ2, which is independent of study size and describes variability between studies, in relation to the risk estimates.20 Finally, we calculated 95% prediction intervals, which also account for heterogeneity and show the range in which the underlying true effect size of future studies will lie with 95% certainty.20
Assessment of publication bias and small study effect
Publication bias and small study effects were assessed for each meta-analysis by graphical and statistical tests, namely the funnel plot and Egger’s test.2122 Therefore, the primary studies from the meta-analyses included in our umbrella review, were plotted. A P value less than 0.10 was taken as statistical evidence of the presence of small study effects (potential publication bias).22
Patient and public involvement
This research was done without patient involvement. Patients were not invited to comment on the study design and were not consulted to develop patient relevant outcomes or interpret the results. Patients were not invited to contribute to the writing or editing of this document for readability or accuracy. The results of this study will be disseminated to the public through a press release, published at the website of the German Diabetes Centre, the web based information platform of the National Diabetes Information Centre (https://diabetesinformationsdienst.de) and our partners, including the German Centre for Diabetes Research (Deutsches Zentrum für Diabetesforschung: DZD) and the Leibniz Association. In addition, findings will be spread via social media.
Results
Of the 11 413 publications initially identified, we finally selected 53 published meta-analyses including 153 adjusted summary hazard ratios (supplementary figure 1) on dietary behaviours or diet quality indices (n=12), food groups and foods (n=56), beverages (n=10), alcoholic beverages (n=12), macronutrients (n=32), and micronutrients (n=31), regarding incidence of type 2 diabetes. These 153 adjusted summary hazard ratios correspond to one meta-analysis per exposure. If a high versus low meta-analysis as well as a dose-response meta-analysis was available for one exposure, we presented the dose-response meta-analysis. A list of excluded studies can also be found in supplementary table 2.
We found meta-analyses on the following exposures: healthy dietary pattern,23 unhealthy dietary pattern,24 HEI,25 alternative HEI (AHEI),25 DASH,25 Mediterranean diet,26 vegetarian diet,27 low carbohydrate diet,28 breakfast skipping,29 high glycaemic index,30 high glycaemic load,30 dietary acid load,31 dairy11 and dairy products,323334 chocolate,35 eggs,11 meat36 and specific types of meat,36373839 total fish or seafood1140 and types of fish,40 butter,41 olive oil,42 potatoes and types of potatoes,43 whole grain11 and whole grain products,44 refined grain,11 rice,45 white rice,44 brown rice,44 soy products,46 legumes,11 nuts,11 fruit and vegetables,47 total fruit11 and specific types of fruit,484950 total vegetables11 and specific types of vegetables,5152 tea,53 coffee,5455 sugar sweetened beverages,56 artificially sweetened beverages,56 total fruit juice56 and types of fruit juice,57 total protein and types of protein,58 animal protein-to-potassium ratio,31 total fat,59 types of fat59 and fatty acids,59606162 dietary cholesterol,63 carbohydrates59 and types of carbohydrates,5964 total fibre65 and types of fibre,65 vitamin D,66 niacin,67 iron,68 magnesium,69 calcium,70 selenium,71 polyphenols and subgroups of polyphenols72 and antioxidants,73 as well as total alcohol,74 wine, beer, and spirits.75
Description of published meta-analyses
For most exposures, we identified more than one published meta-analysis on the same topic in our search. These published meta-analyses were in agreement regarding the direction and magnitude of the adjusted summary hazard ratios (data not shown, but available on request), because they usually included the same primary studies with an update of one or two additional primary studies. Exceptions were two published meta-analyses on egg intake and incidence of type 2 diabetes from 2013, which found a moderate association for an increased incidence of the disease in a high versus low meta-analysis and for an increase of four eggs/week,7677 by contrast with more recently published meta-analyses that did not find an association.117879 All published meta-analyses included primary studies from the United States, Europe, and Asia or Australia. All included primary studies (n=277) conducted multivariable adjustment with 22% (n=62) using multivariable logistic regression and 78% (n=215) using the Cox proportional hazard regression model. In 49% (n=106) of these studies, the proportional hazard assumption was evaluated and no violations were observed, while 51% (n=109) of the studies did not provide any information about the evaluation of the assumption.
Almost all of the primary studies (90%) adjusted for age (n=254) and sex (n=249), 88% (n=243) for smoking, 86% for body mass index (n=239) and for physical activity (n=238), 67% (n=184) for total energy intake, 65% (n=181) for alcohol intake, 60% (n=167) for other dietary factors and cardiovascular risk factors (eg, hypertension), and 52% (n=143) for family history of diabetes. Three primary studies only reported unadjusted estimates and were therefore excluded from the meta-analyses on milk,80 total coffee,80 and total alcohol,8182 which did not affect the results. Information on linearity of the dose-response relations (eg, P for non-linearity) were available for 72% (n=67) of the dose-response meta-analyses (n=93). A third of these dose-response relations indicated non-linearity (potential renal acid load, yogurt, ice cream, chocolate, processed meat, olive oil, whole grain, total grains, whole grain bread, whole grain cereals, wheat bran, brown rice, total fruit, apples and pears, total vegetables, cereal fibre, fruit fibre, vegetable fibre, magnesium, and anthocyanins).
Methodological quality
Overall scores of AMSTAR for each published meta-analysis are shown in supplementary table 3, with the single items summarised in supplementary table 4. The conduct of the meta-analyses was rated as high (≥8 points) for 75% (n=115) of the published meta-analyses, moderate (4-7 points) for 23% (n=35), and low (0-3 points) for 2% (n=3).36 In the report with the low methodological quality, the methods section was completely missing and thus the methodological quality was rated as low.36 In general, main flaws were that grey literature was not accounted for in the literature search, no list of excluded studies was provided, study quality was not assessed or the influence of the quality of the individual studies on the results was not discussed, and publication bias was not assessed.
Associations and quality of evidence between dietary factors and incidence of type 2 diabetes
Adjusted summary hazard ratios and the quality of evidence for each exposure are summarised in figure 1, figure 2, figure 3, figure 4, figure 5, and figure 6and are reported in supplementary table 3. The grading of every item of NutriGrade is shown in supplementary table 5. In total, the evidence was graded as high for 5% (n=7) of the associations. Moderate, low, and very low quality of evidence was found for 22% (n=33), 60% (n=92), and 14% (n=21) of the associations, respectively.

Adjusted summary hazard ratios (SHR) with 95% confidence intervals and quality of evidence for association between dietary behaviours or diet quality indices and incidence of type 2 diabetes. Data are based on results from 53 published meta-analyses selected for umbrella review. AHEI=alternative healthy eating index; DASH=dietary approach to stop hypertension; HEI=healthy eating index; NA=not available. Cases refer to individuals with type 2 diabetes. *Includes Mediterranean diet, DASH, AHEI, and healthy dietary patterns derived from principal component analysis. †Summary hazard ratio extracted from published meta-analysis, no reanalysis possible

Adjusted summary hazard ratios (SHR) with 95% confidence intervals and quality of evidence for association between food groups and foods and incidence of type 2 diabetes. Data are based on results from 53 published meta-analyses selected for umbrella review. S=serving; NA=not available. *Summary hazard ratio extracted from published meta-analysis, no reanalysis possible

Adjusted summary hazard ratios (SHR) with 95% confidence intervals and quality of evidence for association between beverages and incidence of type 2 diabetes. Data are based on results from 53 published meta-analyses selected for umbrella review. *Summary hazard ratio extracted from published meta-analysis, no re-analysis possible. †Total fruit juice=fruit juices with added sugar and without added sugar; 100% fruit juice=fruit juice without added sugar; sugar sweetened fruit juice=fruit juice with added sugar; fruit juice, not specified=type of fruit juice (with or without added sugar) was not specified in these studies; s=serving; G=group (based on the range divided by quintiles)

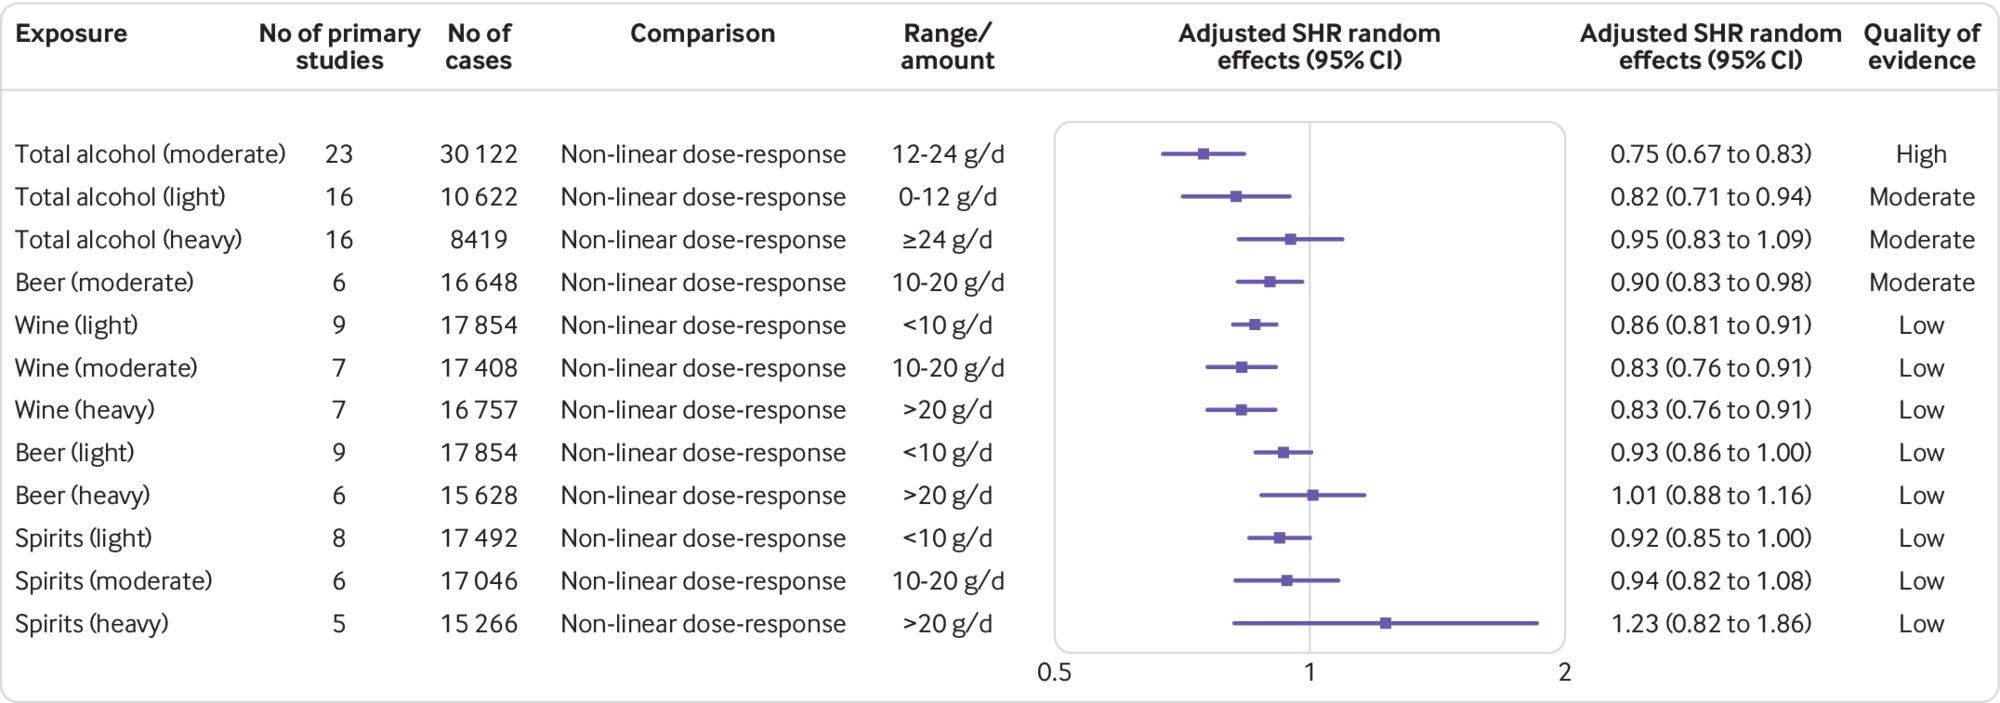
Adjusted summary hazard ratios (SHR) with 95% confidence intervals and quality of evidence for association between total alcohol and alcoholic beverages and incidence of type 2 diabetes. Data are based on results from 53 published meta-analyses selected for umbrella review

Adjusted summary hazard ratios (SHR) with 95% confidence intervals and quality of evidence for association between macronutrients and incidence of type 2 diabetes. Data are based on results from 53 published meta-analyses selected for umbrella review. *Summary hazard ratio extracted from published meta-analysis, no re-analysis possible. EPA=eicosapentaenoic acid, DHA=docosahexaenoic acid, G=group (based on the range divided by quintiles); NA=not available

Adjusted summary hazard ratios (SHR) with 95% confidence intervals and quality of evidence for association between micronutrients and incidence of type 2 diabetes. Data are based on results from 53 published meta-analyses selected for umbrella review. *Summary hazard ratio extracted from published meta-analysis, no reanalysis possible. IU=international units; NA=not available
Dietary behaviours or diet quality indices
Figure 1 shows the adjusted summary hazard ratios with their corresponding 95% confidence intervals and the quality of evidence for the associations between dietary behaviours or diet quality indices and the incidence of type 2 diabetes. No association was rated with high quality of evidence. Higher versus lower adherence to a healthy dietary pattern and the AHEI was associated with a decreased incidence of type 2 diabetes with moderate quality of evidence. The associations between diets with a high potential renal acid load and high glycaemic load, as well as an unhealthy dietary pattern, which was derived from reduced rank regression, and increased incidence of type 2 diabetes were also rated with moderate quality of evidence. The quality of evidence for the associations between the other dietary patterns (HEI, DASH, Mediterranean diet, vegetarian diet, consumption of foods with a high glycaemic index, breakfast skipping, and a low carbohydrate diet) and incidence of type 2 diabetes were rated as low to very low.
Food groups, foods, and beverages
Figure 2 shows the adjusted summary hazard ratios with their corresponding 95% confidence intervals and the quality of evidence for the associations between food groups and foods and the incidence of type 2 diabetes. High quality of evidence was found for an inverse association of type 2 diabetes, whereby an increased intake of whole grain was associated with a reduced incidence of the disease (for an increment of 30 g/day, adjusted summary hazard ratio 0.87 (95% confidence interval 0.82 to 0.93)). We also found an increased incidence of type 2 diabetes for higher intake of red meat (for an increment of 100 g/day, 1.17 (1.08 to 1.26)), processed meat (for an increment of 50 g/day, 1.37 (1.22 to 1.54)), and bacon (per two slices/day, 2.07 (1.40 to 3.05)), from evidence rated as high quality. The inverse association between chocolate, wheat bran, yogurt, and total dairy and the incidence of type 2 diabetes for dose-response meta-analyses were rated with moderate quality of evidence. The association between increased incidence of the disease and total meat, white rice, processed red meat, french fries, and hot dogs for dose-response meta-analyses were also found from evidence rated as moderate quality.
We observed no clear association with moderate quality of evidence between total vegetables, total fruit, and refined grain and the incidence of type 2 diabetes. Low quality of evidence was found between yellow vegetables and oily fish and incidence of type 2 diabetes (comparing high v low intakes). Furthermore, low quality evidence was found for dose-response meta-analyses of whole grain cereals, whole grain bread, total grains, brown rice, olive oil, ice cream, berry fruits, and apples and pears, which were associated with decreased incidence of the disease. Low quality evidence was also found for dose-response meta-analyses of boiled/baked/mashed potatoes, hamburgers, and total potatoes, which were associated with increased incidence. No clear association with low to very low quality of evidence was shown for the association for incidence of type 2 diabetes with nuts, cruciferous vegetables, fermented dairy products, butter, low fat dairy products, fruits and vegetables, green leafy vegetables, high fat dairy products, wheat germ, cream, high fat milk, milk, sherbet, cheese, legumes, low fat milk, fish, lean fish, shellfish, poultry, eggs, total fish or seafood, unprocessed red meat, rice, soy products, cottage cheese, and citrus fruits.
For beverages, quality of evidence was high for an increased incidence of type 2 diabetes with higher intake of sugar sweetened beverages (for an increase of one serving/day, adjusted summary hazard ratio 1.26 (95% confidence interval 1.11 to 1.43); fig 3). The inverse association in dose-response meta-analyses between caffeinated coffee, decaffeinated coffee, and total coffee and the incidence of type 2 diabetes, as well as the increased incidence of type 2 diabetes with higher intake of artificially sweetened beverages in dose-response meta-analyses, were rated with moderate quality of evidence. Total fruit juice and sugar sweetened fruit juice were associated with an increased incidence of type 2 diabetes with low quality of evidence in dose-response meta-analyses and in meta-analyses comparing high versus low intake, respectively. No clear associations were found for 100% fruit juice and unspecified fruit juice, and rated with very low quality of evidence.
Alcoholic beverages
Figure 4 shows the adjusted summary hazard ratios with their corresponding 95% confidence intervals and the quality of evidence for the associations between alcoholic beverages and incidence of type 2 diabetes. Moderate intake of total alcohol was inversely associated with incidence of the disease with high quality of evidence (for 12-24 g/day v no alcohol consumption, adjusted summary hazard ratio 0.75 (95% confidence interval 0.67 to 0.83)). The associations between light intake of total alcohol and moderate consumption of beer and increased incidence of type 2 diabetes were rated with moderate quality of evidence. We saw no clear association between heavy intake of total alcohol and incidence of the disease, with moderate quality of evidence. Low quality of evidence was found for the inverse association of any intake of wine with incidence of type 2 diabetes; and for no clear association of light and heavy beer intake, and of any intake of spirits with type 2 diabetes incidence.
Macronutrients and micronutrients
Figure 5 shows the adjusted summary hazard ratios with their corresponding 95% confidence intervals and the quality of evidence for the associations between macronutrients and the incidence of type 2 diabetes. The inverse association between cereal fibre and incidence of the disorder (for an increment of 10 g/day, adjusted summary hazard ratio 0.75 (95% confidence interval 0.65 to 0.86)) was rated with high quality of evidence. Moderate quality of evidence was found for vegetable fat and total fibre, which were associated with a decreased incidence of type 2 diabetes in meta-analyses comparing high versus low intake and in dose-response meta-analyses, respectively; and for total protein, animal protein-to-potassium ratio, and animal protein, which showed an association with increased incidence of disease. Low quality evidence was found for an inverse association between incidence of type 2 diabetes for ruminant trans-fatty acids in meta-analyses comparing high versus low intake, and insoluble fibre and sucrose in dose-response meta-analyses, as well as for cholesterol, which was associated with increased incidence of the disease. No clear association (with low to very quality of evidence) was shown for soluble fibre, plant protein, polyunsaturated fatty acids, alpha linolenic acid, total fat, monounsaturated fatty acids, animal fat, total omega-3 fatty acids, eicosapentaenoic acid and docosahexaenoic acid (alone and in combination), total carbohydrates, total sugars, maltose, total omega-6 fatty acids, saturated fat, lactose, fructose, trans-fatty acids, and glucose.
For the micronutrients (fig 6), no association was rated with high quality of evidence. Moderate quality of evidence was observed for the inverse association between magnesium intake and incidence of type 2 diabetes in dose-response meta-analyses. Total polyphenols, calcium, and catechin were associated with decreased incidence of type 2 diabetes in meta-analysis comparing high versus low intake. In dose-response meta-analyses, phenolic acids, caffeine, and anthocyanins were also associated with decreased incidence of type 2 diabetes, but these associations were rated with low quality of evidence. Evidence on the association of haem iron with increased incidence the disease was also of low quality. No clear association (with low to very low quality of evidence) was found for stilbenes, flavanols, proanthocyanids, myricetin, flavonoles, flanovoids, flavan-3-ols, kaempferol, daidzein, isoflavones, quercetin, genistein, total iron, flavanones, flavones and lignans, vitamin D, lycopene, dihydrochalcones, luteolin, and other polyphenols. Vitamins C and E were inversely associated with incidence of type 2 diabetes but with very low quality of evidence.
Heterogeneity between primary studies
I2, τ2, and 95% prediction intervals are reported in supplementary table 3. For 24% (n=36) and 29% (n=44) of the meta-analyses, τ2 and the 95% prediction intervals could not be recalculated, respectively. As for the 95% prediction intervals, only 5% (n=8) of the meta-analyses excluded the null value—that is, high versus low adherence meta-analyses of healthy dietary patterns, unhealthy dietary patterns, and breakfast skipping and the dose-response meta-analyses of apples and pears, total coffee, artificially sweetened beverages, any wine intake, and magnesium. This result indicates that in future studies, the true effect size on these exposures is expected to point to the same direction. However, for most of the findings, the true effect size of future studies could be null or small in some populations.
Publication bias and small study effects
Our results indicated the presence of small study effects (potential publication bias) according to Egger’s test (P<0.10) for rice, soy products, monounsaturated fatty acids, total carbohydrates, vitamin D, and flavanones in meta-analyses comparing high versus low intake. The presence of these effects were also indicated for total dairy, low fat milk, total coffee, beer (light consumption), and cereal fibre from dose-response meta-analyses (supplementary table 3).
More than 10 primary studies were available for 20% (n=30) of the funnel plots, between five and 10 were available for 40% (n=61), and fewer than five were available for 40% (n=62). The funnel plots (supplementary figures 2-19) indicated small study effects for eight associations, including the dose-response relation between incidence for type 2 diabetes and low fat dairy (supplementary figure 3b), ice cream (supplementary figure 3l), and wine (light consumption; supplementary figure 13d); and the high versus low adherence meta-analyses of AHEI (supplementary figure 2d), DASH (supplementary figure 2e), breakfast skipping (supplementary figure 2i), soy products (supplementary figure 9e), and vitamin D (supplementary figure 18a).
Discussion
Principal findings
The influence of dietary behaviours or diet quality indices, food groups, foods, beverages, alcoholic beverages, macronutrients, and micronutrients on the incidence of type 2 diabetes has been examined in many published meta-analyses. In this umbrella review, we provided a broad overview of the existing evidence and evaluated the methodological quality of the meta-analyses and quality of evidence for all these associations.
We included 53 published meta-analyses, which comprised 153 adjusted summary hazard ratios for different dietary factors and incidence of type 2 diabetes. The methodological quality was high for most of the published meta-analyses. The quality of evidence was graded as high only for whole grain, cereal fibre, and moderate consumption of total alcohol, which decreased the incidence for type 2 diabetes; and for red meat, processed meat, bacon, and sugar sweetened beverages, which increased the incidence for the disease. For the other associations, the quality of evidence was moderate, low, or very low, which might be explained by the high proportion of meta-analyses that included fewer than five studies, had high heterogeneity, or had moderate effect sizes.
Comparison with other studies
Our umbrella review supports existing guidelines, and adds evidence in several aspects. Recommendations for higher intake of whole grain products, high fibre intake, and avoiding products with a high glycaemic index are included in the guidelines and reviews.67838485 This information accords with our results that higher intake of whole grain products and total fibre intake was associated with a decreased incidence of type 2 diabetes, for which we found high and moderate quality of evidence, respectively. Although intake of foods with a high glycaemic index was associated with an increased incidence of type 2 diabetes in our umbrella review, quality of evidence was only low and further investigation is needed. Furthermore, the source of fibre seems to be important; we found high quality evidence that cereal fibre is associated with a decreased incidence of type 2 diabetes, while fruit fibre and vegetable fibre were not significantly associated with incidence of the disease.
Our findings confirm recommendations for higher intake of yogurt,84 coffee,6784 tea784 and vegetable fat,6 and we observed a decreased incidence of type 2 diabetes with moderate quality of evidence for these associations. The American Diabetes Association recommends a higher intake of berry fruits,84 for which we also found an inverse association with incidence of type 2 diabetes, but the quality of evidence was low, indicating that more studies are needed. Our results also confirmed the adverse association of red meat, processed meat products,784 and sugar sweetened beverages784 with incidence of type 2 diabetes, with a high quality of evidence. Moreover, we found high quality of evidence for an association between bacon, a type of processed meat, with increased incidence of type 2 diabetes. Our overview also showed associations between dietary patterns and incidence of type 2 diabetes, which are consistent with the results for some of the individual nutrients, foods, and food groups.
However, our findings did not indicate a beneficial association of incidence of type 2 diabetes with higher intake of low fat dairy products,86 fruit and vegetables,6784 green leafy vegetables,7 nuts,6784 and single unsaturated fatty acids (eg, omega-3 fatty acids),684 or an adverse association with saturated fatty acids7 or trans-fatty acids.6 Nevertheless, we observed a decreased disease incidence with high intake of vegetable fat and a decreased incidence with healthy dietary patterns, which were partly characterised by a high ratio of unsaturated fatty acids to saturated fatty acids.
Only one of the guidelines mentions alcohol in their recommendations, which states that there is evidence that moderate consumption of alcohol lowers incidence of type 2 diabetes.6 We found high quality of evidence for an inverse association between moderate total alcohol consumption and incidence of type 2 diabetes. Although we also observed a reduced incidence of type 2 diabetes with moderate consumption of wine and beer, quality of evidence for these associations was low and moderate, respectively.
In a previous review, Ley and colleagues summarised findings from primary studies and meta-analyses on dietary patterns, food groups and foods, beverages, and macronutrients and micronutrients regarding incidence of type 2 diabetes. However, this report was not a systematic review but only a narrative review, and the authors did not evaluate the validity and quality of evidence of the included meta-analyses.83 We came to similar conclusions, with some exceptions, concerning the beneficial association between omega-6 fatty acids and nuts and the incidence of type 2 diabetes.83 In their review, Micha and colleagues found probable or convincing evidence for an association with incidence of type 2 diabetes for low consumption of nuts, whole grain, and dietary fibre, as well as high consumption of unprocessed red meat, processed red meat, and foods with a high glycaemic load.9 These results mostly accord with our findings, apart from the beneficial association of nuts and the harmful association of unprocessed red meat with incidence of type 2 diabetes. Conflicts could be explained by the inclusion of different primary studies. While Micha and colleagues included a meta-analysis with both randomised controlled trials and observational studies, our report only focused on observational studies.87 In addition, the Micha meta-analysis missed one primary study that reported an increased incidence of type 2 diabetes with higher intake of nut intake,88 which resulted in a decreased but not statistically significant summary estimate in our report.
In their umbrella review, Bellou and colleagues summarised findings from meta-analyses on the association between different risk factors (including selected dietary factors) and incidence of type 2 diabetes. However, they conducted their literature search up to February 2016,10 and our umbrella review included more recent meta-analyses (eg, nuts, processed meat, red meat, whole grain). Furthermore, we included more exposures (153 v 53). While Bellou and collagues also evaluated epidemiological credibility, they used a different tool for their evaluation.10 Therefore, our results differed from their evaluation in several aspects (eg, for processed meat and red meat), but were similar in relation to whole grain and sugar sweetened beverages.
Possible explanations
Individuals who have unhealthy dietary behaviours (such as low intake of whole grains and fibre and high intake of red and processed meat) are likely to have an unhealthier lifestyle, such as higher rates of obesity, smoking, and physical inactivity.899091 However, 87% of the primary studies included in the present review had adjusted for smoking and 86% for body mass index and for physical activity in multivariable regression models, and the associations persisted. Nevertheless, residual confounding cannot be ruled out, perhaps particularly in the analysis of artificially sweetened beverages, where obese individuals could have switched from sugar sweetened beverages to artificially sweetened beverages to lose weight. This behavioural change might explain the association observed before adjustment for body mass index and the attenuation of the association with body mass index adjustment.56
For both whole grain and cereal fibre, high quality of evidence indicated an inverse association with incidence of type 2 diabetes. This beneficial effect could be partly explained by their high content in phytochemicals, vitamins, and minerals, which are lost in the production process of refining grains.44659293 High intake of whole grain and cereal fibre has been associated with greater insulin sensitivity, lower fasting insulin concentrations,939495 and lower concentrations of inflammatory markers such as C reactive protein,96979899100 which could increase incidence for type 2 diabetes101; and higher concentrations of the cytokine adiponectin, which is associated with a reduced incidence.101102
A recent meta-analysis of randomised controlled trials showed acute beneficial effects for an intervention with increased whole grain consumption compared with control meals (including mainly white wheat bread) on postprandial glucose and insulin response,103 which reduces pancreas exhaustion.104105 However, in medium and long term randomised controlled trials, the intervention of increased whole grain consumption had no effect on fasting glucose, fasting insulin, and insulin resistance compared with the control diet. Nevertheless, when randomised controlled trials with people at increased risk for type 2 diabetes were excluded, fasting glucose was lower in the intervention group than in the control group.103 High intake of whole grains has been associated with reduced weight gain over time.106 In a previous meta-analysis, adjustment for body mass index attenuated the association between whole grain intake and type 2 diabetes risk by 33-50%,44 suggesting that reduced adiposity might be an important mechanism by which whole grain consumption reduces type 2 diabetes risk. Therefore, randomised controlled trials103 could have found weak effects of whole grain intake and intermediate risk factors, because the trials could have been too short to observe an effect of whole grain intake on weight loss.
High quality of evidence was also observed for the positive association between incidence of type 2 diabetes and red meat, processed meat, and bacon. In a pooled analysis of 14 studies, the consumption of processed meat and unprocessed red meat was associated with higher fasting glucose and fasting insulin levels,107 and some studies96108109 but not all107 have reported similar results as well as associations with C reactive protein, ferritin, glycated haemoglobin, and gamma-glutamyl transferase.96109 In some of these studies, associations were attenuated when adjusted for body mass index,96108109 which is consistent with the much stronger associations reported between type 2 diabetes and intake of unprocessed and processed red meat in analyses unadjusted for body mass index than when adjusted for body mass index.39110111 Given that both unprocessed and processed red meat has been associated with weight gain over time,106112 increased weight gain could be an important mechanism by which meat intake increases incidence of type 2 diabetes. Although the association with unprocessed red meat was not statistically significant in a meta-analysis from 201336, this finding needs to be interpreted with caution. Of cohort studies that have since been published,113114115116117118 most with the larger cohorts found an increased risk also with unprocessed red meat.113114115116 Processed meat contains high amounts of sodium that could cause microvascular dysfunction and increase incidence of type 2 diabetes.119120121 Processed meat also contains nitrates, nitrites, and their by-products (eg, peroxynitrite), which could have a role in the pathogenesis of type 2 diabetes.122 Another possible explanation is the high content of haem iron in meat and meat products, which has been shown to be associated with an increased incidence of type 2 diabetes.68 Iron has strong pro-oxidative capacities, which might damage pancreatic cells.123 Furthermore, meat contains high amounts of advanced glycation end products,124 which can be absorbed into the body and have been shown to increase inflammatory markers.125126
Additionally, we found high quality evidence for an increased incidence of type 2 diabetes with sugar sweetened beverages. Although these beverages are a major risk factor for weight gain and obesity,127 other mechanisms other than the influence of overweight and obesity on incidence of type 2 diabetes are physiologically plausible. Sugar sweetened beverages, such as sugar containing lemonades, can have a high glycaemic index,128 which is related to an increase in blood sugar levels and associated with increased incidence of type 2 diabetes.104105 However, beverages that are high in fructose or isomaltulose, a slowly absorbable disaccharide used in sports drinks, have a lower glycaemix index.129 A randomised controlled trial compared two intervention groups consuming 20% of their energy requirement in form of beverages sweetened with isomaltulose (low glycaemic index) and maltodextrin (high glycaemic index). The insulin response was lower and insulin sensitivity was better preserved in the group consuming beverages with a low glycaemic index than in the group consuming beverages with a high glycaemic index.129 However, fructose that might be contained in these beverages increases hepatic lipogenesis and insulin resistance.130 Another randomised controlled trial compared interventions of four servings/day of sugar sweetened, fructose sweetened, and aspartame sweetened beverages for eight days. Ad libitum energy intake was significantly increased in the sugar and fructose groups compared with the aspartame group, with no difference between the first two groups. However, since all groups received the same standard diet, the excess calories in the sugar sweetened and fructose sweetened beverages possibly contributed to the increased calorie intake in those groups.131
Nevertheless, high intake of sugar in liquid form seems to have a role in the association of sugar sweetened beverages with incidence of type 2 diabetes. Sugar containing liquids have been shown to negatively affect the regulation of hunger and satiety as opposed to sugar containing solid foods.132 However, in our umbrella review, a surprising result was found for sucrose, which was associated with a decreased incidence of type 2 diabetes, based on evidence that was of moderate quality. The reason for this relation is not yet clear, although it might be because sweetened beverages are not the only source of sucrose. Sucrose is also a component of grains and dairy products, which are associated with a decreased incidence of type 2 diabetes.64 Furthermore, the reason could lie in the influence of energy misreporting, as shown by Gottschald and colleagues.133 The researchers found an inverse association between intake of high sucrose foods (cakes and cookies) and cardiometabolic disease risk factors in the European Prospective Investigation into Cancer and Nutrition (EPIC)-Potsdam study. However, the association diminished after the researchers adjusted for energy misreporting.133
We found high quality evidence for an inverse association between moderate alcohol consumption and incidence of type 2 diabetes. Results from observational studies suggested that light or moderate alcohol consumption increases insulin sensitivity.134135136 However, a meta-analysis of randomised controlled trials comparing moderate alcohol consumption (including wine, beer, and spirits) with no alcohol consumption only confirmed this result for women. No effect on insulin sensitivity was found for men. Nevertheless, moderate alcohol intake decreased fasting insulin concentrations and glycated haemoglobin.137 The sex specific effect was also confirmed by the meta-analysis by Li and colleagues. which showed a stronger inverse association with incidence of type 2 diabetes for women than for men, although both associations were statistically significant.74 Results from a randomised controlled trial comparing the effect of red wine, dealcoholised red wine, and gin on glucose homeostasis suggested that the non-alcoholic fraction of red wine (mainly the polyphenols) contributes to possible beneficial effects of red wine on plasma insulin and the homeostatic model assessment for insulin resistance.138 This possible effect is supported by our findings that especially wine was inversely associated with incidence of type 2 diabetes. However, alcohol causes adverse health effects such as liver cirrhosis, which increases incidence of type 2 diabetes.139 Given the U shaped association of total alcohol and alcoholic beverages with incidence of the disease, the risk for alcohol abuse, and other adverse health effects of alcohol (eg, increased risk for certain types of cancer),140 translation of these results into recommendations have to be considered carefully.
In terms of internal consistency, we observed that related exposures showed the same direction of the association with incidence of type 2 diabetes. For example, a healthy dietary pattern (characterised, amongst others, by a high intake of whole grain products and low intake of red and processed meat) and high consumption of whole grain products, fibre, and magnesium were all associated with a reduced incidence of the disease. Accordingly, an unhealthy dietary pattern and high consumption of red meat, processed meat (eg, bacon), animal protein, and haem iron were related to an increased disease incidence. However, as explained above, the role of unprocessed red meat regarding incidence of type 2 diabetes needs further investigation.
The results on caffeinated and decaffeinated coffee and caffeine warrant further discussion. Both caffeinated and decaffeinated coffee were associated with a decreased incidence of type 2 diabetes, suggesting that caffeine does not have a major role in the health effect of coffee on the disease. Nevertheless, caffeine was also observed to decrease type 2 diabetes incidence. All associations were graded as moderate quality of evidence. Although caffeine has been discussed to have beneficial properties (eg, increase insulin sensitivity141), the results are difficult to interpret because of the strong correlation with coffee consumption.55 Therefore, caffeine might act as a marker for coffee intake, which contains several beneficial compounds (eg, chlorogenic acid and antioxidants) that contribute to the reduction of type 2 diabetes incidence.55 Since decaffeinated coffee showed a similar association with incidence of type 2 diabetes as caffeinated coffee, it seems plausible that these other bioactive compounds in coffee mainly contribute to the reduction of type 2 diabetes incidence with coffee consumption.
In general, diet is a complex combination of foods and nutrients that act synergistically.142 In this umbrella review, dietary patterns were all associated with the incidence of type 2 diabetes, but the quality of evidence for dietary patterns was moderate. To account for the full spectrum of the association between diet and the disease, future studies could investigate a dietary score, including all important aspects of a healthy diet that have been identified to have a role in the risk of type 2 diabetes. This approach might be more predictive of disease risk than the investigation of single foods and nutrients.142 For example, a strong reduced risk of the disease (reduction by 52%, 95% confidence interval 14% to 73%) was identified for the adherence to the Mediterranean diet (supplemented with either extra virgin olive oil or mixed nuts) compared with a control diet (advice to reduce only dietary fat) in the PREDIMED trial.143 Thus, to give accurate recommendations regarding diabetes prevention, it is important to identify the optimal diet(s).
Strengths and limitations
Our umbrella review had several strengths. It provides a systematic, comprehensive overview of the evidence from all published meta-analyses regarding the role of dietary factors in the prevention of type 2 diabetes. We also evaluated the methodological quality and quality of evidence by using validated tools.13141517 In this context, most of the included meta-analyses were of high methodological quality. Furthermore, internal inconsistencies were uncovered and relevant research directions could therefore be identified.
This umbrella review also had several limitations. For 36 of the 96 dose-response meta-analyses, recalculation was not possible, because no single effect estimates were reported. But authors stated that the dose-response associations were estimated by random effects meta-analyses.3135373844485354606172 However, we could not calculate τ2 and 95% prediction intervals for these associations because of missing values. We also resumed the doses defined in the published meta-analyses; therefore, they are not standardised and the doses have to be considered when interpreting the results. For example, the serving sizes defined for total sugars, sucrose, and fructose were large and the summary risk estimate might be smaller with a smaller serving size. Additionally, information on linearity (eg, P for non-linearity) of the dose-response relations were available for 72% of the dose-response meta-analyses. A third of these dose-response relations indicated non-linearity. To derive recommendations, further investigation is needed to set optimal cutoff points. Furthermore, to ensure comparability with previous meta-analyses, we used the random effects approach by DerSimonian and Laird18 for the calculation of the adjusted summary hazard ratios and their corresponding 95% confidence intervals. However, future meta-analyses should use the Hartung-Knapp approach, which gives a better reflection of the uncertainty in the variance between studies, expressed by wider confidence intervals.144
The included primary studies were based on an observational prospective study design, which is prone to biases such as confounding. Nevertheless, the most important confounders were adjusted for in most of the primary studies (90% for age and sex, 87% for smoking, and 86% for body mass index and for physical activity). However, residual confounding cannot be completely ruled out. For example, only 52% of the studies adjusted for family history of diabetes, which should be included in the adjustment model of future studies. Additionally, only 49% of the primary studies that used Cox proportional hazard regression evaluated the proportional hazard assumption and found no violation, while the other 51% provided no information about the evaluation of the assumption. Thus, it remained unclear whether the assumption was fulfilled or violated in those studies. Future studies should report on the evaluation of the assumption of the according statistical method. As the included primary studies were prospective studies, risk of recall bias was avoided and selection bias was reduced. Randomised controlled trials, which reduce risk of biases such as confounding, are scarce in research on diet-disease associations because large sample size trials with long follow-up periods are expensive to conduct,6 and long term adherence can be a challenge in trials of major dietary changes.
We did not explore subgroup analysis (eg, by sex, geographical locations, or adjustment factors such as body mass index) or sensitivity analysis (eg, exclusion of studies at high risk of bias). For example, regarding total omega-3 fatty acids and incidence of type 2 diabetes, differences between US, Australian/Asian, and European populations have been shown, with an increased incidence of type 2 diabetes in US populations, no association for European countries, and an inverse association in Asian/Australian populations.145 Additionally, body mass index could be an influencing factor in the association between nut intake and incidence of type 2 diabetes, with an inverse association before and a null association after adjustment for body mass index. In a subgroup analysis, a reduced incidence of type 2 diabetes was observed for participants with body mass index of at least 25, and no association for those with a body mass index of less than 25.146
Although publication bias was indicated for only 7% of the meta-analyses according to the Egger’s test and for only 5% according to the funnel plots, 40% included five to 10 studies and 40% included even fewer than five studies, which indicates that the results are not reliable.17 Since some of the meta-analyses included only a few primary studies, some data are missing (for example, unpublished null associations). Thus, more research is needed to investigate these associations, which were based on small numbers of included studies.
Furthermore, primary studies that were not included in any published meta-analyses might have been missing, and additional studies could have come out after publication of each meta-analysis and could have influenced the results. We did not include pooled analyses in our umbrella meta-analyses and it was also beyond the scope of this umbrella review to include exposures of biomarkers. However, the measurement of certain exposures (eg, fatty acids) could lead to bias,60 and more specific information on long term intake might be obtained from biomarkers.147148
Dietary changes over time were also not assessed in this umbrella review. Only two of the included meta-analyses repeated measures of dietary intake diet. One meta-analysis on sugar sweetened beverages, artificially sweetened beverages, and total fruit juice showed that the association with increased incidence of type 2 diabetes was diminished for total fruit juice when diet was measured repeatedly.56 Another meta-analysis found stronger associations between red and processed meat intake and type 2 diabetes incidence in subgroups of studies that used repeated dietary assessments compared with only baseline dietary assessments.37 In the three Harvard cohorts, associations between red and processed meat and incidence of type 2 diabetes were stronger after repeated dietary assessments than after only baseline dietary intake.39 Increases and reductions in red and processed meat intake over time were also found to be associated with subsequent increases and decreases in the incidence of type 2 diabetes, respectively.149
In the NutriGrade tool, all criteria contribute to the overall score with one point, except for bias, study quality, study limitations, and effect size, which contribute with two points and therefore receive more weight. However, bias, study quality, and study limitations include several aspects that might justify a higher weight (eg, exposure, outcome, and confounding). Although NutriGrade is a validated tool, the use of other tools (eg, GRADE150) could have led to different conclusions regarding the quality of the evidence.
Finally, we systematically chose the meta-analysis including the largest number of primary studies for each exposure. Therefore, the chosen meta-analysis might not have had the highest quality of evidence. However, the meta-analysis with the largest number of primary studies was mostly based on the same primary studies as meta-analyses including fewer studies, with an update of one or more studies. Additionally, in our umbrella review, one of the main reasons for a low quality of evidence was due to the small number of primary studies included in the meta-analyses. Therefore, it is unlikely that inclusion of a meta-analysis with even fewer primary studies would have achieved a higher quality of evidence compared with the meta-analysis included in our umbrella review.
Conclusions and future research outlook
The association of dietary behaviours or diet quality indices, food groups, foods, beverages, macronutrients, and micronutrients with incidence of type 2 diabetes has been examined in many published meta-analyses. Evidence indicates that dietary factors have an important role in the primary prevention of the disease. Although the methodological quality of the included meta-analyses was mostly high, the quality of evidence was only high for associations for incidence of type 2 diabetes with whole grains, cereal fibre, moderate alcohol consumption, red meat, processed meat, bacon, and sugar sweetened beverages.
To achieve high quality of evidence for these associations and be able to give strong recommendations, future studies should regard several aspects. Dietary data with high validity should be attained, by improving dietary measurement methods and by assessing and accounting for changes in dietary behaviour over time. Studies should focus on exposures, which are biologically likely to be associated with incidence of type 2 diabetes, but for which quality of evidence is still low. Since recommendations are based on foods and food groups, studies should also focus on answering open questions in terms of internal inconsistencies, such as the role of unprocessed meat versus processed red meat in the association of total meat and red meat with disease incidence. More research is also needed on specific foods for which evidence is still low, such as types of rice (white rice, brown rice), fish (oily or lean fish), or fat (eg, olive oil). To take into account interactions between different foods and nutrients and the influence of mediating factors (eg, body mass index), future studies should also focus on dietary patterns, substitution analysis, mediation analysis, and network meta-analysis. Furthermore, to avoid selective publication bias, existing and future cohorts should publish data in comprehensive analyses, including data on dietary exposures that have not been investigated (or published) so far.
What is already known on this topic
A large body of research is available regarding the association of type 2 diabetes incidence with dietary behaviours or diet quality indices, food groups, single foods and beverages, macronutrients, and micronutrients
These findings could be of importance given the substantial global health burden and healthcare costs of type 2 diabetes
However, the strength, precision, and influence of potential bias regarding these associations need to be clarified
What this study adds
In an umbrella review of meta-analyses including observational studies, existing evidence indicates that dietary factors have a role in the development and prevention of type 2 diabetes
Although the methodological quality of the meta-analyses was mostly high, quality of evidence was only high for whole grains, cereal fibre, and moderate total alcohol intake (associated with a reduced incidence of type 2 diabetes) and for red meat, processed meat, bacon, and sugar sweetened beverages (associated with an increased incidence of type 2 diabetes)
Future studies should attain dietary data with high validity and focus on dietary exposures and specific food groups for which quality of evidence has been low; and publish more comprehensive analyses including data on less frequently investigated and subtypes of dietary exposures
Acknowledgments
We thank Oliver Kuss, director of the Institute for Biometrics and Epidemiology at the German Diabetes Centre, for his statistical advice and support.
Footnotes
Contributors: SS designed the research. MN and SS conducted the literature search and literature screening. MN and AB extracted the data. MN and SS analysed the data and wrote the first draft of the paper. All authors interpreted the data, read the manuscript, and approved the final version. MN and SS are guarantors. The corresponding author attests that all listed authors meet authorship criteria and that no others meeting the criteria were omitted.
Funding: The German Diabetes Centre is funded by the German Federal Ministry of Health and the Ministry of Innovation, Science, Research and Technology of the State North Rhine-Westphalia. This study was also supported in part by a grant from the German Federal Ministry of Education and Research to the German Centre for Diabetes Research. The funding source has no role in the decisions about the data collection, analysis, interpretation of the data, preparation, review or approval of the manuscript.
Competing interests: All authors have completed the ICMJE uniform disclosure form at www.icmje.org/coi_disclosure.pdf and declare: support from the German Federal Ministry of Health, the Ministry of Innovation, Science, Research and Technology of the State North Rhine-Westphalia, and the German Federal Ministry of Education and Research to the German Centre for Diabetes Research for the submitted work; no financial relationships with any organisations that might have an interest in the submitted work in the previous three years; no other relationships or activities that could appear to have influenced the submitted work.
Ethical approval: Not required.
Data sharing: Data were extracted from published meta-analyses, all of which are available and accessible.
The lead authors affirm that the manuscript is an honest, accurate, and transparent account of the study being reported; that no important aspects of the study have been omitted; and that any discrepancies from the study as planned have been explained.
This is an Open Access article distributed in accordance with the Creative Commons Attribution Non Commercial (CC BY-NC 4.0) license, which permits others to distribute, remix, adapt, build upon this work non-commercially, and license their derivative works on different terms, provided the original work is properly cited and the use is non-commercial. See: http://creativecommons.org/licenses/by-nc/4.0/.