Article Text

Abstract
Introduction Systematic reviews are a cornerstone of evidence-based public health. The method of appraising the quality of different intervention and observational study designs in such reviews remains an important challenge. This article examines the applicability of selected quality appraisal tools (QATs) and the impact of choice of tool on the meta-analysis of a published systematic review.
Methods The authors selected a systematic review on the effectiveness of hand washing with soap in preventing diarrhoea, covering a range of epidemiological study designs. 6 QATs were used to assess 13 studies meeting their inclusion criteria; component sections/questions were coded numerically to derive a summary score between −1 (low quality) and +1 (high quality) for each QAT and study. Heterogeneity in study quality was evaluated graphically using traffic light schemes and spider charts. Random effects meta-analysis was undertaken for all studies; sensitivity analyses for each QAT included only those studies with a score of 0 or above.
Results The authors found substantial heterogeneity in summary scores for a given study. Their main meta-analysis yielded an OR of 0.60 (95% CI 0.47 to 0.77) with most sensitivity analyses giving similar pooled effect sizes with wider CIs.
Discussion The six QATs differ greatly in applicability across study designs, approach to quality appraisal (ie, scale vs checklist, presence/absence of summary score), coverage of domains and quality of component questions and answers. Learning from advantages and disadvantages of each QAT, we recommend research into the development of a reliable QAT with a broad applicability across study designs.
- Public health
- systematic reviews
- diarrhoea
- methodology
- meta-analysis
- air pollution
- child health
- epidemiology
Statistics from Altmetric.com
- Public health
- systematic reviews
- diarrhoea
- methodology
- meta-analysis
- air pollution
- child health
- epidemiology
Introduction
The concept of evidence-based public health is receiving increasing attention. One proposed definition describes evidence-based public health as ‘the development, implementation and evaluation of effective programmes and policies in public health through application of principles of scientific reasoning, including systematic uses of data and information systems and appropriate use of behavioural science theory and programme planning models’.1 In this context, assessing the effectiveness of public health interventions in a reliable way is critical, and systematic reviews are becoming more and more important.2 There is much discussion about the challenges that arise when this method of evidence synthesis, originally developed for evidence-based medicine, is transferred to public health.
In particular, limiting systematic reviews of public health interventions to randomised controlled trials (RCTs) may dismiss as noise much of what others would consider to be the signal.3 Therefore, one key question is ‘how low one should go’ in the hierarchy of study designs.4 Beyond determining whether any evidence is found at all in situations where RCTs are not available, the decision on which study designs to include involves a difficult trade-off between maximising internal validity and producing reliable pooled effect estimates versus ensuring that findings are transferable to real-life settings and of policy relevance.
A related challenge is how to assess study quality when a variety of study designs comprising, for example, standard observational study designs, individually and cluster-randomised trials, as well as non-randomised intervention trials, are considered. Using study design alone as the guiding principle may mix well-conducted studies with high internal validity with poorly-conducted studies with low internal validity. Careful and comprehensive quality appraisal is therefore critical in ensuring that studies with a high risk of bias are not allowed to contribute to pooled effect estimates. While quality appraisal of randomised studies tends to follow established procedures, there is lack of agreement on how to assess the quality of non-randomised studies. Quality appraisal tools (QATs) show much variability in development process, intent, construction and psychometric properties5–8 and are distinct with respect to the aspects of study quality they cover and the weight assigned to them. These differences in approach may lead to discrepant conclusions on which studies provide internally valid results and which do not, and it can thus be suspected that the decision to use one QAT versus another influences the decision on which studies are allowed to contribute to meta-analysis and, consequently, the size and CI of the pooled effect estimate.
This article examines the applicability of selected QATs to different study designs, explores how the choice of tool impacts the meta-analysis of a published systematic review of a public health intervention and makes recommendations for quality appraisal in systematic reviews of public health interventions.
Methods
Selection of systematic review
We attempted to identify a published systematic review that (1) examines a relatively simple public health intervention, (2) includes a range of randomised and non-randomised study designs, (3) comprises fewer than 25 primary studies (for reasons of feasibility) and (4) conducts meta-analysis. A systematic review of the effectiveness of hand washing with soap in preventing diarrhoea by Curtis and Cairncross met all of these criteria.9
As this review included only studies up to the year 2001, we searched PubMed and contacted researchers involved with the comparative risk assessment for water, sanitation and hygiene as part of the Global Burden of Disease 2010 study.10 This yielded five related systematic reviews11–15 as well as an incomplete update of the originally identified review;16 these are summarised in our systematic review protocol (available upon request). As none of these more recent reviews had searched the literature for observational studies and as the objective of our study was not to provide the most up-to-date estimate of the effectiveness of hand washing but to explore how the choice of QAT influences an estimate obtained through combining a variety of epidemiological study designs, we used the original systematic review.9
Selection of QATs
Six QATs were purposively selected for testing based on their previously demonstrated quality and/or their particular relevance to systematic reviews of public health interventions. Deeks and colleagues assessed 194 QATs; 14 covered at least five internal validity domains and three core items for non-randomised studies and were thus considered most reliable.5 Among these, we selected the Effective Public Health Practice Project tool (EPHPPT; recommended by the Cochrane Public Health Group),17 the Critical Appraisal Skills Programme (CASP) tool18 and the Newcastle–Ottawa Scale (NOS) for their frequent use in the field of public health.19 Three additional, more recently developed QATs were also tested. Based on the NOS, a group of researchers at the University of Liverpool designed checklists for four study designs and used these in several systematic reviews as part of the Global Burden of Disease 2010 study's comparative assessment of health risks;10 selected components of the Liverpool tool (ie, exposure and outcome assessment) are adapted to the given research question,20 in our case based on requirements for reliable and valid assessment of hand washing practices and diarrhoea. Finally, the Graphical Appraisal Tool for Epidemiological Studies (GATE)21 is employed by the Public Health Excellence Centre of the United Kingdom National Institute for Health and Clinical Excellence, and the Cochrane Collaboration Risk of Bias tool (ROB) represents an accepted standard for systematic reviews. The latter is currently being modified for non-randomised studies; we tested the version presented at an international workshop in Munich in November 201022 but employed a three-point (ie, low, moderate, high) rather than five-point rating for risk of bias.
Study inclusion criteria
We adopted the inclusion criteria by Curtis and Cairncross:9 (1) hand washing with soap as the intervention (excluding combined interventions and interventions promoting hand washing without soap), (2) diarrhoeal diseases as the health outcome and (3) no age restrictions, but modified these to consider only studies conducted (4) in developing countries and (5) community settings. We made these restrictions as deriving effect estimates across very distinct implementation settings (ie, childcare or other institutional setting vs home setting) and national contexts (ie, developing vs industrialised country) would not be meaningful.
Data extraction and quality appraisal
For all included studies, data extraction was undertaken independently by both authors using a modified version of the Cochrane Collaboration data extraction form.23 Subsequently, both authors independently applied all six QATs, compared their results and resolved any discrepancies in quality ratings through discussion.
Evaluation of QATs
Each QAT was evaluated regarding its applicability to different study designs, coverage of components, and quality of component questions and answers. To be able to make a QAT-informed decision on whether a given study should be included in meta-analysis or not, we had to follow an objective, transparent process, rather than letting our overall understanding of the weaknesses of a given study, developed through assessment with all six QATs, drive that decision. While three QATs generate numerical or graded summary scores, which could be used as a basis for an inclusion/exclusion decision, the other three are checklists and do not offer any such guidance. Therefore, to enable meaningful comparisons across all six QATs, we coded individual components of each tool on a scale ranging from -1 (low quality) to 0 (moderate quality) and +1 (high quality). In the case of GATE, for example, individual component ratings of ‘-’, ‘not reported/not applicable/+’ and ‘++’ for each question were coded as −1, 0 and +1, respectively. Ultimately, for each study and QAT, a summary score ranging from −1 to +1 was derived as the sum of individual component ratings divided by the number of components. We graphically depicted homogeneity versus heterogeneity in quality appraisal with different QATs by adapting the Cochrane traffic light scheme and developing spider charts (see figure 1 for explanation).
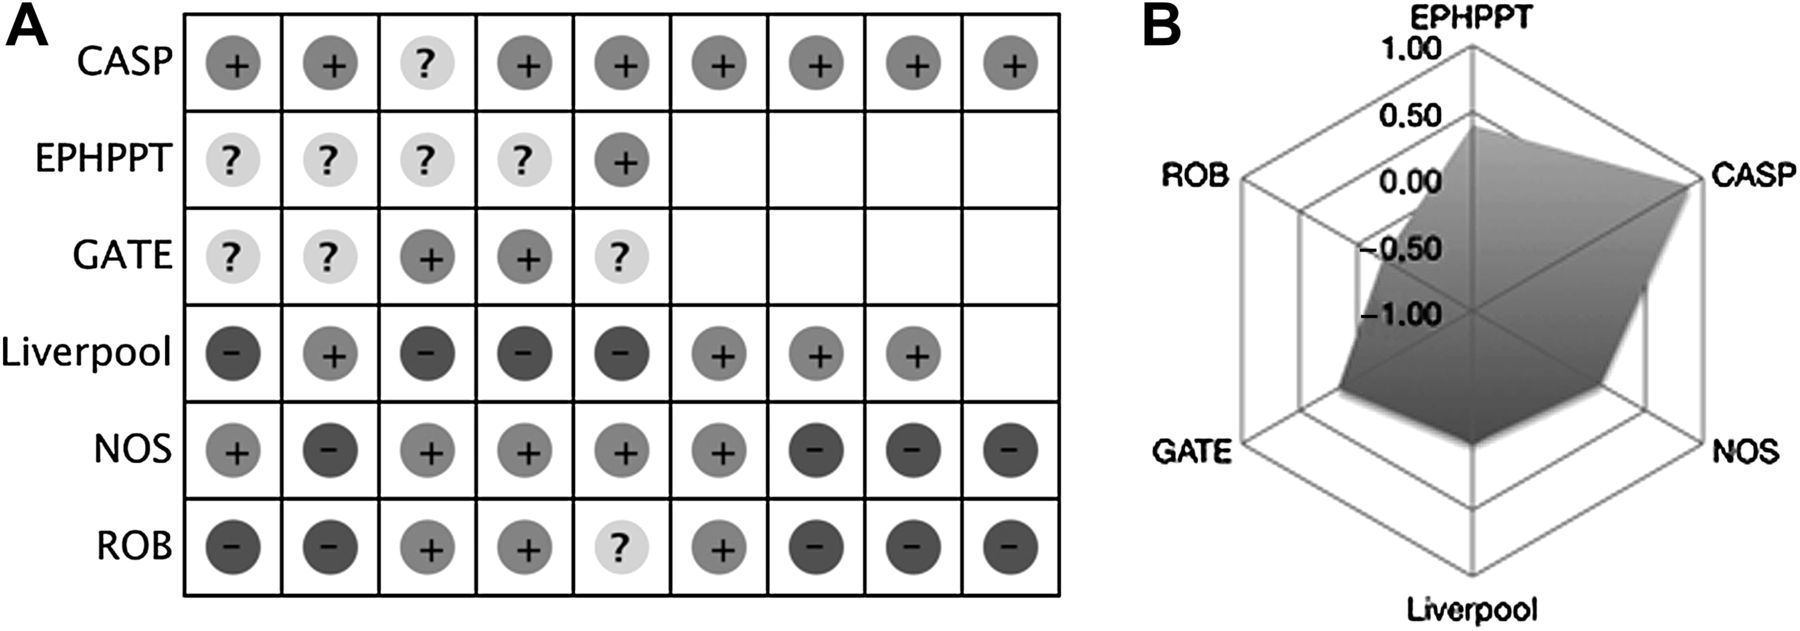
(A) Traffic light scheme. (B) Spider chart. The traffic light scheme provides a rapid graphical overview of whether a study scores high (+), moderate (?) or low (−) on different quality domains/questions; similarity in predominant signs (i.e. +, ?, −) indicates good agreement between different QATs. The spider chart approximates a circle when different QATs result in a similar quality assessment, with a larger circle indicating a higher-quality study and a smaller circle indicating a lower-quality study. For Hussein Gasem et al 27 large differences in predominant signs and a spider chart with kinks suggests that assessment of study quality varies between QATs. CASP, Critical Appraisal Skills Programme; EPHPPT, Effective Public Health Practice Project tool; GATE, Graphical Appraisal Tool for Epidemiological Studies; NOS, Newcastle–Ottawa Scale; QAT, quality appraisal tool; ROB, Cochrane Collaboration Risk of Bias tool.
Meta-analyses
The approach to meta-analysis was first to pool all eligible studies and then to carry out sensitivity analyses to assess the impact of QAT choice. Studies eligible for meta-analysis provided an estimate of effect with 95% CI (or the information to calculate these); we attempted to obtain missing information by approaching the first and senior authors of studies. Effect estimates for studies with different measures of hand washing (eg, before eating, after defecation) or different diarrhoeal disease outcomes (eg, dysentery, shigellosis) were combined by averaging, if they concerned the same sample group. If they concerned different sample groups, they were reported separately. Effect estimates were included as ORs; where available adjusted ORs were used.
We undertook one sensitivity analysis for each QAT, including only studies with a coding of 0 or above, and additional sensitivity analyses for EPHPPT (including only studies with an overall rating of moderate or high) and GATE (including only studies scoring + or ++ on the overall assessment of internal and external validity). We conducted random effects meta-analyses using the generic inverse variance method; all analyses were run in Review Manager V.5.1.2 (Copenhagen, Denmark).
Results
Table 1 gives an overview of the characteristics of the six QATs, classifying these as scales (ie, resulting in a numerical summary score) and checklists (ie, a list of items with or without a qualitative summary score). QATs differ in terms of study designs considered and number of components included. Most importantly, there is much variation in the full or partial coverage of key study quality domains as defined by Sanderson et al. 7 Confounding is the only key domain addressed by all QATs; conflict of interest is not considered by any tool.
Characteristics of QATs and key study quality domains addressed
Thirteen studies met our inclusion criteria24–36 (table 2), comprising one RCT, four non-randomised intervention trials, one cohort study, six case-control studies and one cross-sectional study, and covering Africa (three studies), Asia (nine studies) and Latin America (one study). The summary scores in table 2 reveal major shortcomings in most studies (eg, inadequate adjustment for confounding, poor control selection). They also highlight substantial heterogeneity in results, as graphically confirmed by traffic light schemes (figure 1a) and spider charts (figure 1b) for each study.
Summary scores* of studies based on different QATs
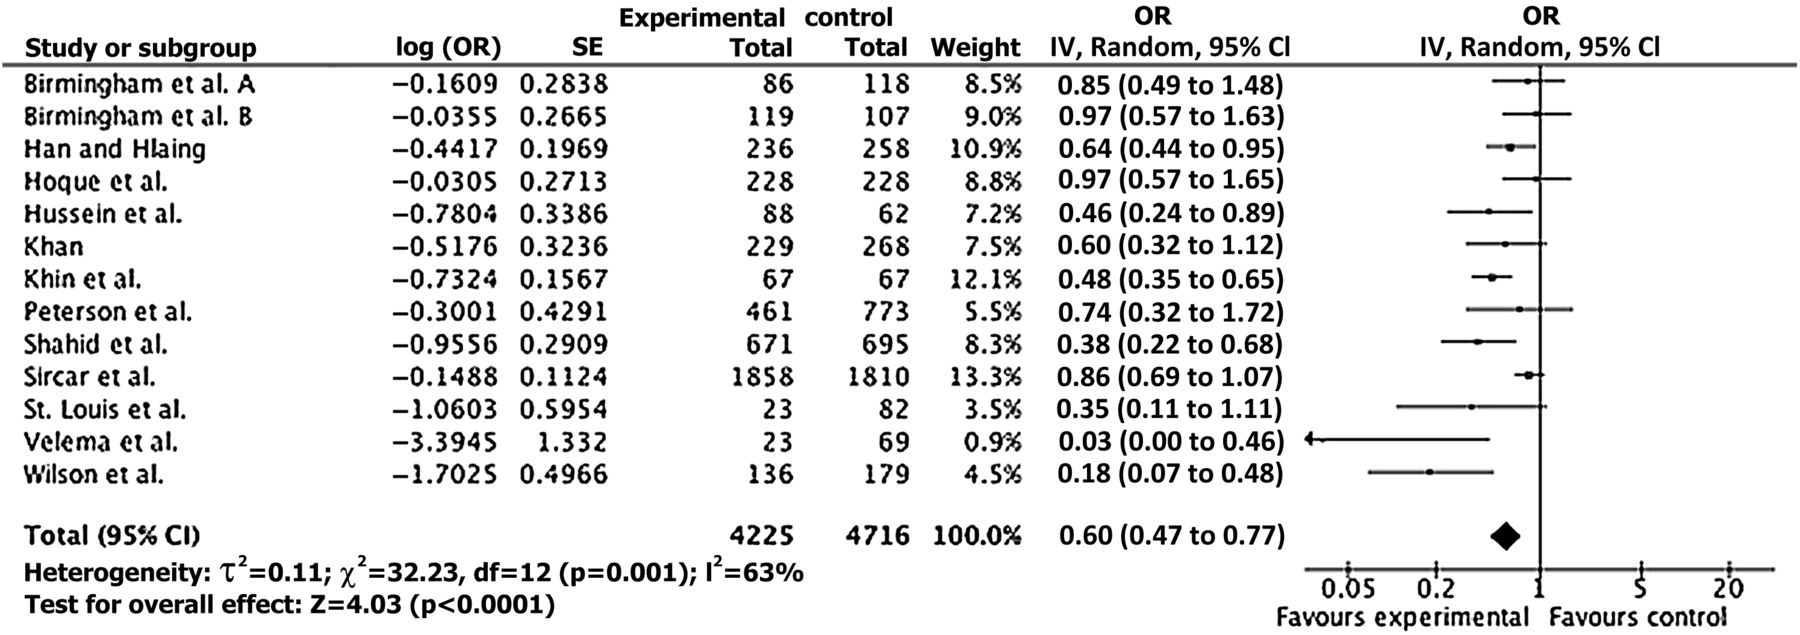
Meta-analysis was conducted using 13 estimates from 12 included studies; ORs and 95% CIs were neither available nor calculable for Yeager and colleagues.36 Figure 2 shows the ORs for all included studies yielding a pooled OR of 0.60 (95% CI 0.47 to 0.77). An asymmetric funnel plot suggests high risk of publication bias.
Meta-analysis for the effect of hand washing with soap in diarrhoeal disease.
The results of the sensitivity analyses are shown in table 3. First, there are large differences in the number of studies included. With nine out of 13 risk estimates included, CASP appears most inclusive in relation to study quality; due to negative ratings for all studies, the ROB does not allow a pooled risk estimate to be derived. Using an alternative summary score results in the inclusion of an additional study for the EPHPPT and no change for GATE. Second, three studies28 ,32 ,35 are not included in any sensitivity analyses, which may imply that all six QATs are able to distinguish between very poor quality studies and moderate to high quality studies. Finally, pooled effect estimates are remarkably consistent across sensitivity analyses although there is considerable variation in the precision of the estimate; except for the NOS, all sensitivity analyses yield statistically significant pooled ORs.
Sensitivity analyses for the effect of hand washing with soap on diarrhoeal disease according to different quality appraisal tools
Discussion
Key findings
We applied selected QATs to a systematic review of the effectiveness of hand washing in preventing diarrhoea. These analyses indicate substantial differences between QATs with respect to their applicability across study designs and the relative importance assigned to different quality domains, and show large differences in the overall score for a given study. As the same pair of researchers undertook data extraction and quality appraisal for all studies and QATs, it is likely that this heterogeneity indicates real differences in the way QATs assess the quality of a study.
Our main meta-analysis based on 13 estimates from 12 studies yielded a pooled OR of 0.60 (95% CI 0.47 to 0.77). This finding is roughly equivalent to the pooled risk estimate of 1.74 (95% CI 1.39 to 2.18) in the meta-analysis of Curtis and Cairncross including 17 studies.9 Even though the number of included studies varies widely, the pooled ORs in our sensitivity analyses are remarkably robust, although implications of the observed differences for decision-making become more apparent when ORs are converted to numbers needed to treat (NNT). For example, with an assumed control risk of 0.3, the smallest pooled OR of 0.57 (GATE) translates into an NNT of 10 compared with an NNT of 14 for the largest pooled OR of 0.69 (NOS) (table 3). It is noteworthy that more recently conducted systematic reviews of the effectiveness of hand washing, which due to their focus on intervention studies presumably include more higher quality studies, find slightly lower average risk reductions of 36%,11 32%,12 25%–37%13 and 31%.15 This suggests that systematic reviews that include non-randomised studies may overestimate the effectiveness of a given intervention; including all intervention and observational studies independent of their quality appears to lead to a false precision in the pooled effect estimate.
Study limitations
Thirteen studies constitute a small sample size, in particular with only one cohort study and none of the more sophisticated study designs (eg, interrupted time-series studies) included. Our sample is relatively old (dating from 1982 to 2001), which partly explains why most studies are of rather poor quality. Epidemiological practice and reporting standards have evolved since, and it is likely that a more recently conducted systematic review including studies following TREND,37 CONSORT38 or STROBE39 reporting requirements would yield a higher quality sample.
Quality appraisal is always somewhat subjective40 and the judgement about how well a particular study meets a specific criterion will vary when different groups of researchers are involved. We have tried to be as transparent as possible in our rating of studies, quantitative coding and decisions about including/excluding studies in sensitivity analyses. As a basis for being able to conduct QAT-informed meta-analyses across tools, we assigned numerical values to each answer category in a given QAT, which may have skewed the scale intended by the developers.
We assumed equal weighting of components or questions in deriving a quantitative summary score for each QAT. We are aware of the discussions on the benefits and drawbacks of deriving a summary score and realise that our approach may be against the intention of the developers of some tools as it does not distinguish appropriately between components that are critical to the overall validity of a study and those of lesser importance. This may, for example, lead to a false reassurance by allowing a study with one serious flaw but an overall moderate rating to contribute to a pooled analysis. We believe that summary scores are useful in pinpointing to potentially problematic studies but should not be used at the expense of a detailed investigation and documentation of specific study limitations. In addition to using such scores to decide on inclusion/exclusion of studies in meta-analysis or to inform sensitivity analyses, variation in selected critical quality criteria, such as selection bias or confounding, could equally be used to guide sensitivity analyses. Similarly, the decision to include all studies scoring 0 or above is somewhat arbitrary. It would be informative to explore how different ways of deriving a summary score and more or less rigorous cut-off values might influence the results.
Despite these limitations, we believe that this first attempt to systematically apply several QATs across all studies within a systematic review of a public health intervention provides relevant insights into the importance of quality appraisal and the impact of choice of QAT on meta-analysis.
Evaluation of QATs
In terms of applicability across study designs, EPHPPT and ROB follow the ‘level playing field’ approach, that is, all study designs compete at the same level. NOS and Liverpool, on the other hand, develop a set of QATs for specific study designs, suggesting that each study should be planned, conducted and analysed as well as possible given inherent design constraints.
The pursuit of the scale versus checklist approach has important implications for systematic reviews. Summary scores (eg, EPHPPT, NOS, Liverpool) enable a simple and semiquantitative decision about whether or not a study should be included in meta-analysis. Checklists (eg, ROB, CASP) make such a decision more difficult but could nevertheless be used to inform sensitivity analyses (eg, exclusion of studies with a certain number of weak ratings). GATE combines the two approaches by guiding the evaluator through a list of items and then asking him or her to draw a conclusion about internal and external validity.
QATs clearly differ in the relative importance assigned to different research characteristics, partly due to their development history40 (table 1). For example, the ROB was originally developed for RCTs and subsequently modified, which explains why several critical considerations for non-randomised studies (eg, exposure measurement) are not addressed and why most non-randomised studies automatically score low on key components (eg, sequence generation, allocation concealment). It is also noteworthy that some components (eg, statistical analysis in EPHPPT) are assessed but not rated.
Quality of component questions
The degree to which a question is formulated in a specific (eg, GATE's distinction among source population, eligible population and selected participants) or less specific way (eg, Liverpool's general enquiry about selection bias) has an impact on the subjectivity of the answer. While we did not formally assess inter-rater reliability (see also table 1), we noted that GATE and NOS resulted in fewer discrepancies than the other QATs. Likewise, we observed that the combination of main questions with subquestions (eg, CASP) increases variability in answers. Most QATs do not foresee adaptation to the systematic review question. We found, however, that the definition of a gold standard for exposure and health outcome assessment based on sound subject matter knowledge, as proposed by Liverpool, improves validity of ratings and inter-rater reliability.
Quality of component answers
QATs employ multiple-choice answers, quantitative answers and categorical answers, with each approach presenting with advantages and disadvantages. The multiple-choice answers in the NOS limit subjectivity where answer categories apply; missing categories turned out to be a problem for some studies. Quantitative answers can increase precision (eg, response rate in EPHPPT) or be misleading. For example, the results of a study that adjusts for more than 80% of relevant confounders may nevertheless be highly confounded if one main confounder (eg, malnutrition in the case of diarrhoea) is missing. Categorical answers (eg, low, moderate, high in ROB) worked well in most cases but too few answer categories can be a problem (eg, CASP).
The meaning of the categories ‘can't tell’ and ‘not reported’ is also not unequivocal. For example, a strict interpretation of ‘not reported’ for blinding would be that researchers and study participants were not blinded (ie, coding of −1), and a less strict interpretation would be that owing to poor reporting we do not know whether the study was blinded (ie, coding of 0).
Recommendations for the use of QATs in systematic reviews
Our main meta-analysis yielded a pooled effect estimate that is more precise than those derived through sensitivity analyses and shows greater intervention effectiveness than more recently conducted systematic reviews.11–15 This finding strongly suggests that it is better to use any QAT than to ignore quality appraisal altogether. We felt that we had really understood a study after having applied two or three QATs, implying that none of the tested QATs covers all critical components. Therefore, we recommend (1) testing of a broader set of QATs on a more up-to-date systematic review of a public health intervention covering a wide range of epidemiological study designs and (2) research into the development of a reliable QAT with broad applicability across study designs.
What features should this gold standard QAT adhere to based on our experience? First, it is difficult to meet the needs of all study designs on a level playing field; instead, a set of companion QATs comprising common components and study design-specific components could initially be developed for standard intervention and observational study designs and then be expanded to address more complex designs. Second, an overall summary score may lead to information loss and oversimplification. Instead, we propose a careful quantification of domains (rather than individual questions) in a weighted checklist, where results could be graphically illustrated using the traffic light scheme or quantified using our coding approach. Third, the gold standard QAT should address both internal and external validity with a clear distinction between these. Fourth, much more effort should be invested into the development and testing of appropriate and specific questions and answer categories; a manual can help with their correct interpretation. Finally, we believe that the subject-specific adaptation of selected questions makes quality appraisal more precise and reliable than a one size fits all QAT.
We encourage those interested in conducting systematic reviews including observational studies and in making public health more evidence based to take forward some of these ideas and recommendations for research.
What is already known on this subject
-
Systematic reviews of public health interventions are a cornerstone of evidence-based decision-making but present with a range of methodological challenges, including which observational study designs to include and how to assess their quality.
-
With more than 200 different tools available, a standard approach regarding quality appraisal of observational studies does not exist and the impact of the choice of tool on the results of systematic reviews is unknown.
What this study adds
-
Our study shows large heterogeneity in the assessment of study quality between six widely used quality appraisal tools. Conducting meta-analysis for only moderate to high quality studies as identified by each tool yields differences in size and precision of the pooled effect estimate.
-
Our study emphasises the importance of quality appraisal in systematic reviews, and the need to develop and test a gold standard tool that is applicable across a broad range of epidemiological study designs and addresses all major aspects of internal and external validity.
Acknowledgments
We would like to thank James R Miller for his support in developing the coding method. We are most grateful to Hajo Zeeb and the three anonymous reviewers for their insightful and constructive comments on a previous version of this article.
References
Footnotes
-
Funding Eva Rehfuess gratefully acknowledges financial support from the Munich Center of Health Sciences.
-
Competing interests None.
-
Provenance and peer review Not commissioned; externally peer reviewed.