Article Text

Abstract
Background Rising food bank use in the past decade in the UK raises questions about whether food insecurity has increased. Using the 2016 Food and You survey, we describe the magnitude and severity of the problem, examine characteristics associated with severity of food insecurity, and examine how vulnerability has changed among low-income households by comparing 2016 data to the 2004 Low Income Diet and Nutrition Survey.
Methods The Food and You survey is a representative survey of adults living in England, Wales, and Northern Ireland (n=3118). Generalised ordered logistic regression models were used to examine how socioeconomic characteristics related to severity of food insecurity. Coarsened exact matching was used to match respondents to respondents in the 2004 survey. Logistic regression models were used to examine if food insecurity rose between survey years.
Results 20.7% (95% CI 18.7% to 22.8%) of adults experienced food insecurity in 2016, and 2.72% (95% CI 2.07% to 3.58%) were severely food insecure. Younger age, non-white ethnicity, low education, disability, unemployment, and low income were all associated with food insecurity, but only the latter three characteristics were associated with severe food insecurity. Controlling for socioeconomic variables, the probability of low-income adults being food insecure rose from 27.7% (95% CI 24.8% to 30.6 %) in 2004 to 45.8% (95% CI 41.6% to 49.9%) in 2016. The rise was most pronounced for people with disabilities.
Conclusions Food insecurity affects economically deprived groups in the UK, but unemployment, disability and low income are characteristics specifically associated with severe food insecurity. Vulnerability to food insecurity has worsened among low-income adults since 2004, particularly among those with disabilities.
- disability
- poverty
- socio-economic
- nutrition
Statistics from Altmetric.com
Introduction
Household food insecurity, defined in high-income countries as “the uncertainty and insufficiency of food availability and access that are limited by resource constraints, and the worry or anxiety and hunger that may result from it”,1 is a critical determinant of health. Children growing up in food insecure homes have poorer health and education outcomes2–4 than children growing up in food secure homes. Food insecure adults experience high rates of depression and anxiety, use more mental healthcare services,5–8 are more likely to have inadequate nutrient intakes,9 and cost public healthcare systems more than food secure adults.10
The alarming rise in food bank usage in the UK in recent years has pushed the health consequences of food insecurity back onto the public health agenda. In the Trussell Trust Foodbank Network—the only UK food bank organisation tracking usage nationwide and which supports a franchised network of food banks making up about 60% of UK food banks—food parcel distribution rose from about 61 500 in 2010–11 to 1.33 million in 2017–18,11 a rise linked with welfare reforms.12
Yet, monitoring food insecurity, and understanding its drivers, using food bank data is problematic. Food banks were largely unavailable before 2010, but have proliferated since then.13 Food bank data also does not capture food insecure people who do not receive help from food banks.14 This discrepancy comes through clearly in the Gallup World Poll, which, in 2014, showed the number of people experiencing food insecurity is 17 times larger than the number of people seen in Trussell Trust food banks.15 A critical, but unexplored, question for Britain is, has food insecurity risen or has the new availability of food banks simply revealed food insecurity in the population?
Answering this question is difficult because food insecurity has not been regularly measured in the UK, though some surveys have included food insecurity at different times. In this study, we begin by describing the magnitude and severity of food insecurity among specific socioeconomic groups using data from the Food and You (F&Y) survey, collected in 2016.16 We then compare these data with the 2004 Low Income Diet and Nutrition Survey (LIDNS).17 Since certain groups are over-represented in food banks (such as the unemployed, those unable to work due to disabilities, and families with children),18 we use these surveys to provide information on who is at risk of food insecurity today, and how this compares to risk in 2004, providing insight into how this problem has changed over a period of economic recession, austerity and welfare reform in the UK.19 20
Methods
Data
The 2016 F&Y survey was a cross-sectional survey of 3118 adults aged 16+ living in private dwellings in England, Wales and Northern Ireland.16 Fieldwork was conducted over the summer of 2016. Details of the sampling method and survey procedures are available in the user guide.21
The 2004 LIDNS targeted the 15% most deprived households in the UK. Doorstep screening was used to recruit households who were materially deprived (according to questions concerning car ownership, tenancy, receipt of means-tested benefits, employment status, lone parent status) and, in ambiguous cases, household income. In total, 3728 individuals were included in the final sample. Details on the survey methodology are available in the survey report.22
Measurement and classification of food insecurity
Household food insecurity is experienced on a continuum, ranging from experiences of food running out to going whole days without eating.23 These experiences are captured in the US Department of Agriculture 10-item Adult Food Security module (see online web appendix 1), a validated tool for measuring food insecurity in high-income countries,24 which was used in the 2016 F&Y and the LIDNS. We coded food insecurity using methods adopted by researchers in Canada,25 which denotes moderate food insecurity as two or more affirmative responses and severe food insecurity as six or more affirmative responses. Marginal food insecurity denotes one question answered affirmatively. Food secure means no questions were answered affirmatively. Respondents who did not answer any of the questions could not be scored and were excluded (n=6).
Supplemental material
Predictor variables
Using variables available in the F&Y survey (see online web appendix 1), we examined whether food insecurity was associated with: position in the income distribution (ie, income quartile) after adjusting for household size, presence of children, respondent age, gender, marital status, employment status, life-limiting disability or illness, ethnicity, education level, country, and rural/urban dwelling. F&Y data specifically identify households with children under 6 years of age, so we also differentiate between households with and without young children because having younger children may differentially relate to food insecurity than having only older children. Across these variables, a total of 35 respondents were missing data and excluded from analyses. The 665 respondents who did not report their income quartile were included as a separate level of the income variable.
Analysis
All analyses were conducted using Stata version 15 survey procedures, providing weighted estimates of population proportions and tests of association corrected for sampling design.
Associations between household characteristics and the 4-level food insecurity variable were analysed using a generalised ordered logistic regression model,26 which allows effect sizes to vary for each interval change in the outcome. This model simultaneously estimates odds ratios for three comparisons: (1) the food secure versus all food insecurity categories; (2) people who are marginally food insecure or food secure versus people experiencing moderate and severe food insecurity; (3) people who are not in severe food insecurity versus people who are in severe food insecurity.
We first estimate the association between socioeconomic characteristics and food insecurity excluding position in the income distribution because it is a mediating variable and thereby potentially biases our results27; but we explore how our results change once income quartile is added, testing whether these socioeconomic characteristics continue to associate with risk of food insecurity across different levels of income.
Combining the F&Y survey with the LIDNS
The 2004 LIDNS was merged with the 2016 F&Y survey, but because these samples were not designed to be combined we have excluded some respondents to make these datasets more comparable. First, we only included those respondents in the F&Y sample from the lowest income quartile (n=335) so that these respondents are more similar to the materially deprived LIDNS sample. Second, we excluded LIDNS respondents in Scotland and under 16 years of age to match the F&Y sample. These samples are quite similar in terms of age, ethnicity and the prevalence of disabilities (see online web appendix 2), but less so in terms of education and employment status, partly because LIDNS was exclusively targeted at the most deprived households.
This imbalance could lead to biased estimates when comparing food insecurity between the two surveys may be incomparable if the populations are too different. Thus, we used a partial matching approach called Coarsened Exact Matching28 to match respondents on the same variables from the F&Y analysis (although with some variables slightly modified, see online web appendix 3): household income, employment status, longstanding illness or disability, age, gender, presence of children in household, household size, marital status, ethnicity, region, and any education qualifications. While recently developed, this matching procedure has been applied in various public health settings29–31 because it effectively reduces the imbalances observed in survey data (more details on the matching are available in online web appendix 4). Matching can mean the analytic sample is no longer representative of the underlying population and so estimates may not be generalised to the whole population. Due to small sample sizes, we dichotomise food insecurity for these analyses (fully food secure vs food insecure) and estimate the probability of any food insecurity among households in 2004 and 2016 using logistic regression models. Interaction terms were used to test if vulnerability to food insecurity changed between survey years for groups over-represented in food banks in 2016,18 namely people with disabilities, children, and without work.
Results
How many people are food insecure and which groups are most at risk?
Almost 21% of adults in England, Wales, and Northern Ireland experienced some level of food insecurity in 2016. Based on the adult population size for these countries, this equates to 10 242 000 adults. Figure 1 shows prevalence estimates for each level of food insecurity.

Prevalence of marginal, moderate and severe food insecurity among adults in England, Wales, and Northern Ireland, 2016.
Unadjusted prevalence rates across sociodemographic characteristics are shown in table 1. Food insecurity prevalence and severity decreased with age and differed across ethnic groups, with those not identifying as white having higher rates of all levels of food insecurity. Single, divorced, separated or widowed adults also had significantly higher levels of food insecurity. About 30% of adults with children <16 years of age were food insecure, significantly higher than adults without children. Far more adults were moderately or severely food insecure in the bottom income quartile, and the same was true of those with less education. Food insecurity was elevated among adults who were unemployed or economically inactive. Adults living with a disability or illness that limited their daily activities also had higher rates of food insecurity. Food insecurity did not differ across countries, though urban areas had higher rates of marginal and moderate food insecurity.
Household food insecurity by household sociodemographic characteristics.
Multivariate analysis of the risk and severity of food insecurity
Online supplementary table 1 presents results from the generalised ordered logistic regression model. Here, after accounting for other factors, respondents in the 16–24 and 25–34 year age groups had significantly higher odds of any (but not severe) food insecurity compared with respondents in the 45–54 year age group. Respondents in the 65+ age group had significantly lower odds of any food insecurity and severe food insecurity, even after adjusting for income quartile.
Adults who did not identify as white had significantly higher odds of any (but not severe) food insecurity. Gender and marital status did not significantly relate to any level of food insecurity in the multivariate model. However, the odds of experiencing any level of food insecurity were significantly higher if there were children in the home.
Socioeconomic variables remained strongly correlated with food insecurity. Lower levels of education were associated with higher odds of any level of food insecurity and also increasing severity of food insecurity. For example, having a higher degree or postgraduate qualifications was associated with significantly lower odds of experiencing higher levels of food insecurity, even after adjusting for income quartile.
Unemployment was associated with high odds of any level of food insecurity, and the odds increased in magnitude for more severe forms of food insecurity. For unemployed respondents, the odds ratio for severe food insecurity was 4.17 (95% CI 1.3 to 12.8) even after adjustment for income quartile. The same was broadly true for people who were not working for reasons other than retirement, but this association was greatly reduced with the addition of income quartile to the model (OR 2.03, 95% CI 0.79 to 5.20).
Long-term health problems or a disability, particularly conditions which reduced daily activities a lot, were strongly associated with food insecurity, even after accounting for employment status. Moreover, the relationship between serious disabilities and health problems and food insecurity became increasingly stark for the most severe levels of food insecurity. This pattern among people living with a disability was not explained by their position in the income distribution.
Lastly, people in the lowest quartile of the income distribution were far more likely to experience any form of food insecurity and were also more likely to experience moderate and severe food insecurity (supplementary table 1).
Comparison to risk factors for food insecurity in 2004
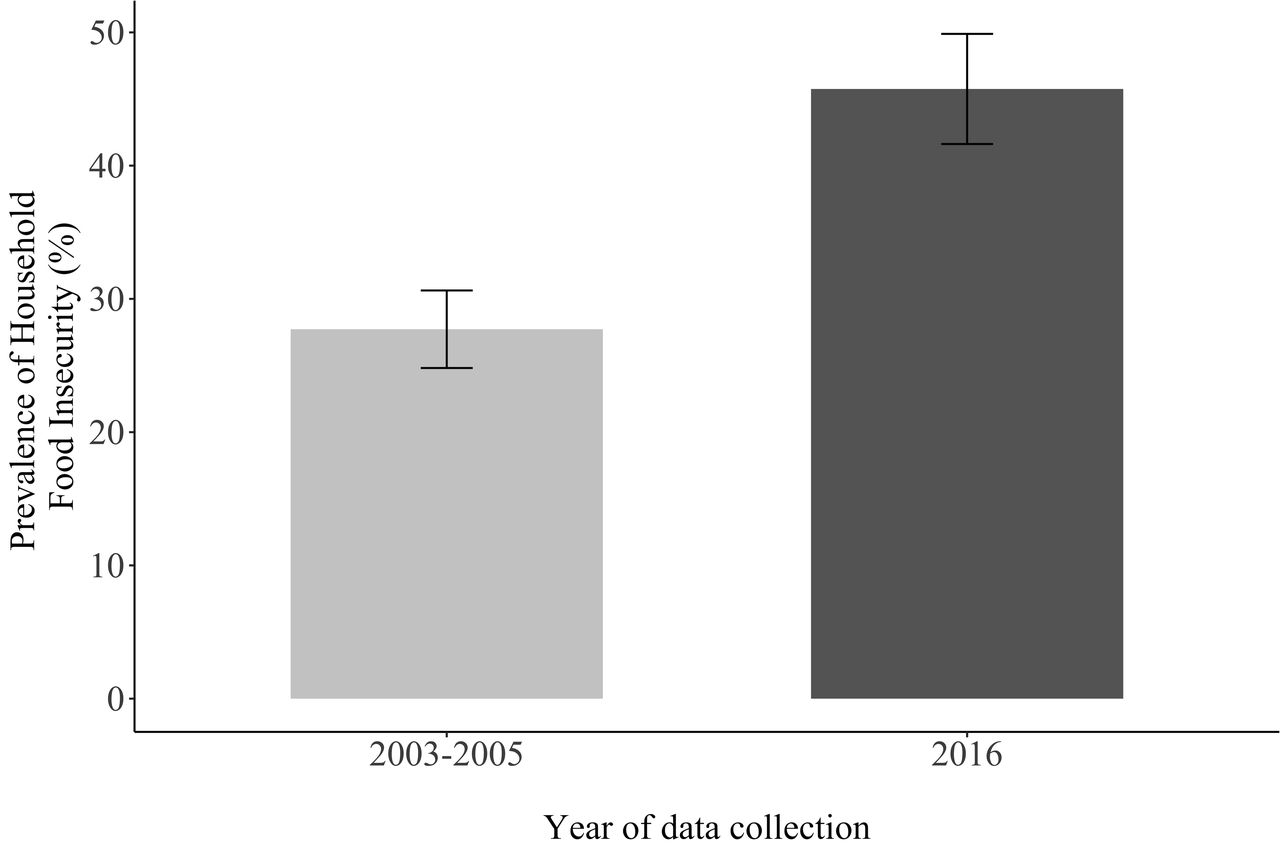
The probability of food insecurity among low-income adults increased between 2004 and 2016. As shown in figure 2, for the average low-income respondent, the predicted probability of being food insecure in 2004 was 27.7% (95% CI 24.8% to 30.6%), whereas for the average low-income respondent in the 2016 sample, this rose to 45.8% (95% CI 41.6% to 49.9%), suggesting the prevalence of food insecurity almost doubled among low-income households over this period (see online web appendix 5 for full set of logistic regression models).

Predicted probability for lowest income groups in England, Wales, and Northern Ireland in 2003–2005 versus 2016. Notes: data are a matched sample of participants from the 2003–2005 Low Income Diet and Nutrition Survey (LIDNS) and 2016 Food and You (F&Y) survey.
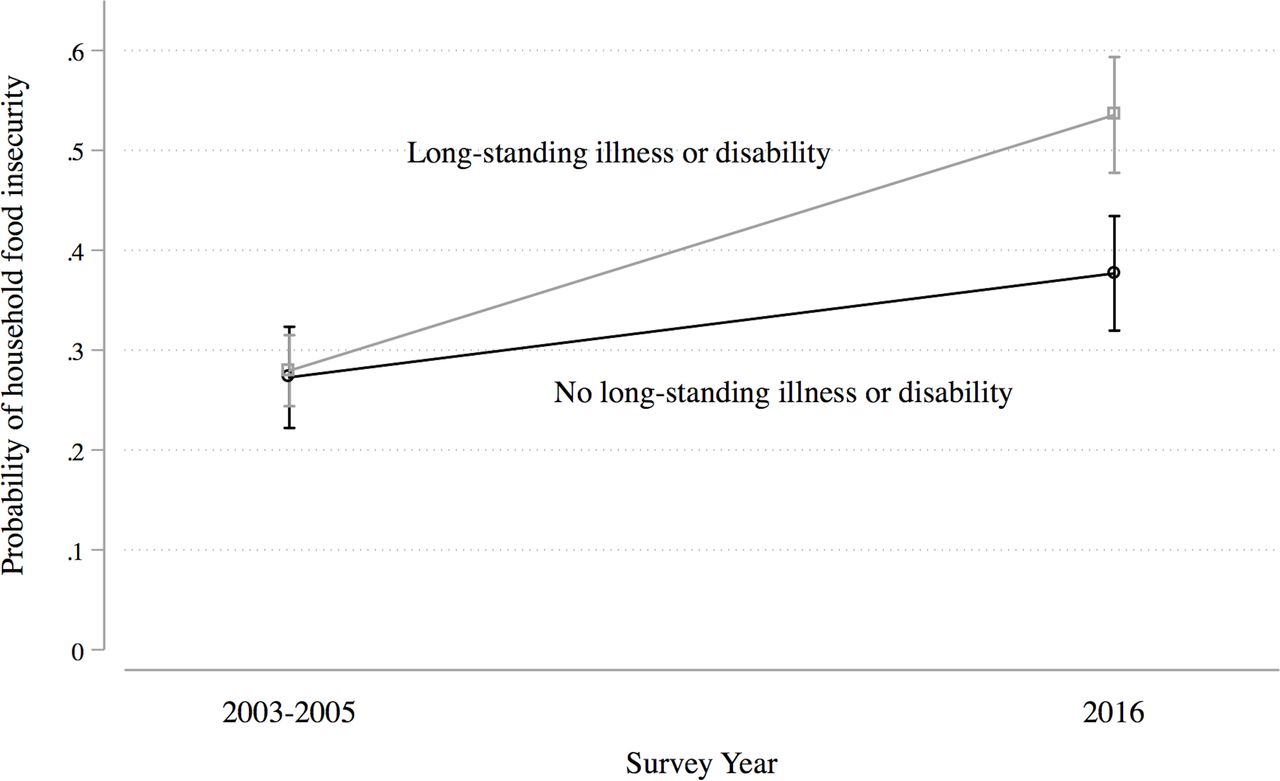
Food insecurity for people with ill-health or living with a disability changed considerably over this period. Food insecurity rose from 27.9% (95% CI 24.4% to 31.5%) in 2004 to 53.5% (95% CI 47.7% to 59.3%) in 2016. As shown in figure 3, this rise was significantly greater than that observed for households without disabilities, suggesting food insecurity rose to a significantly greater extent for households with disabilities (p for interaction term: 0.009).

Probability of food insecurity by disability status for lowest income groups in England, Wales, and Northern Ireland in 2003–2005 versus 2016.
We saw no clear change in food insecurity among those who were retired, and perhaps even a slight decline (13.2% in 2004 and 12.01% in 2016). However, food insecurity seemed to rise among those in work from 46.7% in 2004 to 59.3% in 2016, though confidence intervals overlap (online appendix 6). Similarly, there was also a substantial, though not statistically significant, increase in the predicted probability of food insecurity from 50.6% in 2004 to 69.3% among the unemployed and those not working for other reasons. The probability of being food insecure among respondents with children also rose from 51.6% in 2004 to 64.7%, but this rise did not differ from the rise observed for respondents without children.
Discussion
This study provides the only examination of how vulnerability to food insecurity has changed for those socioeconomic characteristics commonly associated with rising food bank use, namely, unemployment, disability, and children. The 2016 F&Y survey documents the scale of food insecurity across England, Wales, and Northern Ireland: one in five adults were worried about or directly experienced inadequate access to food, which is about 10.2 million adults. Younger adults, adults with children, ethnic minorities, and adults with low levels of education all faced higher risks of food insecurity. Food insecurity was both incredibly common and severe among adults who were unemployed and those who had life-limiting illnesses or disabilities. Unsurprisingly, the richest households had the lowest chance of experiencing food insecurity.
The second key contribution of this paper, beyond describing the problem today, is revealing the changing level of food insecurity among low-income households. Between 2004 and 2016, food insecurity increased 18.1 percentage points among low-income adults across England, Wales, and Northern Ireland, with a marked rise for adults who were living with longstanding illnesses or disabilities, a pattern potentially explained by welfare reforms implemented from 2010 and ongoing in 2016. While the Great Recession also occurred between 2004 and 2016 and may have contributed to a rise in food insecurity at that time, by 2016 the UK was no longer in recession. By contrast, welfare reform continued, the effects of which were keenly felt by those with longstanding illnesses.19 32
There are important limitations to our study. First, though we use a robust matching method to explore changing vulnerability to food insecurity in the UK, longitudinal data would have been preferable. Second, richer data on income, assets and employment would have enabled a more precise description of how economic resources and the nature of employment (eg, part-time work, zero-hour contracts) affect vulnerability to food insecurity.33 The crude income data and lack of deprivation measures in F&Y meant the precision of our matching procedure was limited and unobserved confounders could bias our analysis of changes in food insecurity over time. However, if anything, our results are likely biased toward under-estimating the increase between 2004 and 2016 because the 2004 sample was likely more materially deprived than the 2016 sample, where we could only restrict to the lowest income quartile. Material deprivation is closely related to food insecurity,34 35 so we would expect the 2004 sample to have higher food insecurity rates for this reason. Yet, we still observed a marked increase in the 2016 sample compared with the 2004 sample. Finally, matching approaches can reduce the representativeness of analytic samples, which means these results should not be inferred to a wider population. However, in the absence of other representative data sources, our approach provides the best estimates available of the change in food insecurity among poor households. Further, the limitations of our analysis strongly support calls for ongoing monitoring of food insecurity in the UK population (eg, the Food Insecurity Bill which was first introduced to Parliament in November 2017).36 Importantly, the Department for Work and Pensions has recently decided that as of 2019/20,37 a 30-day measure of food insecurity will be added to the Family Resources Survey. These data will enable ongoing monitoring of the risk and magnitude of food insecurity over time going forward.
Food bank data have been repeatedly but problematically used to describe food insecurity in the UK. Food banks primarily serve people who are severely food insecure and who are unemployed or living with an illness.18 Similarly, we observed that food insecurity, particularly severe food insecurity, is more common among the unemployed and those with disability. But our analysis also reveals the scale of food insecurity is larger than food bank data suggest. The Trussell Trust Foodbank Network (accounting for ~60% of food banks), distributed 1.04 million food parcels in England, Wales, and Northern Ireland in 2016/1738 to approximately 321 500 adults (see online web appendix 7 for calculation). This is less than 1/20th of food insecure adults estimated in this study. Food banks may be inaccessible to some people who are food insecure because of policies (such as the Trussell Trust’s requirement for clients to have a referral).39 Even as a proportion of severely food insecure adults, our estimates suggest Trussell Trust food parcels only reach about one quarter of these adults.
Food insecurity is linked to poor health.5 7 8 10 In part this is because poor health predisposes people to be at risk of food insecurity and our analysis has observed that those groups most at risk of food insecurity, namely people with low incomes, who are unemployed or who are living with disabilities, are also those groups who are already at risk of poor health.40 Notwithstanding these selection effects, food insecurity is also an independent predictor of worsening health, suggesting that the increased prevalence of food insecurity among these groups will likely contribute to widening health inequalities. Here, then, is another way in which welfare reform—which has disproportionately affected these same groups—is potentially exacerbating economic and social inequalities.12 13 41 42 The rising vulnerability to food insecurity observed between the 2004 LIDNS and F&Y survey suggests that the poorest in the UK are worse off today. Food insecurity has certainly always existed in the UK, but in light of the welfare changes that occurred over this period, it is possible the current social security system is providing increasingly inadequate protection from food insecurity for more and more people.
What is already known on this subject
The rapid rise in food bank use in the UK since 2010 has raised concern about household food insecurity, but little is known about risk factors for this problem in the population.
Understanding who is vulnerable and whether food insecurity has increased for particular groups is critical for design of effective interventions.
What this study adds
Based on new analyses of national survey data for 2016, this study identifies that adults with the lowest incomes, who are unemployed, or who have life-limiting disabilities are at increased risk of severe food insecurity in the UK.
Comparing these data to the last national survey in 2004, food insecurity has increased for low-income adults, but particularly among adults with disabilities.
Supplemental material
References
Footnotes
Contributors RL designed the study, conducted the analysis, and wrote the first draft of the paper. AR assisted with parts of the analysis and helped write the paper. VT provided feedback on the analysis and helped write the paper.
Funding This study has been supported from Economic and Social Research Council (ES/N017358/1) and the Joseph Rowntree Foundation's programme on 'Improving the Evidence Base for Understanding the Links between Inequalities and Poverty'.
Competing interests None declared.
Patient consent for publication Not required.
Provenance and peer review Not commissioned; externally peer reviewed.