Article Text

Abstract
Objectives To estimate global, regional (21 regions) and national (187 countries) sodium intakes in adults in 1990 and 2010.
Design Bayesian hierarchical modelling using all identifiable primary sources.
Data sources and eligibility We searched and obtained published and unpublished data from 142 surveys of 24 h urinary sodium and 103 of dietary sodium conducted between 1980 and 2010 across 66 countries. Dietary estimates were converted to urine equivalents based on 79 pairs of dual measurements.
Modelling methods Bayesian hierarchical modelling used survey data and their characteristics to estimate mean sodium intake, by sex, 5 years age group and associated uncertainty for persons aged 20+ in 187 countries in 1990 and 2010. Country-level covariates were national income/person and composition of food supplies.
Main outcome measures Mean sodium intake (g/day) as estimable by 24 h urine collections, without adjustment for non-urinary losses.
Results In 2010, global mean sodium intake was 3.95 g/day (95% uncertainty interval: 3.89 to 4.01). This was nearly twice the WHO recommended limit of 2 g/day and equivalent to 10.06 (9.88–10.21) g/day of salt. Intake in men was ∼10% higher than in women; differences by age were small. Intakes were highest in East Asia, Central Asia and Eastern Europe (mean >4.2 g/day) and in Central Europe and Middle East/North Africa (3.9–4.2 g/day). Regional mean intakes in North America, Western Europe and Australia/New Zealand ranged from 3.4 to 3.8 g/day. Intakes were lower (<3.3 g/day), but more uncertain, in sub-Saharan Africa and Latin America. Between 1990 and 2010, modest, but uncertain, increases in sodium intakes were identified.
Conclusions Sodium intakes exceed the recommended levels in almost all countries with small differences by age and sex. Virtually all populations would benefit from sodium reduction, supported by enhanced surveillance.
- Nutrition & Dietetics
- Epidemiology
- Hypertension < Cardiology
- Preventive Medicine
This is an Open Access article distributed in accordance with the Creative Commons Attribution Non Commercial (CC BY-NC 3.0) license, which permits others to distribute, remix, adapt, build upon this work non-commercially, and license their derivative works on different terms, provided the original work is properly cited and the use is non-commercial. See: http://creativecommons.org/licenses/by-nc/3.0/
Statistics from Altmetric.com
Strengths and limitations of this study
-
This is the first study to produce comprehensive and comparable estimates of sodium intake and their uncertainties, globally.
-
We identified and made use of a much larger set of primary data sources than previous collations.
-
Our Bayesian estimation model used all available data by converting self-reported dietary values to comparable 24 h urine values and was informed by regional hierarchies and country-level covariates.
-
In the absence of established conventions for measuring and reporting sodium intakes we have used 24 h urinary excretion, uncorrected for non-renal losses, as a proxy measure. Variation in non-renal (sweat) losses associated with climate or activity levels could introduce additional biases.
-
Use of biochemical markers to assess and control the completeness of urine collections was uncommon, impeding adjustment for likely downward biases from incomplete collections.
-
Twenty-four hours urine collections mostly came from small surveys that were not based on national probability sampling with consequent sampling bias.
-
Primary data were deficient for much of the global population.
Introduction
Excess sodium intake raises blood pressure (BP),1 ,2 a major risk factor for cardiovascular disease3 ,4 and increases risk of stomach cancer,5 ,6 a leading fatal cancer globally.7 On the basis of established risks across the current range of population intake levels, the major international and national agencies have prioritised sodium reduction to decrease the burdens of non-communicable disease.8–11 Such efforts have been limited, at least in part, by the absence of reliable and comparable data on sodium intake for most of the countries.12 This has made it difficult to quantify global, regional or national levels of dietary sodium and the corresponding preventable disease burdens. Changes in national, regional and global sodium intakes over time are also not well established.
We therefore systematically reviewed and accessed the published and unpublished country-specific surveys of sodium intakes from around the world as part of the 2010 Global Burden of Diseases (GBD), Injuries and Risk Factors Study. We developed quantitative methods to produce comparable global, regional and country-specific estimates of sodium intake, by age and sex subgroups, in 1990 and 2010.
Methods
Study design
We estimated mean sodium intake and its uncertainty by age and sex for 187 countries in 1990 and 2010. Our strategy included three steps: (1) systematic searches for data sources from around the world on individual-level sodium intake, including by age and sex subgroups; (2) retrieval of data, including assessment of data quality, representativeness, missingness and uncertainty, and quantification of measurement comparability across different survey methods and (3) application of an hierarchical Bayesian estimation model to incorporate missingness, comparability and sampling and modelling uncertainty to estimate sodium intake by age, sex, country and time worldwide.
Identification of surveys, access and extraction
Between October 2008 and November 2011, we performed systematic searches to identify urine-based and diet-based surveys (figure 1). The overall search strategy and results have been described.13 ,14 Sources for diet-based measurements were primarily national surveys that had incorporated sampling weights, as appropriate. For countries with no national dietary surveys identified, other potential sources were considered, including subnational surveys, household budget survey data, baseline measurements in large cohort studies, the WHO InfoBase and the STEPS database, published government reports, published sources not previously identified and unpublished data. These searches were complemented by extensive direct contacts with local experts and requests for detailed data.

Search strategies for global sodium exposure data: urine-based (left) and diet-based (right). Note: The black dashed lines show dietary Na assessment studies that were identified through the search for 24 h urinary sodium excretion studies.
For urine-based assessments, we searched MEDLINE using the following terms: ((World regions (Mesh)) OR (Name of countries)) AND (salt OR sodium OR Na) AND (intake OR ingest* OR eat* OR consum* OR diet* OR urin* OR excret*) Limits:Humans, All Adult: 19+ years, publication date from 1 January 1980.
We also searched for national dietary survey reports and manually searched the reference lists of retrieved articles. We searched publications and web pages of organisations engaged in sodium reduction at national (eg, UK Food Standards Agency), regional (eg, European salt reduction programme) and international levels (eg, World Action on Salt and Health) and contacted the nutritional departments of WHO regional offices. Where duplicate sources were identified we retained the report with most detail and with most information on the primary metric.
Surveys could be included if they were performed after 1980 and were from a sample that was representative of a national (or if no national survey, a subnational) population; if the assessment methods included 24 h urinary excretion measurements, a diet assessment tool (eg, diet record, diet recall, food frequency questionnaire or both and if there was no evidence suggestive of major selection bias. For example, we excluded studies based exclusively on individuals with hypertension or on pregnant women. Surveys conducted at different locations within a country were counted as different surveys unless they were part of a formal multistage sampling design intended to characterise a larger (regional or national) population.
In sum, we identified 142 urine-based surveys and 103 diet-based surveys—with 26 of each forming paired surveys of the same population (figure 1 and table 1).
Classification of 245 surveys of sodium intake by exposure metric reported, period of survey and national representativeness, with pairs of surveys reporting in both metrics identified
Data retrieval and standardisation
As the published exposure data were often limited or not in the required format, we obtained data by direct contacts with government officials, scientists and survey report authors from across the world, who joined our group as corresponding members (see list of contributors and see online supplementary table). These individuals provided us with either raw data or standardised analyses using an electronic form.13 Survey characteristics were extracted including date of fieldwork, sampling methods, proportion participating, representativeness, population characteristics, the number of participants by age and sex strata, types and the number of measurements (urine, diet including type of dietary tool), validation methods, energy adjustment (for diet-based data) and mean and SD of sodium intake by age and sex groups. To reduce the measurement errors in dietary estimates by accounting for tendencies to under-report or over-report the intakes of all foods,15 dietary data were energy-standardised to 2000 kcal/day (8.37 MJ/day). Urinary data were not standardised to energy.
Owing to known larger measurement errors in diet-based methods,16–18 we chose 24 h urinary excretion as our primary metric, and dietary estimates as our secondary metric. We estimated the quantitative relationship between urine and dietary measurements using 79 datapoints from 26 surveys having data on the same individuals in both metrics, and used these results to estimate urinary excretions corresponding to the dietary values in the remaining dietary surveys (figure 2). Consequently, our final estimates represent sodium ‘intake’ using 24 h urine collections as the reference. We elected not to adjust these final estimates for non-urinary losses (eg, sweat) because urinary excretion accounts, on an average, for ∼90% of dietary intake19–21 and also to enhance the comparability with prior estimates of sodium intake (mostly reported as unadjusted 24 h urinary sodium excretion). The possibility that sweat losses vary systematically with climate needs to be clarified by further research. We also did not attempt to adjust these estimates for potential incomplete collections, which are common even in research settings.22 Thus, our final estimates of dietary intake can be considered conservative estimates of true sodium consumption.

Relationship between measured urinary sodium and measured dietary sodium in 79 age/sex strata from 26 survey pairs. Note: The solid line represents the cross-walk regression line (linear regression of log-transformed urinary sodium on log-transformed dietary sodium); and the dotted lines, the 95% uncertainty intervals. With the partial exception of 8 age and sex strata (all from 2 of the 3 InterMap study sites in China) in which urinary sodium levels were systematically higher relative to their dietary levels, good agreement was seen between the two metrics. The regression coefficients obtained from this analysis informed the Bayesian hierarchical model of the relationship between the two metrics. Adding a term to identify the survey sites generating the outlying points increased the R2 to 0.79 but it was not retained because this term did not correspond to a generic survey characteristic that could be used in predictions outside the cross-walk dataset. The wider uncertainty bounds for the modelled relationship in the upper part of its range reflect the influence of the outliers.
Bayesian hierarchical model
To account for differences in missingness, representativeness and measurement methods and to incorporate and quantify uncertainty, we specified a Bayesian hierarchical model (using the DisMod-MR model developed as part the Global Burden of Disease Project) to estimate the mean sodium intake across the world by sex, age and country for two calendar years—1990 and 2010. The data from country-specific age and sex subgroups were used simultaneously as inputs, with country, regional and global random effects. This structure allowed the model to borrow information across countries and regions as necessary, using spatial-temporal regression and Gaussian process regression, while accounting for and quantifying the resulting statistical uncertainties. Representativeness (national with or without probability sampling, subnational) were included as a survey-level covariate. Time-varying country-level covariates further informed the estimates, including lag-distributed national per capita income (inflation and purchasing power parity adjusted23) and national dietary patterns characterised by scores on four components from a dimension reduction through principal components analysis of 15 diet composition variables from the Food and Agriculture Organisation (FAO) food balance sheets. As sodium intakes may be non-linearly associated with age, relationships with age were modelled using a cubic spline.
We fitted the Bayesian model with the Markov chain Monte Carlo algorithm and ran 1000 iterations. Posterior distributions of mean sodium intake for each country by age and sex subgroups were obtained, incorporating and reflecting the above sources of uncertainty. Ninety-five per cent uncertainty intervals were obtained from the 2.5th and 97.5th centiles of the posterior distributions.
Intakes were estimated from the model for 5-year age intervals and by sex of the adults aged 20 years or more for each country for 1990 and 2010. Regional estimates were calculated as population-weighted averages of the constituent country estimates. Intakes for each country, region and time period are reported, both actual intakes (potentially of greater relevance to assessing contributions to local disease burdens) and age-standardised intakes24 (for comparing the levels across populations and over time).
Further details on the modelling process and its outputs are provided in the online methodology supplement.
Results
Data sources
We identified and obtained data from 245 surveys, including 142 reporting 24 h urinary sodium data and 103 reporting dietary sodium data, with 26 of each forming urine/diet survey pairs. These surveys were conducted in 66 countries comprising 74% of the global adult population. Sixty-one per cent (149) of the surveys were conducted in high-income regions and 40% (96) in low-income and mid-income regions (table 1; details for each contributing survey are provided in the online supplementary table). East Asia (23 surveys) was the only low-income or mid-income region with more than 10 surveys. Counting as a datapoint each estimate for an age–sex stratum, the identified surveys provided 1346 datapoints (mean: 5.5/survey), of which 651 were urine based and 695 were diet based. More than half (376/651) of the urine-based datapoints came from the Intersalt study, a major international study with standardised protocols conducted between 1985 and 1987.25 Fifty datapoints, all in European regions, were from collections biochemically validated for completeness using para-amino benzoic acid.26 Ten countries had at least 20 urine-based datapoints, including the USA (86), the UK (86), Japan (48), China (41), Italy (33), Belgium (24), Finland (24), Germany (24), New Zealand (22) and the Netherlands (20). Urine-based data were relatively scarce in the highest age groups, with only two urine-based datapoints for age groups 70+ years; in contrast, 97 diet-based datapoints were available for these older age groups.
Global and regional sodium intakes
In 2010 global, mean (95% uncertainty interval) sodium intake in adults was 3.95 (3.89–4.01) g/day, equivalent to salt intakes of 10.06 (9.88–10.21) g/day (based on the assumption, conventional in this context, that all the sodium comes from salt). Globally, mean intake in men was, as expected, higher than that in women: 4.14 (4.04–4.23) vs 3.77 (3.69–3.85) g/day, respectively. In every region, sodium intake was lower in women, ranging from 8.9% lower in South Asia to 10.7% lower in Western Europe. Given these consistent, modest differences, additional findings are presented for both sexes combined.
Interestingly, we also identified a relatively little variation in sodium intakes by age. Globally, mean intakes rose by ∼6% from age 25–29 (3.78 g/day) to 40–44 (4.04 g/day), and then remained relatively constant thereafter. This pattern was broadly consistent across each of the 21 GBD Study regions (figure 3).
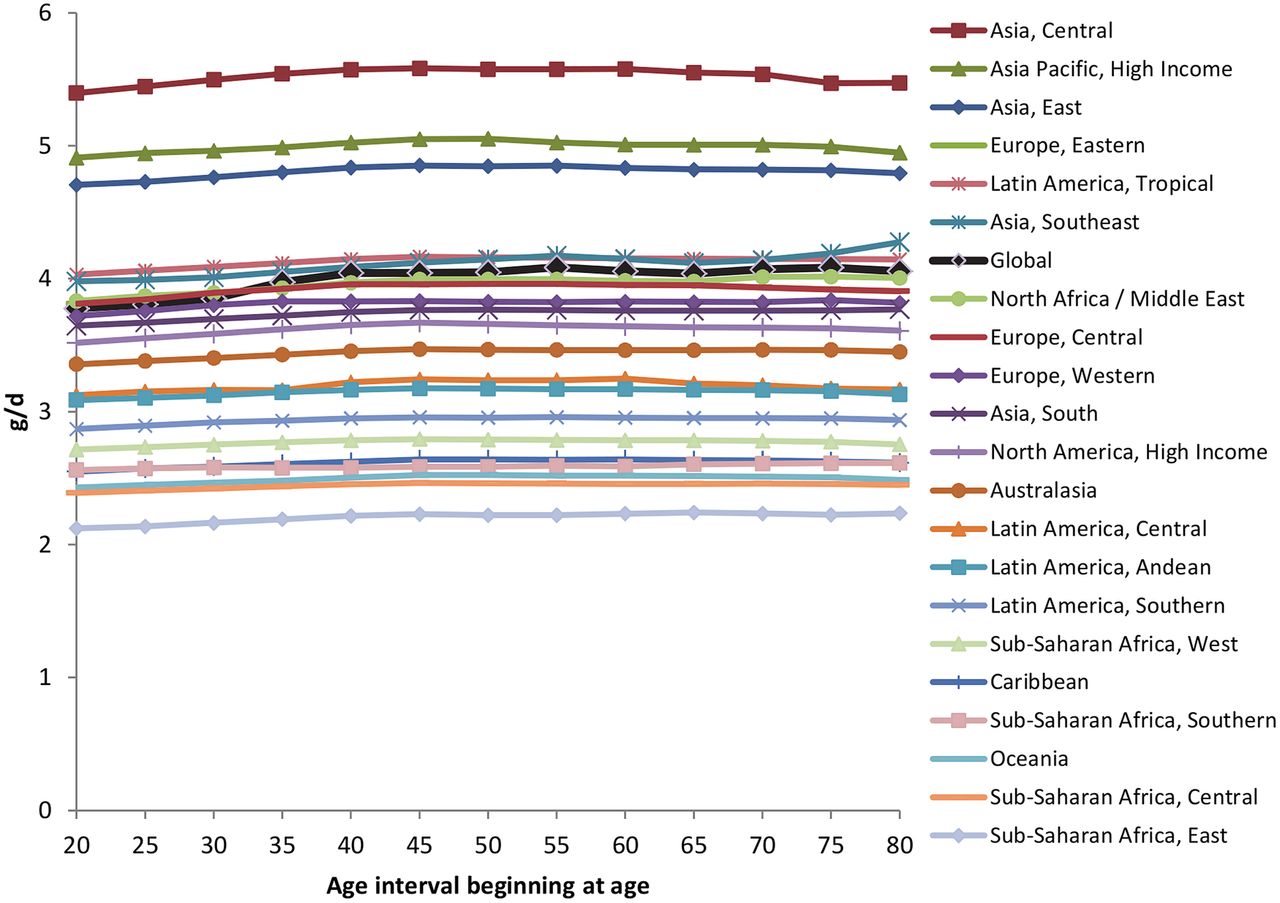
Sodium intakes in g/day by age, for regions and globally, both sexes combined, 2010.
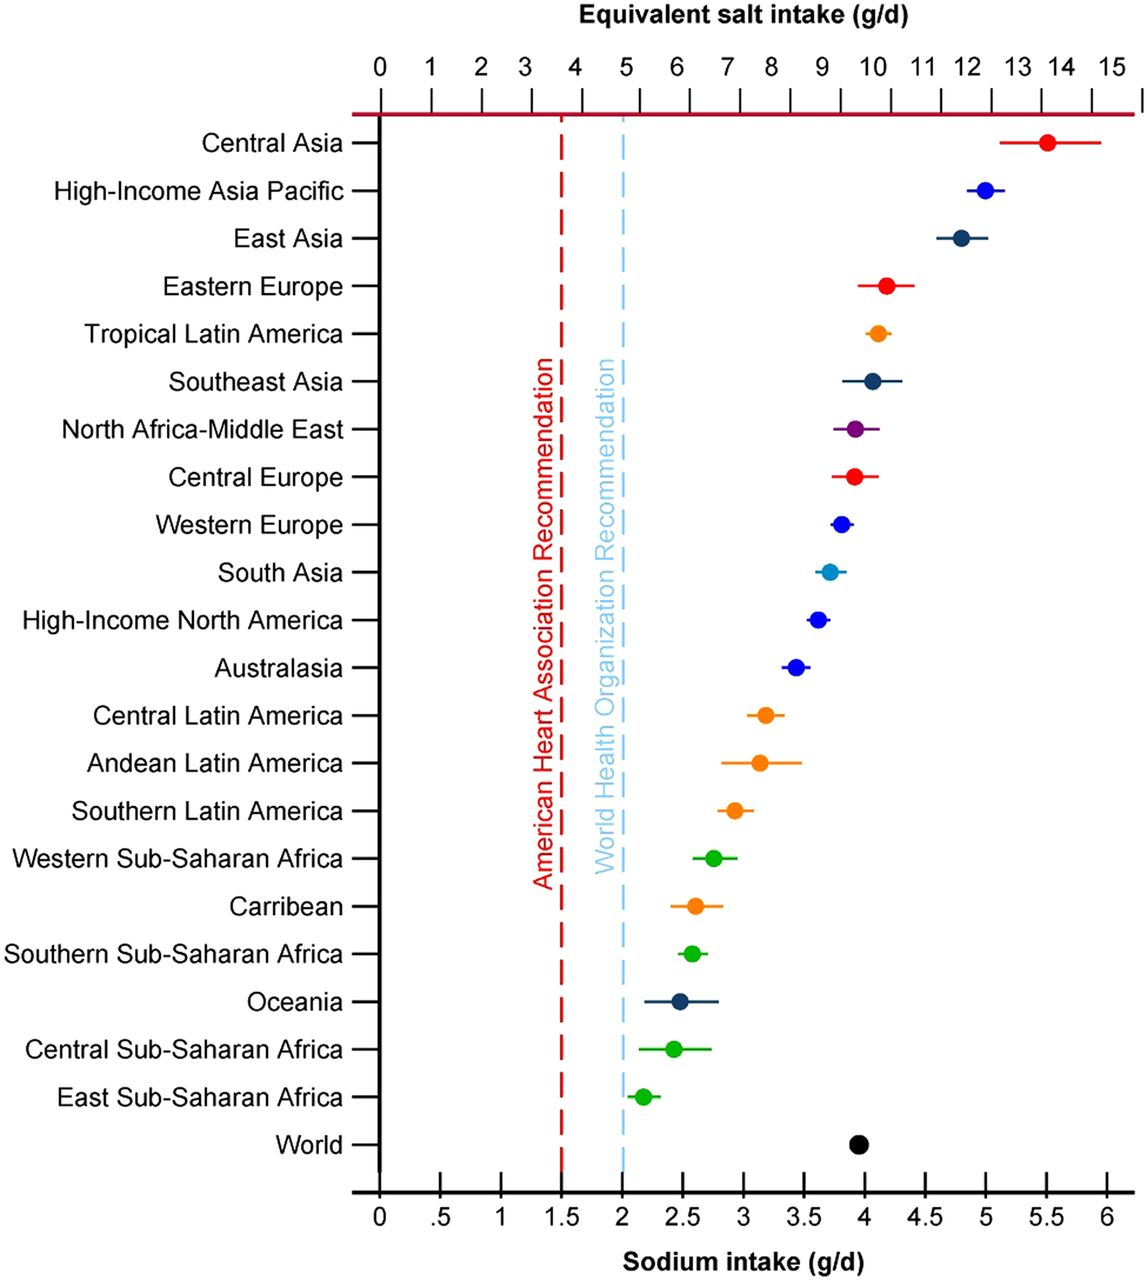
In contrast to small within-region differences by age or sex, marked differences in intake were identified across regions (figures 4 and 5). Asian regions had highest intakes—East Asia (mean, 95% uncertainty interval) 4.80 (4.59–5.02) g/day, Asia Pacific High Income (mainly Japan and South Korea) 5.00 (4.85–5.16) g/day, and Central Asia 5.51 (5.11–5.95) g/day—corresponding to daily salt intakes of 12.21, 12.71 and 14.01 g, respectively. Very high intakes were also seen in Eastern Europe (4.18 (3.95–4.41) g/day, Central Europe (3.92 (3.73–4.12) g/day and the Middle East and North Africa (3.92 (3.74–4.12) g/day. Among high-income Western regions, sodium consumption was 3.44 (3.32–3.55) g/day in Australia/New Zealand, 3.62 (3.52–3.72) g/day in the USA/Canada and 3.81 (3.72–3.91) g/day in Western Europe—equivalent to salt intakes of 8.75, 9.21 and 9.69 g/day, respectively.

Mean (95% uncertainty interval) sodium intakes (g/day) in 2010 in 21 Global Burden of Diseases regions. Note: Regions are ranked by levels in both sexes combined, ages 20+. Intakes are not age-standardised.

Mean (95% uncertainty interval) age-standardised sodium intakes (g/day) in 1990 and 2010 in 21 Global Burden of Diseases regions. Note: The upper symbol for each pair is for 2010. Regions are ranked by levels in both sexes combined, ages 20+.
Sub-Saharan Africa, Latin America and the Caribbean and Oceania tended to have lower estimated intakes, but also were based on fewest data sources among all the regions, with resulting larger uncertainties. For example, estimated intakes in sub-Saharan Africa ranged from 2.18 (2.05–2.32) g/day in Eastern sub-Saharan Africa to 2.76 (2.58–2.95) g/day in Western sub-Saharan Africa and estimated intake in Oceania was 2.48 (2.18–2.80) g/day. Mean intakes were similar or higher in Latin America and the Caribbean, including 2.61 (2.40–2.83) g/day in the Caribbean, and 3.19 (3.03–3.34) g/day in Central Latin America. Intake in Tropical Latin America (mainly Brazil) was higher than in other Latin American regions and, at 4.11 (4.01–4.22) g/day, exceeded that for the USA/Canada.
National sodium intakes
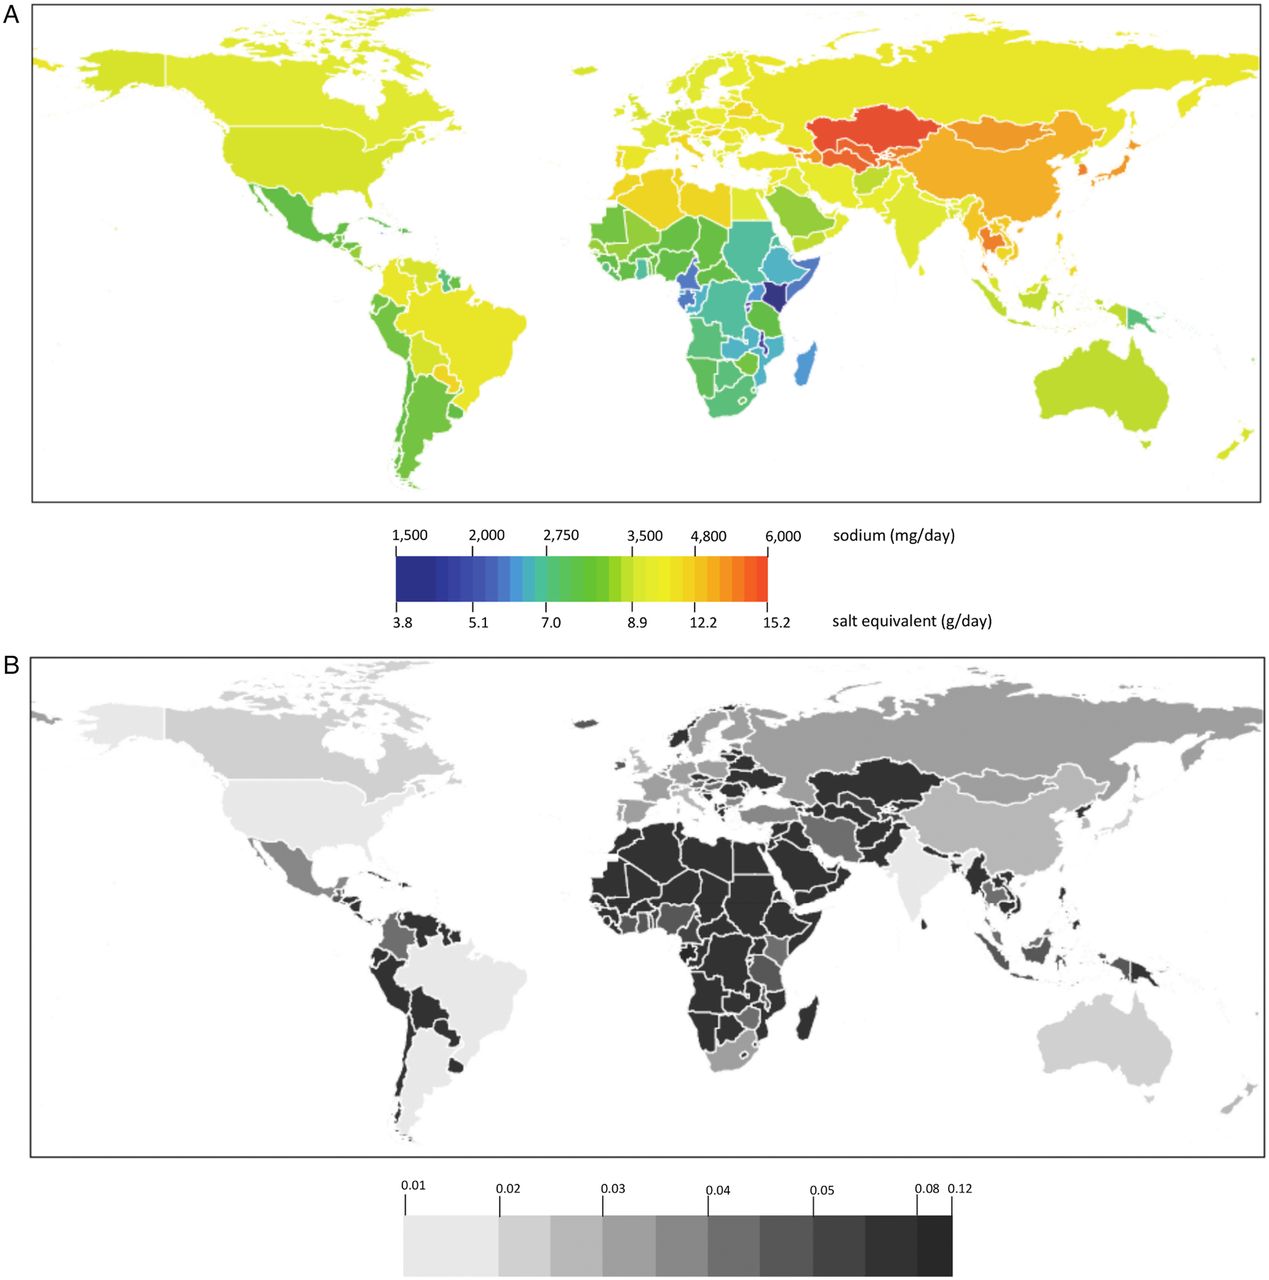
We identified substantial variation in estimated sodium intakes across nations (figure 6A and table 2). The statistical uncertainty around the estimated intakes for individual countries (figure 6B) was larger than that for world regions, especially for countries with no primary data. Thus, relative rankings across different nations should be interpreted in the light of their relative uncertainty levels.
Age-standardised estimated sodium intakes (g/day) in 1990 and 2010, persons aged 20 and over, by country (95% uncertainty intervals)
Sodium intakes by country, for ages 20+, average of both sexes, in 2010. (A) Mean intakes in g/day and (B) relative uncertainty*. Note: *Monte Carlo SEs divided by the mean of these intake estimates.
In Western Europe, a region with relatively low uncertainty, estimated mean intakes ranged from 3.28 (2.99–3.59) g/day (Denmark) to 4.43 (4.23–4.62) g/day (Italy). Estimated intakes in the Netherlands, Belgium, Germany and Iceland ranged from 3.33 to 3.59 g/day; in another 12 Western European countries, from 3.62 (3.41–3.86) g/day (Switzerland) to 4.03 (3.78–4.27) g/day (Spain); and in Cyprus, Luxemburg, Malta, Portugal and Italy, from 4.06 to 4.43 g/day.
Estimated intakes within North Africa/Middle East were also diverse, ranging from 3.13 (2.77–5.54) g/day in Lebanon to 5.37 (4.85–5.92) g/day in Bahrain. In Eastern sub-Saharan Africa, estimated consumption was higher in Mauritius (5.45 (4.57–6.50) g/day) than in other neighbouring countries (mean intakes ranging from 1.47 to 4.32 g/day).
In other regions, less variation in sodium intake was identified. For example, sodium consumption was very similar in the USA (3.61 (3.51–3.71) g/day) versus Canada (3.72 (3.59–3.84) g/day). In addition, relatively small within-region differences were observed in Australia/New Zealand, Eastern Europe, South Asia and each of the regions of Latin America.
Overall in 2010, estimated mean intakes in 181 of 187 countries, whose total adult population accounted for 99.2% of the world adult population, exceeded the WHO recommendation of 2.00 g/day sodium (∼5 g/day salt).27 In 119 countries (with 88.3% of the world's adult population), estimated mean intakes exceeded this recommended amount by at least 1 g/day; and in 51 countries (44.8% of the world's adult population), estimated mean intakes were more than double this recommended amount.
Changes over time
Globally, between 1990 and 2010, modest, statistically non-significant global increases were seen, from 4.02 (3.93–4.11) to 4.14 (4.04–4.23) g/day in men and from 3.63 (3.55–3.71) to 3.77 (3.69–3.85) g/day in women. By region, estimated increases were larger for East Asia, from 4.37 (4.18–4.58) to 4.80 (4.59–5.02) g/day, and Eastern Europe, from 3.76 (3.55–3.97) to 4.18 (3.95–4.41) g/day (for both sexes combined). These estimated increases appeared sensitive to the large proportion of urine-based data in earlier years that were collected in Intersalt (1985–1987). When only diet-based data were evaluated, the direction of secular change tended to reverse (data not shown). Thus, estimates of trends over time should be interpreted cautiously. Figure 5 and table 2 show changes in age-standardised estimates for regions and countries, respectively.
Discussion
Our findings provide systematically assessed and comprehensive evidence on global, regional and national intake levels and patterns of sodium consumption, including by age and sex. Several findings are notable. Within regions and countries, only small differences were evident comparing younger with older adults or men with women. This suggests relatively constant and common exposures to sodium within populations. On the other hand, marked differences were evident between regions and between countries. Interestingly, these differences were not strongly related to national income, suggesting that in contrast to many other dietary components that are linked to national wealth or affluence, sodium intake is more strongly influenced by other factors. For example, the geographic distribution of highest intakes from East Asia to Eastern and Central Europe suggests a ‘Silk Road’ pattern, implying shared retentions from past transportation and food cultures such as use of salt for food preservation.28
A recent Institute of Medicine committee concluded that, based only on studies of the association between sodium intake and incidence of clinical events (ie, ignoring effects on BP), evidence was insufficient to conclusively choose between modest (eg, 2.3 g/day) and low (eg, 1.5 g/day) sodium intakes as long-term targets for populations.29 The resulting controversy over this somewhat narrowly based judgement overshadowed their other main conclusion that, considered collectively, the evidence indicated a positive relationship between high sodium intakes and cardiovascular events and was consistent with BP-raising effects of dietary sodium. Numerous other organisations have systematically reviewed the evidence and concluded that intakes of sodium above the levels variously specified in the range 1.2–2.4 g/day increase cardiovascular risk.11 ,27 ,30 Thus, while identified optimal target intakes have varied from 1.20 to 2.4 g/day,27 ,30 ,31 all have consistently concluded that sodium intakes above these levels are adverse for health. Our findings demonstrate that, whether modest (2–2.4 g/day) or low (1.20–1.5 g/day) target intakes are designated as optimal, virtually every nation in the world, and each age and sex group within these nations, exceed these optimal intakes.
The Intersalt study provided the first extensive body of comparable urine-based data on sodium consumption globally, with results from 52 surveys in 30 countries reported in 1988 and 1989.25 In 2009, Brown et al12 produced a tabular update of 11 diet-based and 26 urine-based surveys published after Intersalt. We are not aware of any other reports that have estimated national sodium intake levels globally.
Strengths and innovations of our investigation can also be highlighted. We systematically identified and extracted data from around the world on both urinary and dietary sodium, including many sources of previously unavailable data. We evaluated and incorporated the evidence for systematic differences between urinary and dietary estimates, increasing the comparability and allowing us to draw on the different strengths of each. In contrast with diet-based surveys many of which were based on national probability samples, urine-based surveys were often of smaller size and representative only of local populations. Our model takes advantage of all available raw data in the world; a cross-walk to render self-reported dietary values more comparable to 24 h urine values, based on empirical relations between these measures; and then the relation between these data and global country-level covariates (national income per person, age, sex, FAO factor analysis) in a Bayesian hierarchical fashion.
Potential limitations should be considered. Primary data sources were limited or missing in many countries. Our model dealt with this by ‘borrowing’ information within and across countries, regions and time, based on both country-level and survey-level covariates; it also incorporated missingness and types of available data to quantify the final uncertainty. For regions and their constituent countries where primary exposure data are limited or absent (eg, sub-Saharan Africa, central and Latin America, Andean), relative uncertainty is correspondingly greater: their Monte Carlo SEs exceed 9% of their means, compared with 2.5% for the relatively data-rich region of Western Europe. For data-deficient regions final estimates correspond to their priors, which depend in turn on spatio-temporal ‘borrowing’ and on the use of covariates. Model outputs for such regions (see figures S1, S3 and S4 in the online methodology supplement) show that the coefficients for the fixed effects of the FAO diet composition components (especially component 1) are larger than the coefficients for income (which were expected to be low). The assumption of our Bayesian approach is that the final estimations, informed by the raw data, covariates and regional hierarchy, are closer to the ‘truth’ than any isolated datapoint. A substantial reduction of uncertainty in the estimates for data-deficient regions and countries must await the carrying out of good-quality national surveillance studies so that the dependence of final estimates on priors, and their associated uncertainties, is reduced.
We had more limited data across time to quantify temporal trends in intakes. In addition, our analysis evaluated intakes in 1990 and 2010, which does not exclude larger changes over a broader time horizon. For instance, reported intakes in Japan,32 Portugal33 and Finland34 from several decades ago were much higher than our recent estimates. This implies potentially large reductions in sodium intakes in these countries over time frames longer than that covered in our study, consistent with changes in traditional methods of food preservation made possible by widespread refrigeration.35 Conversely, recent increased global consumption of highly processed foods36 may be countering or even reversing these historical associations between modernisation and declining sodium intakes.
In May 2013, the 66th World Health Assembly followed up the 2011 United Nations High-Level Summit on the Prevention and Control of Non-Communicable Diseases with a resolution endorsing a global action plan that included a proposed 30% reduction in salt/sodium intake.37 Our findings can help inform the planning and design of such high-priority programmes. Optimal strategies for reducing sodium will partly depend on the proportion of dietary sodium derived from cooking or table salt (eg, relatively high in Asian nations) versus prepared or industrialised foods (eg, the majority in high-income Western nations).12 In a limited number of high-income countries, sustained, coordinated public health programmes have helped lower sodium intakes, for example, in Japan,38 Finland34 and the UK.39 The most recent surveillance data from the UK (too late for inclusion in our model) documents a 15% reduction in mean sodium intakes over the preceding decade, coinciding with a coordinated national programme which includes formal food industry commitments.40 Media and educational programmes can also have an impact in countries where substantial proportions of dietary sodium are added during household food preparation and at the table.41 Simulations suggest that population-wide sodium reduction strategies would not only be cost-effective, but could also be cost-saving.42–44 While the food industry often cites taste as a major barrier to sodium reduction, our findings provide empiric evidence on the remarkable adaptability of the human palate to preference for salt,45 with usual sodium intakes varying more than 2.5-fold across world regions and fourfold across nations.
Our results also highlight the data gaps and the need for improved surveillance of sodium intakes using transparent, validated and comparable methods. If a gold standard were specified for the national surveillance of sodium intakes it would likely entail the combination of repeated national probability sampling and the use of 24 h urine collections biochemically validated for completeness.22 ,40 To our knowledge, only the UK has implemented such a system. Yet, despite the limitations of the primary data sources available to us, our estimates of mean intakes, interpreted in conjunction with their uncertainties, indicate that, for virtually all countries, it is likely to be some time before mean intakes approach levels at which the benefits of further reduction may be uncertain.29 Thus, the remaining uncertainties highlighted by our work inform the need for enhanced surveillance and further research, but do not alter the imperative for strong, active public health policies to reduce national sodium intakes from their current levels.
Acknowledgments
The authors are especially grateful to the members of their Sodium Advisory Group: Feng He, PhD, Wolfson Institute of Preventive Medicine, Barts and The London School of Medicine and Dentistry, London, UK; Bruce Neal, PhD, The George Institute of Global Health, University of Sydney, Sydney, Australia; Graham MacGregor, PhD, Wolfson Institute of Preventive Medicine, Barts and The London School of Medicine and Dentistry, London, UK. The authors would like to thank Mitul Shah and Gitanjali Singh for providing analytic and administrative support and Paul Pharoah for supervision. They also thank the Russia Longitudinal Monitoring Survey Phase 2, funded by the USAID and NIH (R01-HD38700), Higher School of Economics and Pension Fund of Russia, and the University of North Carolina Population Center (5 R24 HD050924) (Source: ‘Russia Longitudinal Monitoring survey, RLMS-HSE’, conducted by HSE and ZAO ‘Demoscope’ together with Carolina Population Center, University of North Carolina at Chapel Hill and the Institute of Sociology RAS (RLMS-HSE sites: http://www.cpc.unc.edu/projects/rlms, http://www.hse.ru/org/hse/rlms)) for sharing the data with them. The authors would like to thank Barbara Bowman, MS, PhD, National Center for Chronic Disease Prevention and Health Promotion, Centers for Disease Control and Prevention, Atlanta, Georgia, USA; Patricia Constante Jamie, School of Public Health, University of São Paulo, Sao Paolo, Brazil; Karen Lock, London School of Hygiene and Tropical Medicine, London, UK; and Joceline Pomerleau, London School of Hygiene and Tropical Medicine, London, UK for advising and guidance on initial search strategy. They also thank Louise Dekker; Jenna Golan, MSc, Harvard School of Public Health, Boston, Massachusetts, USA; Liesbeth Smit, Harvard School of Public Health, Boston, Massachusetts, USA; and Georgina Waweru for providing analytic and administrative support.
References
Supplementary materials
Supplementary Data
This web only file has been produced by the BMJ Publishing Group from an electronic file supplied by the author(s) and has not been edited for content.
Files in this Data Supplement:
- Data supplement 1 - Online supplement
- Data supplement 2 - Online figures
- Data supplement 3 - Online table
Footnotes
JP and SF contributed equally.
-
Collaborators The following are members of the Global Burden of Diseases Nutrition and Chronic Diseases Expert Group (NutriCoDE) core group: Dariush Mozaffarian (USA), Majid Ezzati (UK), Saman Fahimi (USA), Shahab Khatibzadeh (USA), Renata Micha (Greece), John Powles (UK), Peilin Shi (USA). Members of Cancer Relative Risks subgroup: Tim E Byers (USA); Edward Giovannucci, PhD, Harvard School of Public Health, Boston, Massachusetts, USA; Stephanie Smith-Warner, PhD, Harvard School of Public Health, Boston, Massachusetts, USA. Other Members of NutriCoDE: Ibrahim Elmadfa, PhD, Institute of Nutritional Sciences, University of Vienna, Vienna, Austria; Shadi Kalantarian, MD, MPH, Harvard School of Public Health, Boston, Massachusetts, USA; Mayuree Rao, BA, The Warren Alpert Medical School of Brown University, Providence, Rhode Island, USA; Pattra Wirojratana, Harvard School of Public Health, Boston, Massachusetts, USA. Members of Dietary Exposure Estimation subgroup: Stephen S Lim, PhD, Institute for Health Metrics and Evaluation, University of Washington, Seattle, Washington, USA; Kathryn G Andrews, MPH, African Leaders Malaria Alliance, Dar es Salaam, Tanzania; Rebecca E Engell, BA, Institute for Health Metrics and Evaluation, University of Washington, Seattle, Washington, USA. Urine-based Sodium Exposures—Intersalt and Intermap: Paul Elliott, PhD, Department of Epidemiology and Biostatistics, School of Public Health, Imperial College London, London, UK; Ian Brown, PhD, Public Health Specialty Training Program, NHS East of England Multi-Professional Deanery, Fulbourn, UK. Urine-based Sodium Exposures—corresponding members: John Britton, PhD, Division of Epidemiology and Public Health, University of Nottingham, Nottingham, UK; Andrew Fogarty, PhD, Division of Epidemiology and Public Health, University of Nottingham, Nottingham, UK; Mary Anne Land, MPH, doctoral student, The George Institute of Global Health, University of Sydney, Sydney, Australia; Sarah Lewis, PhD, Division of Epidemiology and Public Health, University of Nottingham, Nottingham, UK; Tricia McKeever, PhD, School of Community Health Sciences, University of Nottingham, Nottingham, UK; Bruce Neal, PhD, The George Institute of Global Health, University of Sydney, Sydney, Australia; Marga C Ocké, PhD, National Institute for Public Health and the Environment (RIVM), PO Box 1, 3720 BA Bilthoven, The Netherlands; Jacqui Webster, PhD, The George Institute of Global Health, University of Sydney, Sydney, Australia. Dietary Exposures—corresponding members: Pamela A Abbott, PhD, University of Aberdeen, UK; Morteza Abdollahi, MD, MPH, National Nutrition and Food Technology Research Institute, Iran, Iran; Enrique O Abeyá Gilardon, MD, MPH, Ministerio de Salud, Argentina; Habibul Ahsan, MD, University of Chicago, USA; Mohannad Abed Alfattah Al Nsour, MD, Eastern Mediterranean Public Health Network (EMPHNET), Jordan; Suad N Al-Hooti, MSc, Kuwait Institute for Scientific Research, Kuwait; Carukshi Arambepola, MD, Faculty of Medicine, University of Colombo, Sri Lanka; Hubert Barennes, PhD, Institut Francophone pour la Médecine Tropicale, Lao PDR; Simon Barquera, PhD, Instituto Nacional de Salud Publica (INSP), Mexico; Ana Baylin, MD, DrPH, University of Michigan, USA; Wulf Becker, PhD, professor, National Food Agency, Sweden; Dr Peter Bjerregaard, MD, Medical Science, National Institute of Public Health, University of Southern Denmark, Denmark; Lesley T Bourne, PhD, Environment and Health Research Unit, Medical Research Council, South Africa; Neville Calleja, MD MFPH, Department of Health Information and Research, Malta; Mario V Capanzana, PhD, Food and Nutrition Research Institute, Philippines; Katia Castetbon, PhD, Institut de veille sanitaire, France; Hsing-Yi Chang, DrPH, National Health Research Institutes, Taiwan; Yu Chen, PhD, New York University School of Medicine, USA; Melanie J Cowan, MPH, WHO, Switzerland; Professor Stefaan De Henauw, MD, PhD, Ghent University, Department of Public Health, Belgium; Eric L Ding, ScD, Harvard Medical School and Harvard School of Public Health, USA; Charmaine A Duante, MSc, Food and Nutrition Research Institute-Department of Science and Technology, Philippines; Pablo Duran, PhD, Dirección Nacional de Maternidad e Infancia, Ministerio de Salud de la Nación, Argentina; Professor Ibrahim Elmadfa, Institute of Nutritional Sciences, University of Vienna, Austria; Heléne Enghardt Barbieri; Farshad Farzadfar, MD, DSc, Tehran University of Medical Sciences, Iran; Dulitha N Fernando, PhD, Faculty of Medicine, University of Colombo, Sri Lanka; Aida Filipovic Hadziomeragic, MD, MSc, Institute of Public Health of Federation of Bosnia and Herzegovina, Bosnia and Herzegovina; Regina M Fisberg, PhD, Faculty of Public Health—University of São Paulo, Brazil; Simon Forsyth; Didier Garriguet, Msc, Statistics Canada, Canada; Jean-Michel Gaspoz, MD, MPH, Geneva University Hospitals and Faculty of Medicine of Geneva, Switzerland, Switzerland; Dorothy Gauci, Post Graduate Diploma (Epidemiology), Department of Health Information and Research, Malta; Brahmam NV Ginnela, MB, BS, DPH, Scientist, at National Institute of Nutrition, Indian Council of Medical Research, India; Idris Guessous, MD, Geneva University Hospitals, Switzerland; Martin C Gulliford, FFPH, King’s College London, UK; Wilbur Hadden, Christian Haerpfer, PhD, University of Aberdeen, UK; Daniel J Hoffman, PhS, Rutgers, the State University of New Jersey, USA; Anahita Houshiar-rad, MSC, National Nutrition and Food Technology Research Institute Shahid Beheshti University of Medical Sciences Tehran, Iran, IRIran; Inge Huybrechts, PhD, Ghent University, Department of Public Health, Belgium; Nahla C Hwalla, PhD, American University of Beirut, Lebanon; Hajah Masni Ibrahim, Master, Ministry of Health, Brunei; Manami Inoue, MD, PhD, Epidemiology and Prevention Division, Research Center for Cancer Prevention and Screening, National Cancer Center, Japan; Maria D Jackson, PhD, University of the West Indies, Jamaica; Lars Johansson, PhD, Norwegian Directorate of Health, Norway; Lital Keinan-Boker, MD, PhD, Ministry of Health, Israel; Cho-il Kim, PhD, Korea Health Industry Development Institute, Republic of Korea; Assistance Professor Eda Koksal, PhD, Gazi University, Turkey; Hae-Jeung Lee; Yanping Li, PhD, Harvard School of Public Health, USA; Nur Indrawaty Lipoeto, PhD, Andalas University, Indonesia; Guansheng Ma, PhD, National Institute for Nutrition and Food Safety, Chinese Center for Disease Control and Prevention, China; Guadalupe L Mangialavori, MS RD, Ministerio de Salud de la Nación (National Health Ministry), Argentina; Yasuhiro Matsumura, PhD, Bunkyo University, Japan; Stephen T. McGarvey, PhD, Brown University, USA; Chan Mei Fen; Gert BM Mensink, PhD, Robert Koch Institute, Germany; Rafael A Monge-Rojas, PhD, Costa Rican Institute for Research and Education and Nutrition and Health (INCIENSA), Costa Rica; Abdulrahman Obaid. Musaiger, PhD, Arab Center for Nutrition, Bahrain; Balakrishna Nagalla, PhD, Scientist at National Institute of Nuyrition, India, Hyderabad; Androniki Naska, PhD, Department of Hygiene, Epidemiology and Medical Statistics, University of Athens Medical School, Greece; Marga C Ocke, PhD, National Institute for Public Health and the Environment, the Netherlands; Maciej Oltarzewski, MSc, National Food and Nutrition Institute, Poland; Philippos Orfanos, MSc, Department of Hygiene, Epidemiology and Medical Statistics, University of Athens Medical School, Greece; Marja-Leena Ovaskainen, PhD, National Institute for Health and Welfare, Finland; Wen-Harn Pan, PhD, Division of Preventive Medicine and Health Services Research, Institute of Population Health Sciences, National Health Reserch Institutes, Taiwan; Demosthenes B Panagiotakos, PhD, Harokopio University, Greece; Gulden Ayla Pekcan, PhD, Hacettepe University Department of Nutrition and Dietetics, Turkey; Stefka Petrova, MD, PhD, National Center of Public Health and Analyses, Bulgaria; Noppawan Piaseu, PhD, Mahidol University, Thailand; Christos Pitsavos, MD, Athens University Medical School, Greece; Luz Gladys. Posada, RD, Master of science, Universidad de Antioquia, Colombia; Leanne M Riley, MSc, WHO, Switzerland; Luz Maria Sánchez-Romero, MD, MSc, National Institute of Public Health, Mexico; Rusidah BT Selamat, MSc, Nutrition Division, Ministry of Health Malaysia, Putrajaya, Malaysia; Sangita Sharma; Abla Mehio Sibai, PhD, American University of Beirut—Faculty of Health Sciences, Lebanon; Rosely Sichieri, MD, PhD, State University of Rio de Janeiro, Brazil; Chansimaly Simmala, MD, Institut of Tropical Medecin, Laos; Laufey Steingrimsdottir, PhD, Professor, Iceland; Gillian Swan; Elz˙bieta Halina. Sygnowska, MSc, PhD, National Institute of Cardiology, Poland; Lucjan Szponar, MD, PhD, National Food and Nutrition Institute, Poland; Heli Tapanainen, MSc, National Institute for Health and Welfare, Finland; Robert Templeton; Anastasia Thanopoulou, MD, PhD, Diabetes Center, 2nd Department of Internal Medicine, National University of Athens, Hippokration General Hospital, Greece; Holmfridur Thorgeirsdóttir, MSc, Directorate of Health, Iceland; Inga Thorsdottir; Antonia Trichopoulou, MD, Hellenic Health Foundation, Greece; Shoichiro Tsugane, MD, PhD, National Cancer Center, Japan; Aida Turrini, MS, Agricultural Research Council, Research Center on Food and Nutrition, Italy; Sirje Vaask, PhD, Tallinn University of Technology, Estonia; Coline van Oosterhout, National Institute for Public Health and the Environment, The Netherlands; J Lennert Veerman, PhD, The University of Queensland, Australia; Nowak Verena; Anna Waskiewicz, MSc, PhD, Institute of Cardiology, Department of Cardiovascular Diseases Epidemiology, Prevention and Health Promotion, Poland; Sahar Zaghloul, PhD, National Nutrition Institute, Egypt; Gábor Zajkás, MD, National Institute of Food and Nutrition Sciences, Hungary.
-
Contributors ME, JP and DM conceived and designed the study. SF, RM, SK and PS designed and carried out the data collection, extraction and coding. SSL and REE designed and carried out the statistical modelling with the help from all coauthors. JP and DM drafted the paper which was critically reviewed by all other coauthors. JP and DM had full access to all the data, take full responsibility for its integrity and are guarantors for the paper. Contributions of each author: JP, SF and RM participated in study concept and design; data collection; data analysis; interpretation of data; drafting of the manuscript and critical revision of the manuscript for important intellectual content.
-
SK participated in study concept and design; data collection; data analysis; interpretation of data and critical revision of the manuscript for important intellectual content. PS, REE participated in data analysis and interpretation of data. ME and GD participated in study concept and design; interpretation of data and critical revision of the manuscript for important intellectual content.
-
SL participated in data analysis; interpretation of data and critical revision of the manuscript for important intellectual content. DM participated in study concept and design; data collection; interpretation of data; drafting of the manuscript; critical revision of the manuscript for important intellectual content and obtaining funding.
-
Funding The study was conducted as part of the Global Burden of Diseases 2010 study and partly funded by the Bill and Melinda Gates Foundation. ME was supported by MRC Grant MR/K005901/1.
-
Competing interests DM has received modest ad hoc travel reimbursement and honoraria for one-time scientific presentations on diet and cardiometabolic diseases from Bunge, Pollock Institute, Quaker Oats, Life Sciences Research Organization, and Nutrition Impact; and royalties from UpToDate, for an online chapter on fish oil. Consultant/Advisory Board and modest ad hoc consulting fees from Foodminds and McKinsey Health Systems Institute, advisory board, Unilever North America Scientific Advisory Board.
-
Provenance and peer review Not commissioned; internally peer reviewed.
-
Data sharing statement No additional data are available.