Article Text

Abstract
Background Few studies have explored behavioural and financial impacts of retail initiatives after 2 years to address the unhealthy food environments common in local government sporting settings.
Aims To evaluate the impact of a 2-year local government capacity building intervention in sporting facility food outlets on (1) the healthiness of refrigerated drink choices available and visible to customers, (2) healthiness of refrigerated drinks sold and (3) refrigerated drink revenue.
Methods 52 sporting facilities within 8 local governments from Victoria, Australia, participated in an intervention between March 2018 and February 2020 by limiting ‘red’ (least healthy) drinks to ≤20% of refrigerator display and increasing ‘green’ (healthiest) drinks to ≥50% of display. Mixed models assessed changes in mean percentage of ‘red’, ‘amber’ and ‘green’ drinks displayed over time, compared with baseline.
Facilities provided electronic weekly itemised sales data (December 2015 to February 2020). Weekly volume of ‘red’ or ‘green’ drinks sold as a proportion of total drinks sold, and total refrigerated drinks revenue were compared preimplementation and postimplementation using mixed models (seasonal facilities), and mixed-effect interrupted time series models (non-seasonal facilities).
Results Display of ‘red’ drinks decreased by mean −17.1 percentage points (pp) (95% CI −23.9 to −10.3) and ‘green’ drinks increased 16.1 pp (95% CI 9.30, 22.9) between baseline and 18-month audits.
At nine seasonal facilities, compared with the summer preimplementation, the mean volume of ‘red’ drinks sold decreased by −19.0 pp (95% CI −28.6, to –9.51) and refrigerated drink revenue decreased by−AU$81.8 (95% CI −AU$123 to –AU$40.8) per week. At 15 non-seasonal facilities, by February 2020, the volume of ‘red’ drinks sold decreased on average by −11.0 pp (95% CI −21.6 to –0.41) with no change in drink revenue.
Conclusion Reducing the display of unhealthy drinks can be an effective public health policy to improve the healthiness of customer purchases, provided there is consideration of potential impacts on revenue.
- Dietary patterns
Data availability statement
Implementation data are available on reasonable request. Sales data are not available as they were provided on a commercial-in-confidence basis.
This is an open access article distributed in accordance with the Creative Commons Attribution Non Commercial (CC BY-NC 4.0) license, which permits others to distribute, remix, adapt, build upon this work non-commercially, and license their derivative works on different terms, provided the original work is properly cited, appropriate credit is given, any changes made indicated, and the use is non-commercial. See: http://creativecommons.org/licenses/by-nc/4.0/.
Statistics from Altmetric.com
WHAT IS ALREADY KNOWN ON THIS TOPIC
Limited availability of healthy food and drink options in sporting food environments is a key driver of unhealthy purchases. Increasing healthier options can drive healthier purchasing.
WHAT THIS STUDY ADDS
Healthy changes to facility drink offerings and customer purchasing were sustained after a 2-year local government capacity building intervention. We demonstrate, for the first time, that sales impacts may differ between seasonal and non-seasonal facilities, including in revenue outcomes.
HOW THIS STUDY MIGHT AFFECT RESEARCH, PRACTICE AND/OR POLICY
The study emphasises the value of capacity-building interventions of at least 2 years to promote healthier purchasing, as well as the need to tailor interventions to outlet context, with potentially different expectations and support required for optimal outcomes.
Background
Sport and recreation facilities offer a unique opportunity to promote health through both physical activity and providing a healthy food environment.1 Despite this, food environments in these facilities, including in the USA, Canada, Australia and New Zealand, generally offer and promote nutritionally poor foods that may contribute to excess energy intake.1–3 Parents and children have expressed concern that sport-related food environments do not support healthy eating for children.4
Limited availability of healthy options in sporting food environments has been found to be a key driver of unhealthy food purchases, and increasing healthier options can drive healthier purchasing.1 A scoping review of healthy eating interventions in sporting settings1 reported several interventions of mostly less than 1-year duration which demonstrated improvements in healthiness of retail practices5–8; one showed no effect.9 For example, two Canadian capacity building interventions in sport and recreation facilities or clubs, an 8-month pre–post study8 and the 18-month ‘Eat, Play, Live’ randomised controlled trial (RCT),7 found significant improvements in policy development and changes to the food environment in those facilities provided with support compared with those not provided with support. Neither capacity building intervention reported on changes in food and drink sales. Some previous studies have reported modest improvements in the healthiness of customer purchases,5 6 10–12 while others have showed no impact.1 13
The extent to which an intervention facilitates capacity building may partly explain heterogeneity of retail intervention impact. Longer-term capacity building programmes that increase organisational knowledge, skills and resources and are tailored to the individual challenges of each organisation, have been suggested as facilitating sustained implementation of healthy food retail initiatives in sporting settings.1 Over the longer term, implementation of healthy food retail practices may vary due to factors such as staff turnover and stakeholder buy-in.14 Retailer insights also suggest repeated customer exposure to a retail intervention may result in either magnification or reduction in the effectiveness of an intervention over the longer term.15 To date, we have identified only two published studies that have assessed capacity building healthy retail interventions in sport and recreation facilities for more than 1-year postimplementation,6 7 though neither examined changes in sales or implementation using repeated measures beyond pre–post evaluation. Evaluation of the implementation and longer-term maintenance of interventions, including measurement of changes to customer purchasing and the financial consequences for the retailer, is crucial to support evidence-based policy development and optimal implementation of initiatives.16
Evidence of financial impacts after 2 or more years is needed to address retailer fears of profit loss—a key barrier to retailer adoption of healthy retail changes within sporting14 17–19 and other retail settings.20 A 2019 review of healthy food retail business outcomes,16 as well as more recent publications,5 14 21 found commercial viability outcomes of interventions up to 1 year within sporting settings were either neutral,6 10 13 mixed8 12 14 21 or unfavourable,5 17 18 with no studies finding favourable outcomes to date. We must know if and how both public health and retailer aims can be achieved in the longer term in order to realise permanent healthy retail transitions.
The context in which interventions are implemented is another likely driver of heterogeneity in implementation and sales outcomes observed previously. Seasonal and non-seasonal facilities differ systematically in food and drink offerings and customer characteristics. It is unclear whether customer and staff responses to healthy retail initiatives, and therefore policy learnings, are generalisable between facility types. To date, we are not aware of any evaluations of the impact of large-scale capacity building interventions on the healthiness of items sold in seasonal facilities (those only open a part of the year), or any studies examining the impact of a capacity building intervention on revenue and healthiness of purchases in both seasonal and non-seasonal sporting facilities.
This study advances the previous literature on healthy food retail interventions in sporting settings by reporting behavioural and revenue impacts at 2 years after implementation, and examining responses from seasonal and non-seasonal facilities separately. We aimed to evaluate the impact of a 2-year local government capacity building intervention in Australian sports and recreation facilities on changes over time on (1) the healthiness of prepackaged refrigerated drink choices visible to customers, (2) healthiness of refrigerated drinks sold and (3) refrigerated drink revenue.
Methods
Setting and intervention
This study evaluated an intervention designed and funded by an Australian state-based health promotion agency (the Victorian Health Promotion Foundation (VicHealth)). The ‘Water in Sport’ capacity building intervention aimed to support local government-owned and/or managed sport and recreation facilities (including sporting clubs) to reduce customer purchases of sugar-sweetened beverages and make water the drink of choice. From March 2018 to June 2020, VicHealth funded eight local government areas (LGAs) in Victoria, Australia to each appoint a project officer responsible for implementing the initiative.
The healthiness of drinks available in each participating facility was assessed using the Victorian Government’s Healthy Choices guidelines (HCGs) for sport and recreation facilities.22 The HCGs are voluntary and include classification of food and drinks based on their major ingredients and their energy and nutritional content per serve (and per 100 mL), into ‘green’ (‘best choice’, eg, water), ‘amber’ (‘choose carefully’, eg, diet soft drinks) and ‘red’ (‘limit’, eg, full sugar soft drinks).23 The role of the project officers was to encourage and support all recruited facilities in their LGA to implement ‘nudges’ increasing the display of ‘green’ drinks to at least 50% and either (1) limiting display of ‘red’ drinks to no more than 20% of display space or (2) removing ‘red’ drinks from display altogether. Additional details on the design and implementation of the ‘Water in Sport’ initiative are found in online supplemental appendix 1.
Supplemental material
Study design
The implementation of the ‘Water in Sport’ initiative in facilities, along with its impact on the healthiness of customer purchases and facility financial outcomes was assessed using an observational study design. Figure 1 provides an overview of the project timeline and the study data collection periods, with key evaluation dates shown in table 1.
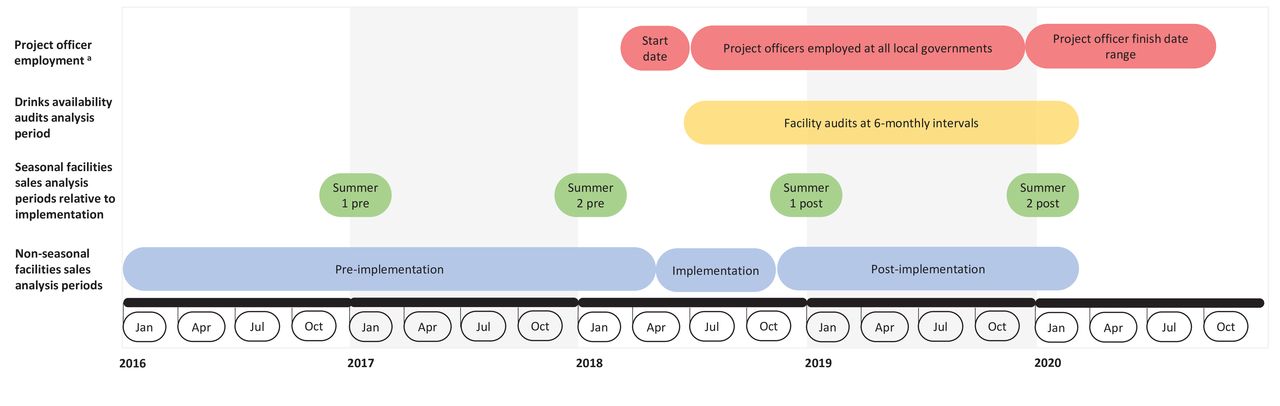
‘Water in Sport’ project implementation and data collection timeline. aProject officer employment start dates ranged between 1 March and 18 June 2018, and employment finish dates ranged between 20 December 2020 and 30 October 2021.
Key dates for evaluation of the ‘Water in Sport’ initiative
Data collection
Effect of initiative on implementation
Evaluation of drink displays was used to assess implementation of the intervention against project targets. An audit of refrigerated prepackaged drinks displays was undertaken by project officers every 6 months by taking photographs of each refrigerator at every participating facility during the implementation and postimplementation period (see audit instructions in online supplemental appendix 2). Details on drinks classification based on refrigerator audit are presented in online supplemental appendix 3.
Effect of initiative on facility sales
Sales data were used to assess impact of intervention on consumer purchases. Facilities provided itemised electronic weekly sales data from November 2015 to March 2020 for all prepackaged drinks (table 1). Data for each drink product line included the unit size (mL), unit price and number of units sold per week. Each product line was assessed using the HCG classification by project officers.
Outcomes
Effect of initiative on implementation
The primary implementation outcome was the mean percentage of ‘red’ drinks displayed across all refrigerators by a facility at each audit; and secondary outcomes were the mean percentages of ‘amber’ and ‘green’ drinks displayed. A secondary binary outcome measured compliance with the HCGs target, with facilities classified as compliant only if all refrigerators within a facility met both HCG targets of no more than 20% ‘red’ drinks and at least 50% ‘green’ drinks on display.
Effect of initiative on facility sales
For each week, the primary sales outcomes were: (1) ‘red’ drinks sold as a percentage of total volume of drinks sold and (2) total refrigerated drink revenue (AU$). Secondary outcomes included: (3) ‘amber’ drinks sold as a percentage of total volume of drinks sold, (4) ‘green’ drinks sold as percentage of total volume of drinks sold, (5) total volume of drinks sold (L), (6) water sold as a percentage of total volume of drinks sold, (7) free sugar content of drinks sold (g/100 mL) and (8) revenue (AU$) from all other drink and food sales.
Analysis
Effect of initiative on implementation
Facilities were excluded from the analysis if less than two valid audits were available and/or if audits were based on menu (number of product lines available) rather than refrigerator display and, therefore, the number of drink facings was unable to be determined.
Mixed models (or multilevel models)24 25 were used to estimate the change in the display of drinks during the project officer employment period, with facility as the clustering factor to account for repeated outcomes within each facility. Linear mixed models were used for percentage drink display outcomes and logistic mixed models for compliance with HCG target outcomes. We estimated the effect of intervention implementation at 6, 12 and 18 months relative to the baseline audit, unadjusted and then adjusted for: food outlet type, season and seasonality of facility opening (see table 2). We estimated marginal means and probabilities from the adjusted models at the mean values of the covariates included in the model.
Covariates for analyses
We performed a simple count of the number of facilities who increased the raw percentage of ‘red’ drinks on display and/or increased percentage of ‘green’ drinks on display between baseline and 18-month audits.
Effect of initiative on facility sales
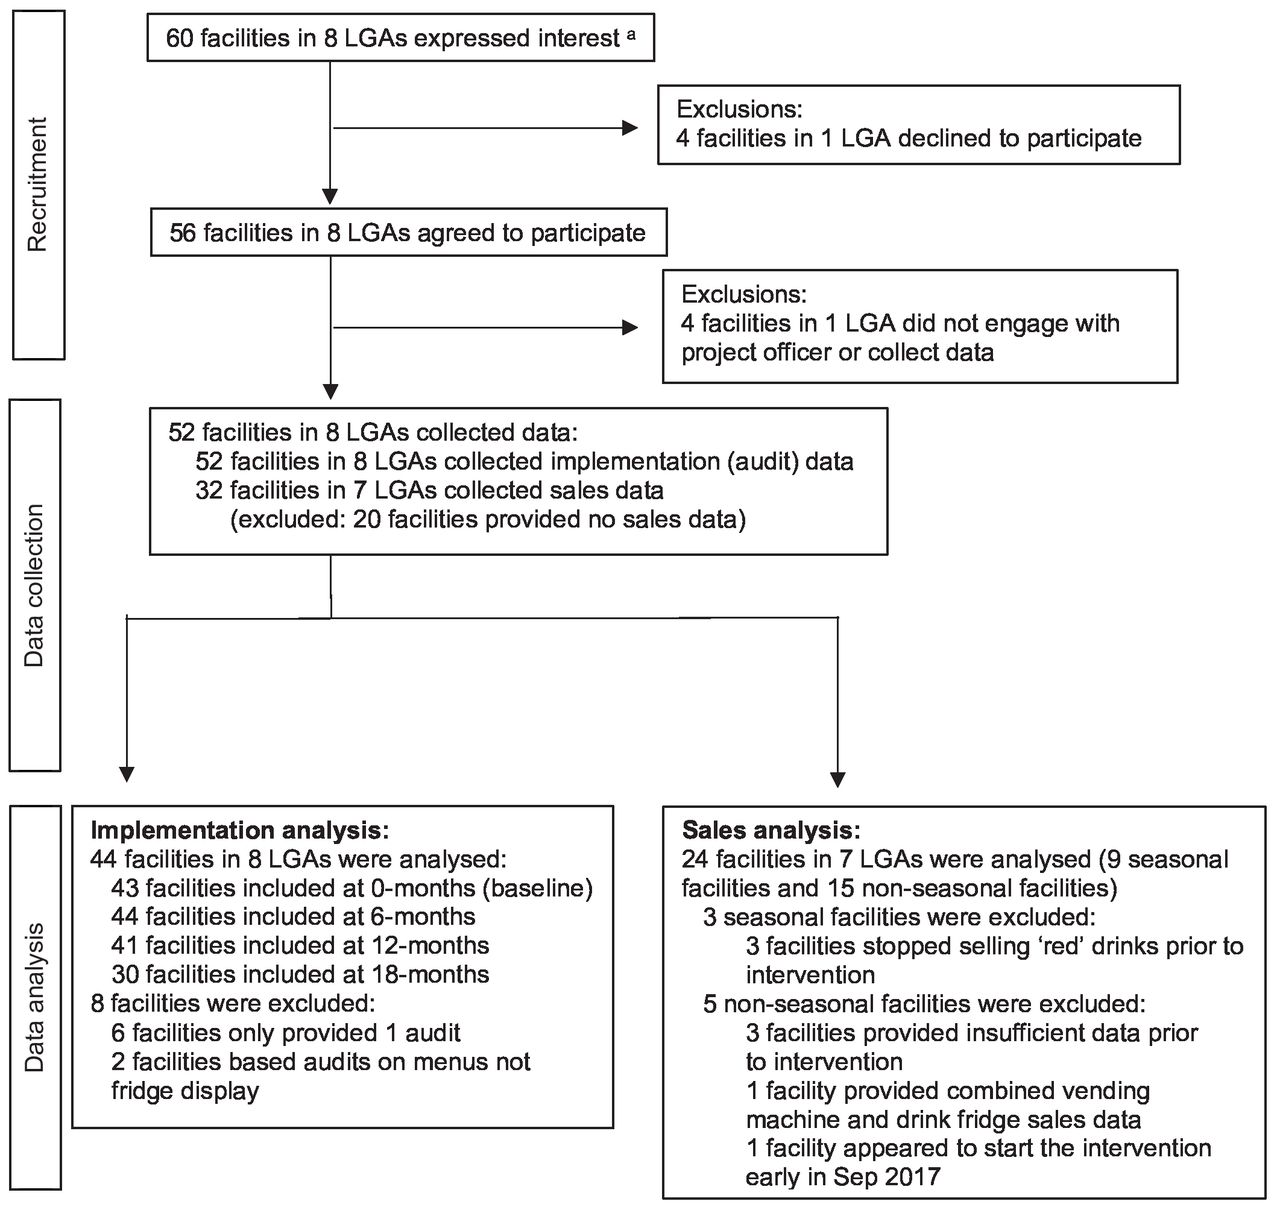
Facilities were excluded from the sales data analysis if they did not sell any ‘red’ drinks prior to the start of intervention implementation or did not provide data required (figure 2).

Flow diagram of facilities in the ‘Water in Sport’ evaluation. aNumber of facilities that expressed an interest to participate in the intervention and were included in the initial application for funding to VicHealth by local governments. LGA, local government area.
Seasonal facilities
See figure 1 and table 1 for date ranges for the four summer seasons used in analysis of seasonal facilities (which included sporting clubs and outdoor pools that were only open over summer months, December to February). For each sales outcome, a mixed linear model24 was fitted with facility as a random effect, and summer season (included as a four-level categorical variable) and covariates used for adjustment as fixed effects. As there were breaks in the sequential measures of the sales outcomes, we were not able to model time trends over the entire study period, instead we compared mean changes in sales between summer seasons. Sales in the summer immediately before the start of the initiative (summer 2 preimplementation, reference category) were compared with the sales in the other three seasons (summer 1 preimplementation; summer 1 postimplementation; summer 2 postimplementation). Model effects were estimated adjusting for mean maximum weekly temperature. For the percentage outcomes (volume of ‘red’, ‘amber’ and ‘green’ drinks, water and free sugar content sold), we additionally adjusted for facility size (table 2). Marginal means for each summer season were estimated from the adjusted models at the mean values of the covariates.
Non-seasonal facilities
For non-seasonal facilities, the effect of the intervention was assessed using interrupted time series analysis (ITSA),26 an approach widely used to estimate the effect of interventions in observational studies, allowing for shifts in outcome at specific time points and changes over time. For each outcome, a mixed ITSA model was fitted with facility as a random effect and autocorrelation over time (time lag of 3 weeks assumed). Fixed effects were included in the model as (1) two break points (at the start and end of the implementation period, see figure 1 and table 1) to allow for a change in mean sales at these times, (2) time trends preimplementation, during implementation and postimplementation that were assumed linear and independent and (3) covariates used for adjustment (see online supplemental appendix 4 for further model specification details). The model was used to estimate the difference between the observed outcome under the intervention and the counterfactual outcome (the expected outcome that would have been observed if the initiative had not been implemented) for the week beginning 3 February 2020. For all outcomes, model effects were estimated adjusted for calendar month and mean maximum daily temperature for each week (see table 2). Models for revenue outcomes and total volume of drinks sold were additionally adjusted for outlet type.
All analyses were conducted under an intention to treat approach. All analyses were performed in Stata V.16.1.
Results
Implementation of the ‘Water in Sport’ initiative
Of the 60 facilities in the 8 LGAs that received funding, 52 (87%) collected implementation data, and of these 44 facilities (85%) provided at least 2 valid audits and were included in the analysis (see figure 2). The eight excluded facilities did not differ to those included in the implementation analysis in terms of type of food retail outlet or area level socioeconomic position (online supplemental table S1). Of the 44 facilities included in the analysis, 14 (32%) were kiosks, 24 (55%) canteens and 6 (14%) cafés; 35 (80%) were in areas with higher disadvantage; and 26 (59%) were non-seasonal.
After adjustment, we found that the mean percentage of ‘red’ drinks available significantly decreased at each postintervention audit compared with the baseline audit, ‘green’ increased and ‘amber’ remained the same (table 3, figure 3).

Percentage a of refrigerated drinks on display by traffic light classification over timeb, in 44 facilities. a Marginal means and 95% CI estimated from multilevel models adjusted for season, seasonality of facility and outlet type. bHealthy Choices guidelines target were to display no more than 20% ‘red’ drinks (eg, sugary soft drinks), at least 50% ‘green’ drinks (eg, sparkling waters) and the remainder ‘amber’ drinks (eg, diet soft drinks).
Percentage of refrigerated drinks on display, by traffic light classification at each audit time point, in 44 facilities
At the baseline audit, 20.5% (95% CI 7.07% to 33.9%) of facilities met the HCG targets of no more than 20% ‘red’ drinks displayed and at least 50% ‘green’ drinks displayed in all refrigerators. At the 18-month audit, 63.8% (95% CI 41.9% to 85.8%) of facilities met the HCG targets (online supplemental table S2). The odds of compliance increased at each successive audit from 0 to 18 months. In all but one case, facilities who did not already meet the HCG targets at the baseline audit decreased the raw percentage of ‘red’ drinks on display and/or increased the percentage of ‘green’ drinks on display between baseline and 18-month audits.
Effect of the ‘Water in Sport’ initiative on healthiness of customer purchases and facility-level packaged drinks revenue
Of the 52 facilities that participated in the initiative, 32 (62%) collected sales data, and of these, 9 seasonal and 15 non-seasonal facilities (75%) were included in the analysis (see figure 2). The facilities that participated in the initiative but were not included in the sales analysis were more likely to be from areas of higher socioeconomic disadvantage than those included (see online supplemental table 3 and box 1).
Seasonal facilities
In the adjusted model, there was no change in the mean percentage of ‘red’ drinks sold between summer 1 preimplementation and summer 2 preimplementation in seasonal facilities (figure 4; online supplemental table 4). Compared with summer 2 preimplementation, there was a reduction in mean percentage of ‘red’ drinks sold in summer 1 postimplementation (−18.2 percentage points (pp); 95% CI −27.8 to −8.67) and summer 2 postimplementation (−19.0% pp; 95% CI −28.6 to –9.51). For weekly revenue from refrigerated drinks, there was only evidence of a statistically significant reduction for summer 2 postimplementation compared with summer 2 preimplementation (−AU$81.8; 95% CI −AU$123 to –AU$40.8), equivalent to −25.2% (95% CI −32.6% to −17.7%). We found no difference in the change in ‘red’ drink sales or revenue between the two summers postimplementation.
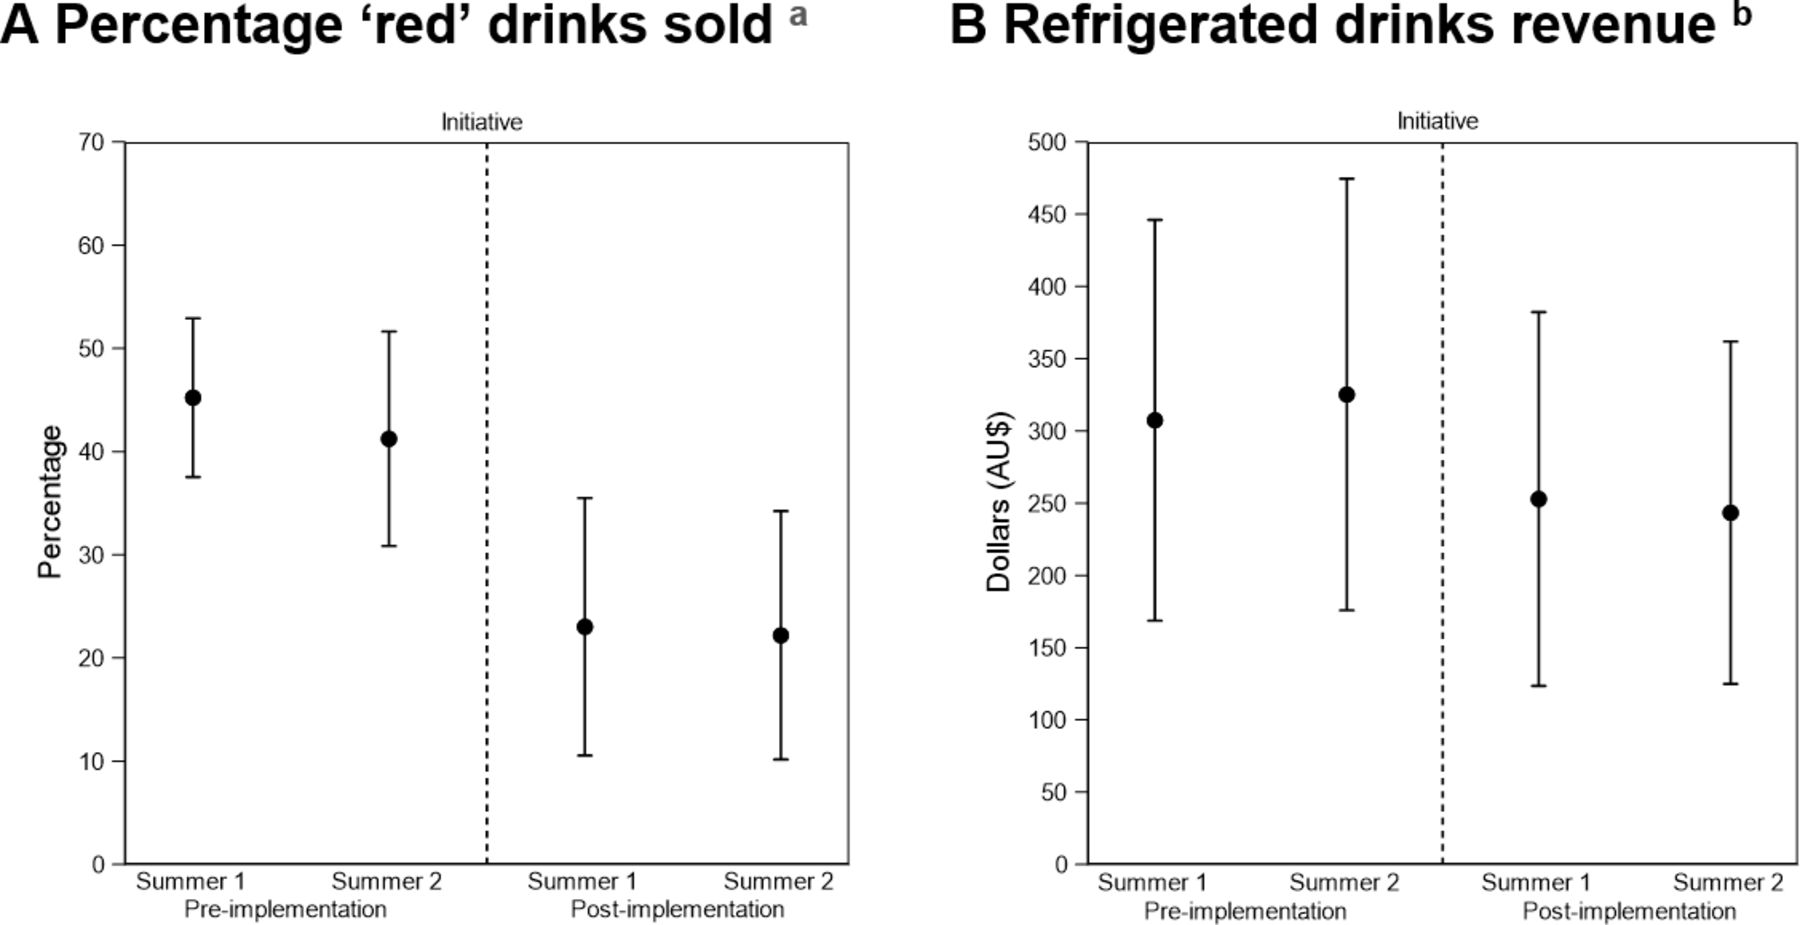
Weekly sales of ‘red’ drinks and drinks revenue, by summer season, in nine seasonal facilities. aMarginal means and 95% CI estimated from multilevel model adjusted for calendar month, maximum weekly temperature. bMarginal means and 95% CI estimated from multilevel models adjusted for calendar month, maximum weekly temperature, size of facility.
We found no difference in sales for any of the secondary outcomes summer 1 preimplementation versus summer 2 preimplementation, or summer 1 postimplementation versus summer 2 postimplementation (online supplemental table 4). We saw an increase in mean percentage sales of ‘amber’ drinks in summer 1 postimplementation (7.45 pp; 95% CI 0.20 to 14.7) and summer 2 postimplementation (13.3 pp; 95% CI 2.66 to 23.9) compared with summer 2 preimplementation. The mean percentage sales of ‘green’ drinks sold increased in summer 1 postimplementation (10.6 pp; 95% CI 0.10 to 21.2), compared with summer 2 preimplementation. No significant changes were found in revenue from other drinks and food, free sugar content of drinks sold, volume of water sold or overall volume of drinks sold in summer 1 postimplementation or summer 2 postimplementation, compared with summer 2 preimplementation (online supplemental table 4).
Non-seasonal facilities
In non-seasonal facilities, there were significant time trends with the percentage volume of ‘red’ drinks sold reducing over time in each phase of the study (preimplementation, during implementation and postimplementation; see table 4, first block of estimates; figure 5). When we compared to see if the sales time trends were the same in each period of the study (table 4, second block), we found that the reduction per week in sales of ‘red’ drinks during the implementation period (−0.41 pp; 95% CI −0.68 to –0.14) was significantly greater than in the preimplementation period (−0.06 pp; 95% CI −0.11 to –0.02) and the postimplementation period (−0.10 pp; 95% CI −0.19 to −0.02). There was no statistical difference between the preimplementation and postimplementation time trends. There was no immediate shift in the percentage of ‘red’ drinks sold at the start of the implementation period or the end the implementation period (table 4, third block), suggesting that changes occurred gradually over time. The estimated effect of the intervention by February 2020, was −11.0 pp in ‘red’ drinks (95% CI -21.6 to –0.41) sold per week.

Weekly sales of percentage of ‘red’ drinks sold a with sales time trend, in 15 non-seasonal facilities. a Predicted values and sales trend using weekly data, estimated at mean values of the covariates from models adjusted for calendar month and maximum weekly temperature. Study periods: Preimplementation (4 January 2016 to 4 March 2018; Implementation (5 March 2018 to 30 September 2018); Postimplementation (1 October 2018 to 24 February 2020).
Weekly sales of primary and secondary outcomes,* in 15 non-seasonal facilities (continued)
For refrigerated drinks revenue, there was no evidence of a sales time trend either preimplementation or during initiative implementation. There was some evidence of a time trend postimplementation of −AU$1.32 per week (95% CI −AU$2.62 to –AU$0.02), however it did not differ significantly to the time trends preintervention and during intervention. There was no evidence of a change in revenue for refrigerated drinks in February 2020 compared with expected sales.
For the secondary outcomes, the estimated outcome differed from the counterfactual outcome by February 2020 only for free sugar content sold (−0.78 g/100 mL; 95% CI −1.55 to –0.001).
Discussion
The evaluation of the ‘Water in Sport’ initiative, the longest follow-up of an intervention to promote healthy eating in both seasonal and non-seasonal sporting facilites to date, demonstrates that a capacity building approach is an effective way of supporting healthy retail change over 2 years. In a 2-year intervention, the healthiness of drink choices visible to customers and the healthiness of drinks sold in sports and recreation facilities both improved, with only small reductions in total refrigerated drink revenue (and only in seasonal facilities).
We demonstrated a large decline in display of the least healthy (‘red’) drinks, and a larger increase in the healthiest (‘green’) drink display over time than has been shown in other large RCTs over longer than 1 year in sporting facilities to date,6 7 with percentage display of ‘red’ drinks nearly halving over 18 months. However, it is worth noting that even by the end of the intervention, only 63% of facilities were compliant with the HCG target. Improved implementation in the current study may be related to the intensiveness and capacity building nature of the intervention. Although it is in theory possible that the changes observed could be due to overall trends toward healthier food environments over time, this is highly unlikely given the lack of change in sales observed between the first and second years preimplementation or the first and second year postimplementation in seasonal facilities, and our time series analysis adjusting for preintervention trends in non-seasonal facilities.
Following the implementation of the ‘Water in Sport’ initiative, percentage sales volume of ‘red’ drinks decreased in both seasonal and non-seasonal facilities. A recent pre–post evaluation of a sugary drink reduction policy in 16 Victorian YMCA sport and recreation facilities reported that volume sales of ‘red’ drinks decreased by 46.2% 1 year after implementation in non-seasonal facilities,5 a larger reduction in targeted products than was seen using similar interventions in smaller studies.1 The relatively smaller change in sales of ‘red’ drinks in ‘Water in Sport’ facilities may be because the priority to promote healthy drink purchasing was already high in the included local governments prior to the implementation of the project, and because of the more modest policy target to reduce ‘red’ drink display to no more than 20% of available drinks, rather than eliminate ‘red’ drinks sales altogether.
We found differences in preinitiative sales patterns and observed greater reductions in sales of ‘red’ drinks and revenue in seasonal compared with non-seasonal facilities. We are not aware of any previous studies explicitly comparing the response of seasonal and non-seasonal facilities. Differences in sales patterns between seasonal and non-seasonal facilities may reflect underlying differences in facility offerings, type of facility customers, food outlet turnover, the influence of weather events such as bushfires or heatwaves, and systematic variations in customer and staff response to the initiative. The mixed effects on revenue (in seasonal and non-seasonal facilities) align with a previous review of business outcomes of healthy food retail initiatives which found mixed financial impact across settings.16
The revenue loss observed in seasonal facilities was low in absolute terms (mean −AU$81.80 per facility per week) but equivalent to an approximate 25% decrease. While previous evidence suggests that food retail may be viewed as an auxiliary source of revenue by sporting facilities,14 relatively small losses could be critical for seasonal (often smaller) facilities. As well as the public health impact, evidence for the cost of implementation per facility is needed to assess the value of the intervention to the local government, retailers and broader communities.27
On average, facilities that achieved the HCG targets did so after 12 months, with ‘red’, ‘amber’ and ‘green’ drinks displayed being approximately the same at both 12 months and 18 months after the first audit. Similarly, changes in sales were greatest in both seasonal and non-seasonal facilities during the first year after the intervention. We are aware of only two other capacity building studies of longer than 2 years in sport and recreation settings.5 6 Multifaceted and sustained term capacity building interventions may increase effectiveness of food environment change1 by increasing stakeholder commitment to change and embedding policies to encourage maintenance.14 Trials of more than 2 years will be important to investigate if and how favourable changes in purchasing can be maintained in the longer term.
Purchases in ‘Water in Sport’ intervention facilities are likely to only form a small part of the total diet, however aligning the messaging of sports and nutrition may strengthen healthy eating messages for individual customers.4 Our findings are likely generalisable to capacity building interventions of a similar intensity in sport and recreation facilities. Common barriers and enablers have been found across countries in food retail interventions,1 and retail interventions often have similar barriers and enablers across setting type.28
Strengths and limitations
The evaluation of the ‘Water in Sport’ initiative included rigorous multilevel analysis of objective drink display and sales data. The comprehensive evaluation and follow-up 18 months after implementation provides evidence of the longer-term implications of capacity building interventions in local government sporting settings on changes to facility practice, health behaviour impacts and financial outcomes for facilities.
Our sales data analysis approach aimed to control for the temporal trend before implementation but includes the assumption that this trend would remain the same after 2 years; the validity of this assumption cannot be assessed in natural experiments without a comparable control group. For the seasonal facilities data, as only short data sales periods were available each year, we could not estimate time trends and therefore intervention effects might be biased due to temporal changes independent of the intervention. We adjusted for facility characteristics including facility size, however, we did not investigate if intervention effects differed by facility characteristics. Larger RCTs would be needed to overcome these limitations and to isolate the effect of the intervention from external campaigns, funding and industry and consumer trends.
We found no change in the overall volume of refrigerated drinks sold, or in revenue from food and non-refrigerated drinks, before and after the initiative. However, without detailed food purchasing data or direct measures of consumer consumption we cannot account for substitution effects in purchases between food and drinks, or between intervention facilities and external facilities.
This study did not capture changes in nutritional content of specific drink products over time, as drink HCG classifications and free sugar content were each collected at a single time point. HCG classifications are likely to be minimally affected by reformulation as ‘red’, ‘amber’ and ‘green’ classifications relate mainly to the type of drink (eg, sugar-sweetened beverage, fruit juice) and portion size. The absolute free sugar content of drinks purchased preintervention was low as it comprised all drinks including water (eg, mean 2.87 g/100 mL (95% CI 2.23 to 3.50) in the week before the intervention began). This low mean sugar content created a difficulty in detecting changes in free sugar content of purchases, and means that results would have been minimally affected by modest industry sugar reformulation efforts over the study period.29
Conclusion
The evaluation of the ‘Water in Sport’ initiative demonstrated that a 2-year local government capacity building intervention created healthier drink environments in almost all participating facilities, and resulted in reduced purchases of targeted unhealthy drinks by sport and recreation patrons. The different findings observed between seasonal and non-seasonal facilities, including in revenue outcomes, emphasises the need to tailor interventions to outlet context, with potentially different expectations and support required for desirable outcomes. Follow-up studies longer than 2 years will be important to investigate if and how favourable changes in food environment and purchasing can be maintained permanently.
Data availability statement
Implementation data are available on reasonable request. Sales data are not available as they were provided on a commercial-in-confidence basis.
Ethics statements
Patient consent for publication
Ethics approval
Implementation audit and sales data collection were approved as part of the ‘Water in Sport’ project evaluation by Deakin University Faculty of Health Human Ethics Advisory Group (reference HEAG-H 35_2018). No consent was required for the collection of non-human data described in this manuscript.
References
Supplementary materials
Supplementary Data
This web only file has been produced by the BMJ Publishing Group from an electronic file supplied by the author(s) and has not been edited for content.
Footnotes
Twitter @MirandaRBlake, @devriesenberg, @taraboelsenr, @ay_jay_cee, @annapeetersaus
Contributors AP, TB-R, AJC and MRB conceived of the study. AP, MRB, DR and AJC designed the study. DR coordinated data acquisition and analysis. HR and LO analysed and interpreted the sales data. DR and MRB analysed and interpreted the implementation data. MRB wrote the manuscript with assistance from DR and HR. AP is guarantor of the study. All authors read and approved the final manuscript.
Funding This project was funded by the Victorian Health Promotion foundation (VicHealth) ‘Water in Sport’ project, including salary support for DR. MRB, AJC, AP, LO, DR, and TB-R are researchers within the National Health and Medical Research Council (NHMRC) funded Centre of Research Excellence in Food Retail Environments for Health (RE-FRESH) (APP1152968). The opinions, analysis, and conclusions in this paper are those of the authors and should not be attributed to the NHMRC or VicHealth. MRB is funded by a post-doctoral fellowship from the Deakin University Institute for Health Transformation. TB-R is supported by a Deakin University Executive Dean’s Fellowship. AP is supported by an NHMRC Investigator Grant. AJC is support by a National Heart Foundation Future Leader Fellowship.
Competing interests No, there are no competing interests.
Provenance and peer review Not commissioned; externally peer reviewed by Penny Breeze, United Kingdom of Great Britain and Northern Ireland.
Supplemental material This content has been supplied by the author(s). It has not been vetted by BMJ Publishing Group Limited (BMJ) and may not have been peer-reviewed. Any opinions or recommendations discussed are solely those of the author(s) and are not endorsed by BMJ. BMJ disclaims all liability and responsibility arising from any reliance placed on the content. Where the content includes any translated material, BMJ does not warrant the accuracy and reliability of the translations (including but not limited to local regulations, clinical guidelines, terminology, drug names and drug dosages), and is not responsible for any error and/or omissions arising from translation and adaptation or otherwise.