Article Text

Abstract
Background Active screening of only pregnant and lactating mothers (PLMs) excludes other mothers of reproductive age susceptible to undernutrition. Our analysis evaluated if mothers presenting with wasted children were more likely to be undernourished themselves.
Methods The observational study enrolled mother and child dyads presenting to an outpatient facility in Mogadishu, Somalia, between November 2019 and March 2020. Trained nurses recorded lower extremity oedema for children aged 6–59 months, parity and gestational status for women aged 19–50 years and age, access to care, height/length, mid-upper arm circumference (MUAC) and weight for both. Weight-for-height z-score (WHZ) for children and body mass index (BMI) for mothers were calculated using standard procedures. Wasting was defined as WHZ <−2, MUAC <12.5 cm and/or presence of oedema for children. Undernutrition was defined as MUAC <23 cm for PLMs and BMI <18.5 kg/m2 for neither pregnant nor lactating mothers (non-PLMs). Four multivariable linear regression models were fit to evaluate maternal anthropometric indicators (BMI or MUAC) given child anthropometric indicators (MUAC or WHZ), adjusting for maternal age, parity and gestational status.
Results A total of 93.6% (2142/2288) of enrolled dyads met inclusion criteria. Wasting was observed among 57.5% of children; 20.2% of pregnant mothers, 20.0% of lactating mothers and 7.95% of non-PLMs were undernourished. Models suggest significant, positive associations between child and maternal anthropometrics; a one-unit increase in WHZ and a 1 cm increase in child MUAC were associated with 0.22 kg/m2 (95% CI 0.22 to 0.24) and 0.19 kg/m2 (95% CI 0.16 to 0.21) increases in maternal BMI, respectively, and 0.20 cm (95% CI 0.18 to 0.22) and 0.24 cm (95% CI 0.23 to 0.25) increases in maternal MUAC, respectively. Adjusted R2 values were low (range 0.06–0.10).
Conclusions Undernutrition among non-PLMs illustrates the importance of expanding screening. However, while significant, the strength of association between mother and child anthropometrics does not support child nutritional status as a screening tool for identifying at-risk mothers.
- malnutrition
- nutrition assessment
Data availability statement
Data are available upon reasonable request. The anonymized datasets used and analyzed during the study are available by email request from Mashaka Lewela at mashaka.lewela@savethechildren.org.
This is an open access article distributed in accordance with the Creative Commons Attribution Non Commercial (CC BY-NC 4.0) license, which permits others to distribute, remix, adapt, build upon this work non-commercially, and license their derivative works on different terms, provided the original work is properly cited, appropriate credit is given, any changes made indicated, and the use is non-commercial. See: http://creativecommons.org/licenses/by-nc/4.0/.
Statistics from Altmetric.com
What this paper adds
The presented study evaluated nutritional status of mothers-child pairs presenting to health facilities in Somalia to identify factors associated with maternal malnutrition that could be used to prioritise triage and screening activities.
We found a significant, but weak correlation between child and mother nutritional status, adjusting for maternal age, parity and gestational status. These data suggest that child nutritional status is not an ideal screening tool to identify mothers at risk for malnutrition.
Given the large number of identified malnourished women who were neither pregnant nor breastfeeding, there remains a need for expanded nutritional screening programs beyond pregnant and lactating women, the current focus in humanitarian contexts.
Introduction
Public health programmes in humanitarian settings aimed at identifying at-risk individuals before they develop severe undernutrition have traditionally focused on screening children less than 5 years old and pregnant and lactating mothers (PLMs) given the higher prevalence of undernutrition and risk of mortality in these groups.1–3 Screening of other demographic groups, such as neither pregnant nor lactating mothers (non-PLMs), is not common, despite a risk of developing undernutrition, particularly in settings of famine, food insecurity or disease outbreaks. This is due, at least in part, to the fact that undernutrition is less prevalent in other groups compared with children less than 5 years old and PLMs, shifting the cost-benefit analysis away from universal screening.4 Targeted screening in which mothers with wasted children, a subset of all women of reproductive age, are evaluated has been proposed as an alternative where universal screening is not feasible. The association between a woman’s nutritional status and that of her child has been documented in early childhood development and in utero. Pooled data from cross-sectional studies of 35 low and middle-income countries as well as a study of several thousand children–mother pairs in India have shown undernourished mothers (as measured by maternal height or body mass index (BMI)) to be associated with the presence of wasting, undernutrition and stunting for her child.5 6 Undernutrition among pregnant women has been shown to increase the rate of adverse birth outcomes including intrauterine growth restriction and low birth weight.7
We leveraged the known association of maternal nutrition on child nutrition to investigate whether mothers presenting to health facilities with wasted children were more likely to be undernourished, and whether the strength of that association would be strong enough to justify a targeted screening of mothers with wasted children. We proposed an observational assessment of the association between child and maternal nutritional status among a facility-based sample in Somalia. Somalia was selected because undernutrition among adult women is a public health concern; and the country has experienced prolonged humanitarian emergencies resulting in critical levels of wasting.8
Methods
Data collection
The study was conducted at an outpatient health and nutrition facility operated by the international charity Save the Children that serves internally displaced persons (IDPs) and host communities in Mogadishu, Somalia.
Patients were screened for eligibility by facility triage nurses between 1 November 2019 and 31 March 2020. A woman and the child she brought to the facility (‘dyads’) were eligible for enrolment if the child was 6–59 months old, the child had not previously presented for the same condition within the study period, the child presented to the facility with their biological mother (self-reported) and neither the child nor the mother had previously been enrolled in the study. If a mother presented with multiple children, the child with a lower weight-for-height z-score (WHZ) was selected.
Triage nurses obtained oral informed consent from eligible mothers. For enrolled dyads, height, weight and mid-upper arm circumference (MUAC) were collected for mothers and children by trained facility nurses following standard anthropometric procedures.9 Mothers were weighed fully clothed. In addition, demographic indicators and access to care were recorded, including: age (in months for children and years for mothers), child sex, whether the child received therapeutic foods or supplementary feeding, pregnancy and lactation status, parity and mother attendance to at least one antenatal care visit if she was pregnant or lactating. Data were collected on paper clinic register books, entered into an Excel spreadsheet and deidentified prior to data analysis.
Data analysis
Among dyads presenting to the facility during the enrolment period, dyads were excluded if the mother or child fell outside the age range (19–50 years old for mothers, 6–59 months for children), age or mother gestational status was missing and if parity was implausible (greater than 9 for mothers aged 19–24.9 years and greater than 15 for mothers aged 25 years or older). WHZ was calculated using ENA for SMART software, and BMI was calculated in Excel by dividing the weight in kilograms (kg) by the height of the woman in metres squared (m2).10 Among dyads retained for analysis, mothers and children missing anthropometric measurements were excluded by indicator if missing or outside of accepted ranges. Child MUAC and WHZ were excluded if outside WHO recommendations and mother MUAC and BMI were excluded based on the observed data distributions to exclude variables in the 1st or 99th percentile (WHZ: −5 to 5; BMI: 9–50 kg/m2; mother MUAC: 12–36 cm).11
Mothers were categorised into one of three mutually exclusive gestational statuses (pregnant, lactating or non-PLM). Pregnant women self-reported as pregnant. Lactating women self-reported as non-pregnant and breast feeding an infant <6 months old. Non-PLMs self-reported as not pregnant and not breast feeding or breast feeding a child ≥6 months old.12
Nutritional cut-offs for mothers were defined for each gestational status. Among non-PLMs, nutritional status was classified by BMI into four categories: severe thinness (BMI <16 kg/m2), mild or moderate thinness (BMI 16–18.4 kg/m2), normal weight (BMI 18.5–24.9 kg/m2) and overweight/obese (BMI ≥25 kg/m2).13 14 Based on research which investigated MUAC cut-offs between 23.5–25 cm as a nutritional surrogate for BMI <18.5 kg/m2 in non-PLMs, we defined undernutrition for non-PLMs as MUAC ≤24 cm.15 For PLMs, mothers with MUAC <23 cm were defined as undernourished; this cut-off is recommended by WHO due to the association of pregnant mothers with MUAC <23 cm and fetal and birth complications.7 12 16 17 We adopted a current practice in humanitarian settings of using the same cut-off for lactating mothers as pregnant mothers as no global cut-offs for lactating mothers exist. Lastly, we reported the percentage of pregnant mothers with BMI <18.5 kg/m2 due to the association of undernourished mothers and fetal complications at birth.18
Children were defined as wasted if they presented with a WHZ <−2, MUAC <12.5 cm and/or bilateral pitting oedema.19 All other children were classified as ‘non-wasted’.
The primary analyses included descriptive statistics and modelling to explore the association between child and mother anthropometric values. Differences in the proportions of wasted children, comparing mothers with and without wasted children, were evaluated using Fisher’s exact tests. Differences in means for anthropometric indices were evaluated via t-tests. Unadjusted Pearson’s correlations were calculated for all paired combinations of mother and child anthropometric values (WHZ and maternal MUAC, child MUAC and maternal MUAC, WHZ and BMI, and child MUAC and BMI). For the correlations evaluating the relationship between child anthropometric indicators and maternal BMI, only non-PLMs were included. Correlations evaluating child anthropometric indicators and maternal MUAC included all mothers.
Four models were fit—two in which maternal MUAC was the primary outcome and two in which maternal BMI was the primary outcome. For each of the four models, multivariable linear regressions were fit, informed by the descriptive analysis and visual exploration of the data. Final models included as predictors a continuous measure of child nutritional status (either WHZ or MUAC) as well as age, parity and gestational status, which have been shown in prior research to impact maternal nutritional status.20 21 Parity was categorised based on the observed distribution in the sample (1–2 children, 3–5 children and >5 children). Models included terms allowing for interactions of maternal age, parity and gestational status. We compared a model allowing for interactions of these terms with child anthropometric measurement (WHZ or MUAC) to a model that kept the relationship between the child and maternal anthropometric indicators constant and did not find meaningful differences in model fit or clinical interpretation. Final models assume a constant relationship between child and maternal anthropometric indicators for all dyads. Inclusion of additional parameters related to child nutritional status (age and sex) was explored given biological plausibility but did not improve model fit, as assessed using analysis of variance (ANOVA) tests and backward stepwise selection. All predictor variables were retained in the multivariable model regardless of significance in univariate models. Model diagnostics including checking for points with high leverage and outliers, and assessing Cook’s distance for each point, were run in R for each of the four models.22 Observations with significantly high leverage or Cook’s distance were removed from the multivariable analyses.23 24
Analysis was conducted using RStudio V.3.6.1.22 Prior to initiation, and continuously during the study, women from the target population presenting to the participating study sites were educated about the study objectives. Feedback from these sessions informed study design and implementation.
Results
Descriptive results
Of the 2288 dyads enrolled, 140 were excluded due to missing age data (n=1) or for age out of range for the mother (n=138) or the child (n=1). An additional six dyads were excluded for implausible or missing gestational or parity data. The final sample for analysis consisted of 2142 dyads (online supplemental figure 1). Of the 2142 dyads in the final sample, dyads with complete anthropometric data for parameters evaluated in each model were as follows: 2082 in the model of maternal BMI and child WHZ (model 1); 2115 in the model of maternal BMI and child MUAC (model 2); 2060 in the model of maternal MUAC and child MUAC (model 3); and 2027 in the model of maternal MUAC and child WHZ (model 4). After excluding values with high leverage and Cook’s distance, final models included 1969 dyads for model 1; 2002 dyads for model 2; 2060 dyads for model 3; and 1904 dyads for model 4.
Supplemental material
Sample demographics for mothers and children are shown in table 1. Children in the sample were predominantly between ages 6 and 23.9 months (76.4%); with a range of 6–52 months and a median age of 14 months. The sample was balanced by child sex (51.8% (1110/2142) female). Only 36.6% (784/2141) of the children were enrolled in supplementary and/or therapeutic feeding programmes. Among children in the sample, 57.5% (1231/2142) were identified as wasted at admission, of which 15 presented with bilateral oedema, 69 were identified as having WHZ <−2 only, 771 had MUAC <12.5 cm only and 376 were identified by multiple indicators.
Demographic characteristics and nutritional status of children aged 6–59 months and mothers aged 19–50 years presenting to Shabelle Health and Nutrition Center, Somalia—November 2019 to March 2020 (n=2142)
The median age for all mothers was 27 years (IQR: 23–30), and 67.1% (1437/2142) of the sample was between 19 and 29.9 years old. The majority of mothers in the sample identified as non-PLMs (64.5% (1383/2142)), followed by pregnant mothers (28.6% (613/2142)) then lactating mothers (6.10% (146/2142)). All PLMs had data on attendance of antenatal care, of whom 93% (706/759) reported attending at least one antenatal care visit. The mean BMI for non-PLMs was 24.68 kg/m2. The most common BMI category for non-PLMs was normal weight at 50.7% (694/1368), followed by overweight/obese at 41.2% (564/1368) and then underweight (BMI <18.5 kg/m2) at 7.95% (110/1368). When MUAC was used to define undernutrition for non-PLMs, the prevalence of undernourished mothers increased fourfold to 32.2% (464/1368). Among PLMs, 20.2% (121/598) of pregnant mothers and 20.0% (27/135) of lactating mothers were undernourished as defined by MUAC. The mean MUAC for PLMs was 25.9 and 26.4 cm, respectively. Among pregnant mothers, 6.07% (37/610) had a BMI <18.5 kg/m2 and less than 1% (4/610) had BMI <16 kg/m2. Of mothers aged <19 years (n=133) who were excluded from the main analysis, 3.8% (5/132) were undernourished as defined by BMI-for-age z-score <−2, and all the undernourished mothers aged <19 years were non-PLMs (online supplemental table 1).
Associations by maternal BMI
Differences in nutritional status comparing mothers with wasted children to mothers with non-wasted children are presented in table 2 (for maternal BMI) and table 3 (for maternal MUAC). Among non-PLMs, mean BMI was significantly lower among mothers with wasted children compared with mothers with non-wasted children (24.43 kg/m2 vs 25.06 kg/m2; p=0.034). However, differences in the proportion of mothers in BMI nutrition categories were not significantly different comparing non-PLM mothers with and without wasted children. While mean BMI was observed to be lower among pregnant and lactating women with wasted children compared with those with non-wasted children, differences were not statistically significant.
Body mass index of mothers presenting to Shabelle Health and Nutrition Center by child nutrition and maternal gestational status—November 2019 to March 2020 (n=2119)†
Mid-upper arm circumference of mothers presenting to Shabelle Health and Nutrition Center by child nutrition and mother gestational status—November 2019 to March 2020 (n=2064)†
Associations by maternal MUAC
Mean MUAC among mothers with wasted children was lower compared with mothers with non-wasted children for women of all gestational status, but results were only significant for pregnant mothers (25.62 cm vs 26.31 cm; p=0.017) and non-PLMs (26.17 cm vs 26.76 cm, p=0.004). Although the differences were significant, the magnitude of the differences observed was relatively small (mean difference −0.69 cm for pregnant women and −0.59 cm for non-PLMs). The proportion of pregnant mothers who were undernourished was higher among pregnant mothers with wasted children than among those with non-wasted children (table 3; 24.0% vs 15.5%, p=0.010). This was also seen for non-PLMs (36.3% vs 26%, p<0.001).
Correlations and modelling
Unadjusted correlations between child and mother anthropometrics were positive but weak associations for all combinations: child WHZ and maternal MUAC (r=0.055); child MUAC and maternal MUAC (r=0.094); child WHZ and maternal BMI (r=0.059); child MUAC and maternal BMI (r=0.056).
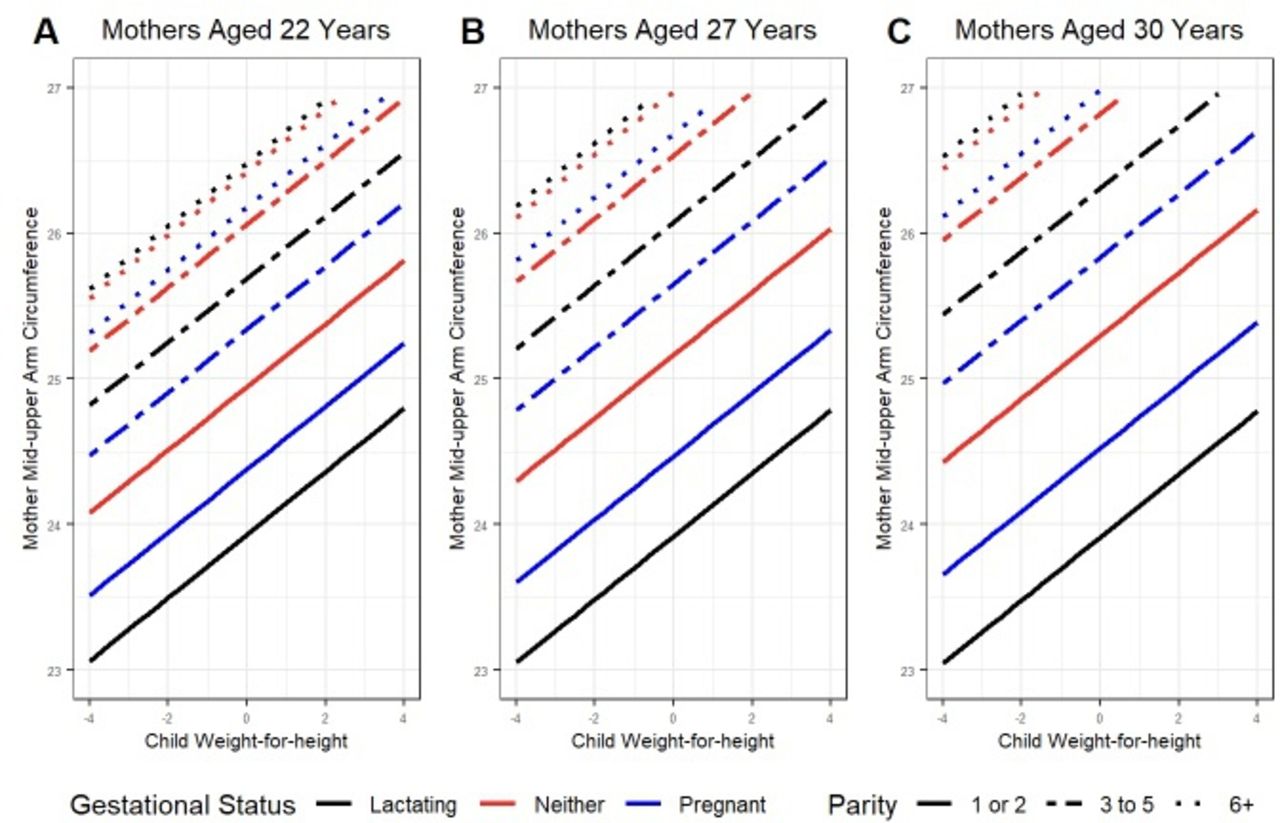
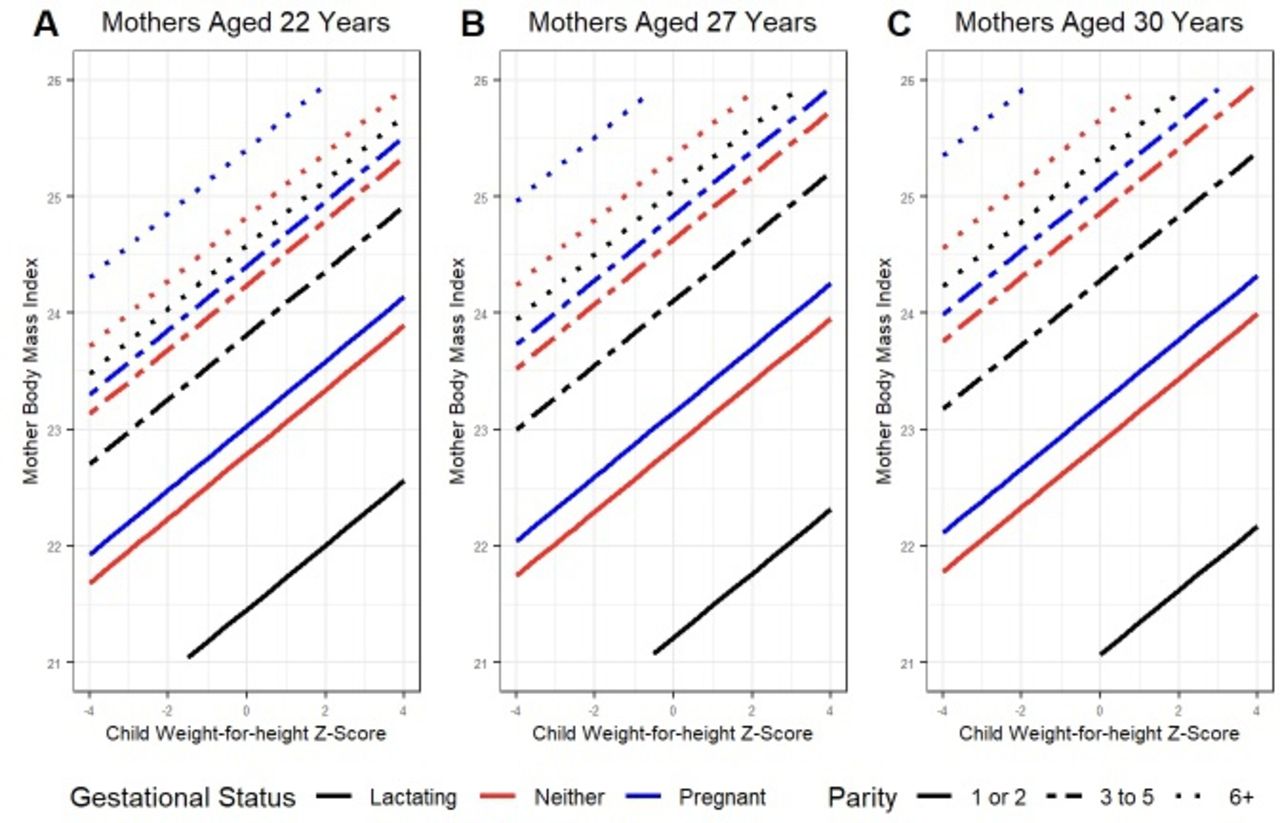
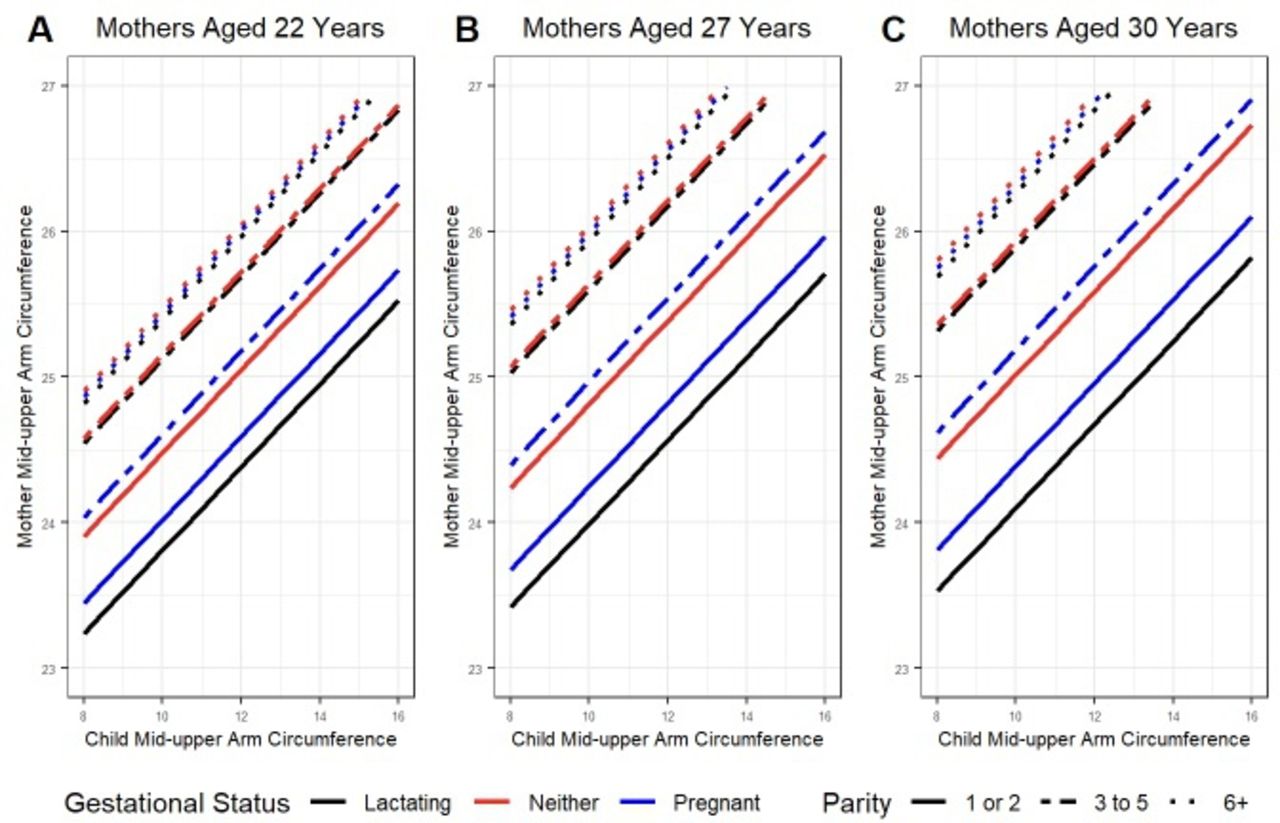
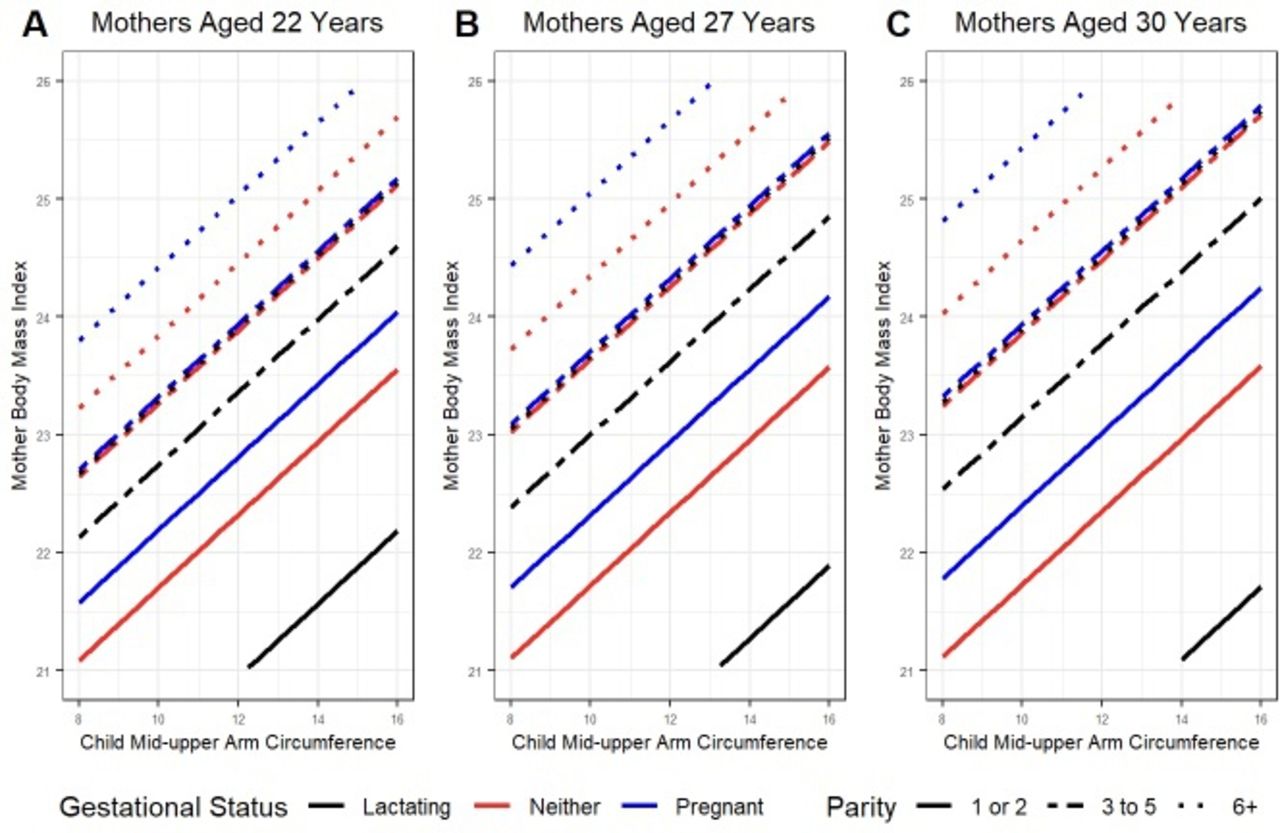
Models estimating maternal anthropometric status given observed child anthropometric status, stratified by gestational status and parity category, are presented in figures 1–4 for models 1–4, respectively. For each figure, panels present estimates for women aged 22, 27 and 30 years (the median, lower and upper quartiles of women included in the sample). In multivariate models adjusting for maternal age, gestational status and parity, maternal and child anthropometric measurements were positively associated (figures 1–4).
Model estimates of maternal body mass index (BMI) given child’s nutritional status by weight-for-height z-score (WHZ) for three mother age categories (shown in panel A, B and C). Colours represent different maternal gestational statuses and line dashes represent different maternal parity categories.

Model estimates of maternal body mass index (BMI) given child’s nutritional status by mid-upper arm circumference (MUAC) for three mother age categories (shown in panel A, B and C). Colours represent different maternal gestational statuses and line dashes represent different maternal parity categories.

Model estimates of maternal mid-upper arm circumference (MUAC) given child’s nutritional status by MUAC for three mother age categories (shown in panel A, B and C). Colours represent different maternal gestational statuses and line dashes represent different maternal parity categories.
Model estimates of maternal mid-upper arm circumference (MUAC) given child’s nutritional status by weight-for-height z-score (WHZ) for three mother age categories. Colours represent different maternal gestational statuses and line dashes represent different maternal parity categories.
Table 4 shows the coefficient and CI for child anthropometric value (WHZ or MUAC) in each of the four models. Maternal BMI increased by 0.22 kg/m2 (95% CI 0.22 to 0.24) and 0.19 kg/m2 (95% CI 0.16 to 0.21) for each one-unit increase in child WHZ and each centimetre increase in child MUAC, respectively. Maternal MUAC increased by 0.20 cm (95% CI 0.18 to 0.22) and 0.24 cm (95% CI 0.23 to 0.25) for each one-unit increase in child WHZ and each centimetre increase in child MUAC, respectively. While associations were significant in all models, the overall fit of the multivariable models assessed via the adjusted R2 value was low (range: 0.06–0.10).
Model estimates, CIs, p values and adjusted R2 for mother and child anthropometric associations*
Holding constant age, gestational status and child anthropometric status (WHZ or MUAC), the average model estimated maternal MUAC increased with each increasing parity category for all mothers (figures 3 and 4, online supplemental tables 2 and 3). Similarly, maternal BMI increased with increasing parity for all mothers (figures 1–4, online supplemental tables 2 and 3). Given modelled interactions, differences in maternal anthropometric status depend on age and gestational status, but generally BMI was approximately 2–4 kg/m2 higher and MUAC was 1–3 cm higher for mothers with a parity of >5 relative to women with a parity of 1–2 (figures 1–4, online supplemental tables 2 and 3). Differences were smaller among women who were non-PLMs.
The relationship between gestational status and maternal BMI varied by anthropometric indicator. Holding parity and age constant, BMI was highest for pregnant women (figures 1 and 2). In contrast, mothers who were non-PLMs had higher MUAC values (figures 3 and 4), except among women with the highest parity in models evaluating differences by child WHZ (figure 4).
Discussion
Our analysis found a consistent, positive linear relationship between child and mother anthropometric indicators based on MUAC, BMI and WHZ. The relationship remained significant when adjusting for confounders such as mother’s age, parity and gestational status in multiple linear regression models. Our results are consistent with previously published literature in Ghana and Ethiopia demonstrating an association between maternal nutritional status, measured by BMI, and the presence of wasting in their children.25–27
Despite an observed, significant correlation, the magnitude of the effects observed was small and the strength of the correlations was weak. For example, for a 22-year-old lactating mother with low parity (one to two children), the model estimated BMI would be 20.35 kg/m2 if her child was severely wasted (WHZ of −4) and 21.46 kg/m2 if her child was non-malnourished (WHZ of 0). Despite this dramatic difference in the nutritional status of the child, spanning half the distribution of plausible child WHZ scores, the estimated nutritional status of the mother remained clinically the same, with BMI being classified as normal weight in both scenarios. Both maternal gestational status and parity had a greater magnitude of effect on maternal anthropometric indicators than child nutritional status. In the above example, if instead of varying the child’s WHZ, the mother’s parity was increased from one to two children to greater than five children, the mother’s expected BMI would be 23.48 kg/m2. The scenario illustrates how increasing maternal parity was associated with a greater increase in BMI (+3.13 kg/m2) compared with changing the nutritional status of the child (+1.11 kg/m2). However, variation in maternal nutritional status was poorly explained by observed covariates even with these parameters included. Future screening tools need to include parity, gestational status, age and child nutritional status; however, including only these parameters is insufficient for a sensitive screening tool for maternal undernutrition. Prior research has shown that a variety of factors affect the undernutrition of Somali children including conflict28 and environmental factors such as household size and seasonality.29 Further work exploring other measurable factors, including those mentioned previously, is needed to develop a more robust yet simple screening tool to identify groups of reproductive age women that can be screened for undernutrition with BMI and/or MUAC in low-resource settings.
While the presented analysis does not support the use of child nutritional status as a simple screening tool for maternal undernutrition, the data suggest value in finding an alternative tool for identifying women outside of pregnancy and lactation. Among non-PLMs, 32.2% (429/1331) were undernourished as defined by MUAC criteria. This is comparable to the percentage of undernutrition seen in pregnant mothers (20.2%) and lactating mothers (20.0%). These non-PLMs would have been missed with current nutritional screening protocols. One unexpected finding was that non-PLM undernutrition as defined by MUAC was on average four times higher than when defined by BMI, the gold standard. Previous literature has supported the use of MUAC as a surrogate for BMI in low-resource settings,15 30 31 yet our data suggest these methods may not always be congruent.
Our sample of mothers and children from Somalia, a population impacted by protracted humanitarian crises, is unique in that it included a large sample of paired mothers and children, and included non-PLMs, a poorly represented population in published nutritional data sets.
The use of a facility-based sample of only mothers aged 19–59 years with children aged 6–59 months is a limitation that impacts the generalisability of these findings to the broader humanitarian and women of reproductive age population. Our sample was recruited from a health facility that provides nutritional services, possibly biasing the sample towards a sicker population. For example, Somalia’s population-based survey of Mogadishu children from October to December 2019 found 16.8% of IDP children and 14.2% of Mogadishu urban children were wasted compared with our facility-based sample of 57.5% of children classified as wasted.32 The study is subject to at least four additional limitations. First, the number of parameters collected was limited to reduce data collection burden during the public health programme’s regular operations. Therefore, unmeasured confounders that could affect the relationship have been left out including biological variables (ie, gestational age or mother comorbidities) and programmatic variables (ie, how long families had been receiving services). Second, the number of lactating and pregnant women in the final sample was small compared with non-PLMs, such that estimates among PLMs may be underpowered. Third, mother weight may have been overestimated as weight was collected fully clothed without weight adjustment potentially resulting in underestimation of undernutrition by BMI. Fourth, despite finding a positive relationship between maternal and child anthropometrics, 40.2% (331/823) of non-PLMs with wasted children were overweight/obese by BMI. Given the finding of high prevalence of overnutrition among mothers, in a context of food insecurity, there remains a need for future work to explore this phenomenon as well as exploring if the positive association persists in populations where the majority of mothers are undernourished.
Conclusion
Consistent with prior research, analysis of data from an outpatient health centre in Mogadishu, Somalia, provides evidence that the nutritional status of children is associated with their mother such that mothers with wasted children on average had slightly lower MUAC and BMI regardless of gestational status. However, while significant, the small magnitude of effect and poor correlation does not support leveraging child nutritional status as an individual screening tool to identify undernourished non-PLMs. An approach of expanding screening to other groups of women of reproductive age would have value given the prevalence of undernutrition among non-PLMs and represents an important area of future work in resource-limited settings.
Data availability statement
Data are available upon reasonable request. The anonymized datasets used and analyzed during the study are available by email request from Mashaka Lewela at mashaka.lewela@savethechildren.org.
Ethics statements
Patient consent for publication
Ethics approval
The project was approved by the Somalia Ministry of Health Research and Ethics Committee in 2019 (reference number: MOH&HS/DGO/0303/Feb/2019). The project was determined to be exempt from human subject’s review by the US Centers for Disease Control and Prevention (CDC). Oral informed consent to participate was obtained from each mother to cover both the mother and her child.
Acknowledgments
We would like to thank the following people who contributed to the data collection and survey design for this project: Meftuh Omer and Nur Ali Mohamoud. Additionally, we would like to thank the volunteers in Somalia who agreed to take part in this survey to better inform future interventions in their communities.
References
Supplementary materials
Supplementary Data
This web only file has been produced by the BMJ Publishing Group from an electronic file supplied by the author(s) and has not been edited for content.
Footnotes
Contributors All authors made substantial intellectual contributions to the study. MV, CH and EL conceptualised and designed the study. MV, CH and AM took responsibility for data collection. RZ and EL analysed and all the authors assisted in interpretation of the data. RZ drafted and finalised the manuscript. All authors critically commented, revised and approved the final version of the manuscript. RZ is the overall guarantor.
Funding The authors have not declared a specific grant for this research from any funding agency in the public, commercial or not-for-profit sectors.
Competing interests None declared.
Provenance and peer review Not commissioned; externally peer reviewed.
Supplemental material This content has been supplied by the author(s). It has not been vetted by BMJ Publishing Group Limited (BMJ) and may not have been peer-reviewed. Any opinions or recommendations discussed are solely those of the author(s) and are not endorsed by BMJ. BMJ disclaims all liability and responsibility arising from any reliance placed on the content. Where the content includes any translated material, BMJ does not warrant the accuracy and reliability of the translations (including but not limited to local regulations, clinical guidelines, terminology, drug names and drug dosages), and is not responsible for any error and/or omissions arising from translation and adaptation or otherwise.