Article Text

Abstract
Low fruit and vegetable consumption is a major modifiable risk factor for raised blood pressure (BP), but it is unknown how heterogeneity in national supply has contributed to BP trends. To address this, we characterised supply trends from 1975 to 2015 and whether it met WHO recommendations. We then examined associations with three metrics: systolic, diastolic and raised BP. We used ecological data on fruit and vegetable supply and on BP for 159 countries. We examined trends in fruit and vegetable supply from 1975 to 2015 by country and World Bank income region. Multivariable linear regression was used to examine cross-sectional associations with BP. Global fruit and vegetable supply increased from 1975 to 2015, but with heterogeneous national and regional trends. While WHO recommendations were met globally, this target was not met in almost half the countries, of which many were low-income countries. Significant associations between combined fruit and vegetable supply and raised BP were observed. Over the past four decades, combined fruit and vegetable supply has been consistently and strongly associated with lower prevalence of raised BP globally. However, the heterogeneous regional trends in fruit and vegetable supply underpin the need for international organisations and individual governments to introduce or strengthen policies for increased fruit and vegetable supply to reduce the burden of non-communicable diseases at national and global levels.
- Blood pressure lowering
- Nutrient deficiencies
Data availability statement
Data are available in a public, open access repository. All data used in these analyses are publicly available.
This is an open access article distributed in accordance with the Creative Commons Attribution Non Commercial (CC BY-NC 4.0) license, which permits others to distribute, remix, adapt, build upon this work non-commercially, and license their derivative works on different terms, provided the original work is properly cited, appropriate credit is given, any changes made indicated, and the use is non-commercial. See: http://creativecommons.org/licenses/by-nc/4.0/.
Statistics from Altmetric.com
WHAT IS ALREADY KNOWN ON THIS TOPIC
While low fruit and vegetable consumption is known to be a major modifiable risk factor for raised blood pressure (BP), it is unknown how heterogeneity in national supply has contributed to BP trends.
WHAT THIS STUDY ADDS
This ecological study shows that global fruit and vegetable supply increased from 1975 to 2015; however, while WHO recommendations were met globally, this target was not reached in almost half the countries studied, of which many are in low-income regions. We also demonstrate significant associations between fruit and vegetable supply and raised BP prevalence.
HOW THIS STUDY MIGHT AFFECT RESEARCH, PRACTICE OR POLICY
Our results underpin the urgent need for national and international policies to expand fruit and vegetable productivity, in order to ensure sustainable fruit and vegetable supply, especially in low-income countries. This, combined with public health programmes targeting fruit and vegetable consumption at the recommended level, are essential to reduce the burden of non-communicable diseases at national and global levels.
Introduction
Cardiovascular diseases (CVDs) are the leading cause of death globally, with elevated blood pressure (BP) and low fruit and vegetable consumption being major modifiable risk factors.1 In 2013, the World Health Assembly set a target of lowering the prevalence of raised BP (RBP)—defined as systolic BP (SBP) of 140 mm Hg or higher or diastolic BP (DBP) of 90 mm Hg or higher—by 25% in 2025 compared with 2010.2 Given the substantial reductions in global age-standardised RBP prevalence between 1975 and 2015, this may be achieved. However, the number of adults with RBP increased from 594 million in 1975 to 1.13 billion in 2015, with heterogeneous trends observed across countries.3
There is strong epidemiological evidence that fruit and vegetable consumption contributes to cardiovascular health through provision of a variety of micronutrients and phytochemicals.4–7 This evidence underpins the WHO recommendation to consume at least 400 g (or five portions) of fresh fruits and vegetables daily.8 Considering the global nutrition transition and resulting heterogeneity in fruit and vegetable supply, it is unknown to what extent this supply and its changes during previous decades may have contributed to the BP trends observed across regions.
Here, we used data on global fruit and vegetable supply and BP to examine trends in fruit and vegetable supply from 1975 to 2015, adherence to WHO guidelines, and whether these trends were associated with changes in levels of SBP and DBP and prevalence of RBP.
Methods
Data
For this ecological study, we used national-level data on food supply from the United Nations Food and Agriculture Organization (FAO), as published in food balance sheets (http://www.fao.org/faostat/en/%23data/FBS; accessed on 11 June 2020), with the most recent data released on 19 December 2019 for the years 1961–2017; detailed information is provided in the food balance sheet handbook.9 Online supplemental appendix table 1 lists individual food items included in the fruit and vegetable groups; the latter includes onions and tomatoes but not potatoes or pulses, for example. We also used supply data for 16 other food groups (animal fats, aquatic products, cereals excluding beer, eggs, fish and seafood, meat, milk excluding butter, offals, oilcrops, pulses, spices, starchy roots, stimulants, sugar and sweeteners, treenuts, and vegetable oils). Data were provided by weight (in units of kg/capita/day) and by total energy (kcal/capita/day). We used BP estimates for adults aged ≥18 years from 1975 to 2015, published by the Non-Communicable Disease Risk Factor Collaboration (NCD-RisC) (http://ncdrisc.org/data-downloads.html; accessed on 11 June 2020), described in detail elsewhere.3
Supplemental material
Potential confounders that may influence associations between fruit and vegetable supply and BP with high-quality data available are body-mass index (BMI), urbanisation and income level. Global and country-level BMI estimates were available from NCD-RisC for adults aged ≥18 years from 1975 to 2016 (http://ncdrisc.org/data-downloads.html; accessed on 11 June 2020).10 Country-level data on urbanisation were obtained from the 2018 Revision of World Urbanization Prospects (https://population.un.org/wup/; accessed on 11 June 2020).11 Country-level classifications of income level for 2019–2020 were available from the World Bank, as were data on life expectancy at birth (https://data.worldbank.org/; accessed on 11 June 2020; https://data.worldbank.org/indicator/SP.DYN.LE00.IN; accessed on 2 August 2020, respectively).
Data preparation
We used data for years in which all data sources were available, which were 1975–2015. Time series were examined for all variables; we excluded countries with discontinuities in the food supply data (Oman, Sudan and the former Yugoslavia), with implausibly low data (Maldives) and with missing data for some food groups (United Arab Emirates). We created complete time series for Belgium, Luxembourg, Czechia, Slovakia and the former USSR as described elsewhere.12 The final list of 159 countries and territories included in our analyses and their World Bank income group classifications are presented in Online supplemental appendix table 2. The NCD-RisC BP data are stratified by sex, so we combined the estimates using data from UN World Population Prospects 2019 (https://population.un.org/wpp/; accessed 11th June 2020). For Dominica and Saint Kitts and Nevis, no population data were available, so we assumed equal weightings.
Statistical analysis
Fruit and vegetable supply quantities were converted to units of 80 g portions/capita/day, which were then normalised using the Nutrient Density method, dividing food supply by the total energy (in units of 1000 kcal/capita/day) provided by the 18 food groups described above (fruits, vegetables and the 16 other food groups), that is, the final data were in units of 80 g portions per 1000 kcal.
Multivariable linear regression was used to examine cross-sectional associations of fruit supply, vegetable supply and combined fruit and vegetable supply with SBP, DBP and RBP prevalence. Regressions were carried out separately for four time periods: 1975–1984, 1985–1994, 1995–2004 and 2005–2015, given known changes in potential confounders such as access to medication and healthcare. Six different models were fitted, which included fixed effects as described in online supplemental appendix table 3. We used the Akaike information criterion13 to choose the best fitting model, as shown in online supplemental table 4. Model 6 was either the best fitting model, or not statistically significantly worse fitting14 than model 4 or model 5, and was selected as the final model. We examined residual plots to ensure that the assumptions for linear regression were met. In addition, we carried out a sensitivity analysis, using the World Bank estimates of life expectancy at birth by country as an additional confounder in all models. We used Bonferroni-corrected significance levels, accounting for fitting 216 models, that is, the p values we reported in table 1 are the nominal p value multiplied by 216, capped at 1.
Multivariate-adjusted regression coefficients and 95% CIs of combined fruit and vegetable supply, fruit supply only and vegetable supply only with SBP, DBP and RBP by time period
Results
Fruit and vegetable supply trends
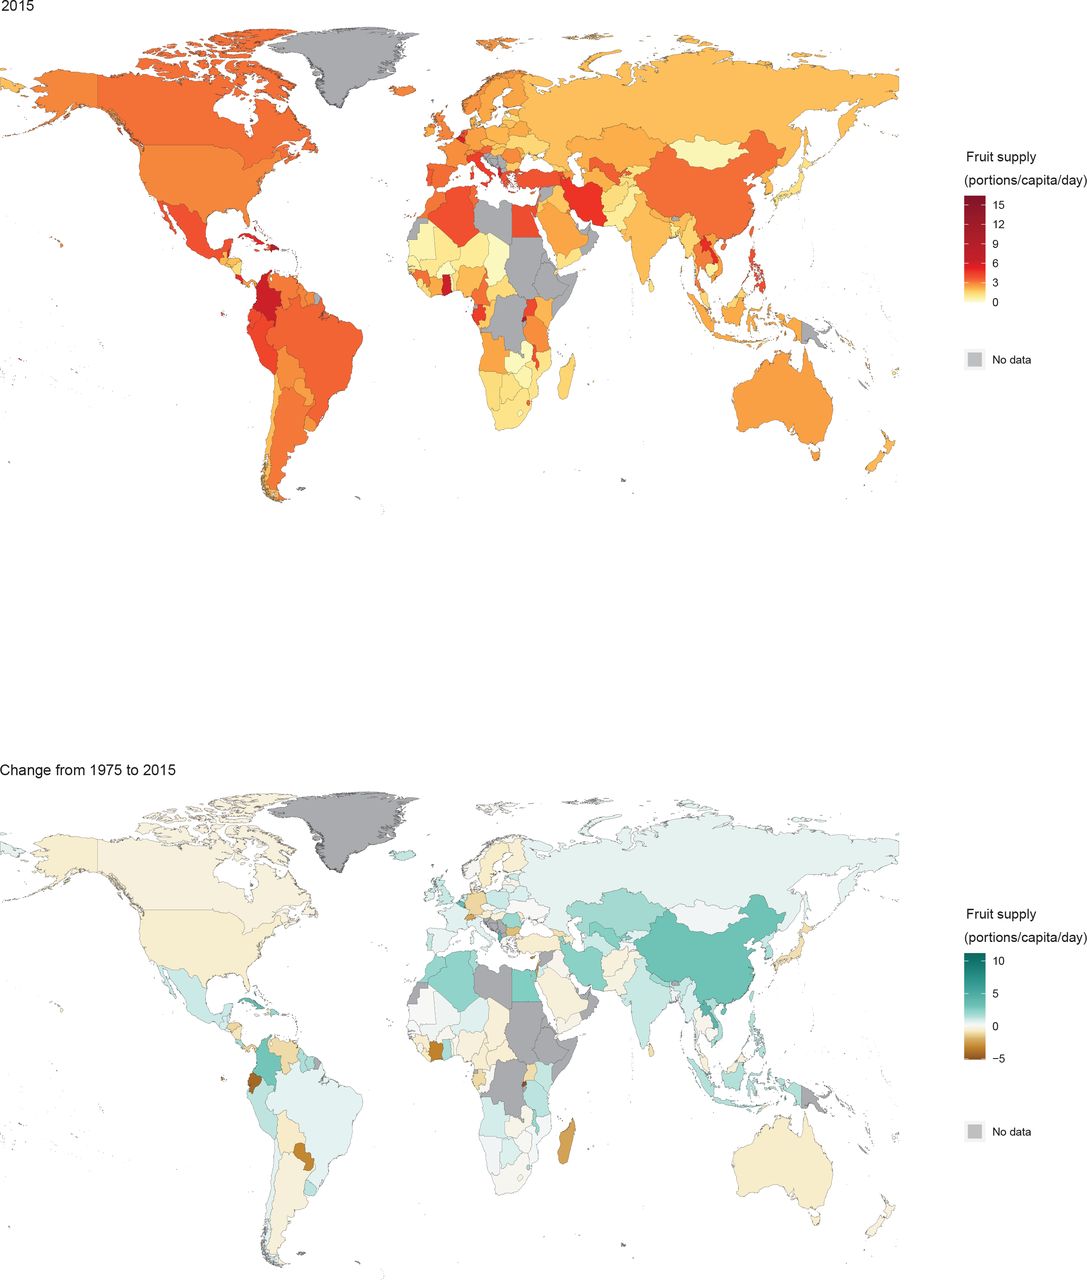
Global trends in fruit and vegetable supply were heterogeneous from 1975 to 2015 by region (figure 1) and country (figures 2 and 3). In 1975, the average fruit supply was almost three portions/capita/day in high-income countries, but only one portion/capita/day in middle-income countries (figure 1). Meanwhile, supply patterns in sub-Saharan Africa were particularly heterogeneous (online supplemental appendix figure 1 and table 5). From 1975 to 2015, global average fruit supply increased by 1.1 portions/capita/day, converging to approximately 2.5 portions/capita/day (figure 1). Fruit supply increased in 95 countries, by 1.6 portions/capita/day on average, and decreased in 64 countries by an average of 0.7 portion/capita/day (figure 2).

Trends in fruit supply and vegetable supply by World Bank region from 1975 to 2015.

Fruit supply by country in 2015 and change from 1975 to 2015. Grey colour indicates that countries were not included in analyses.

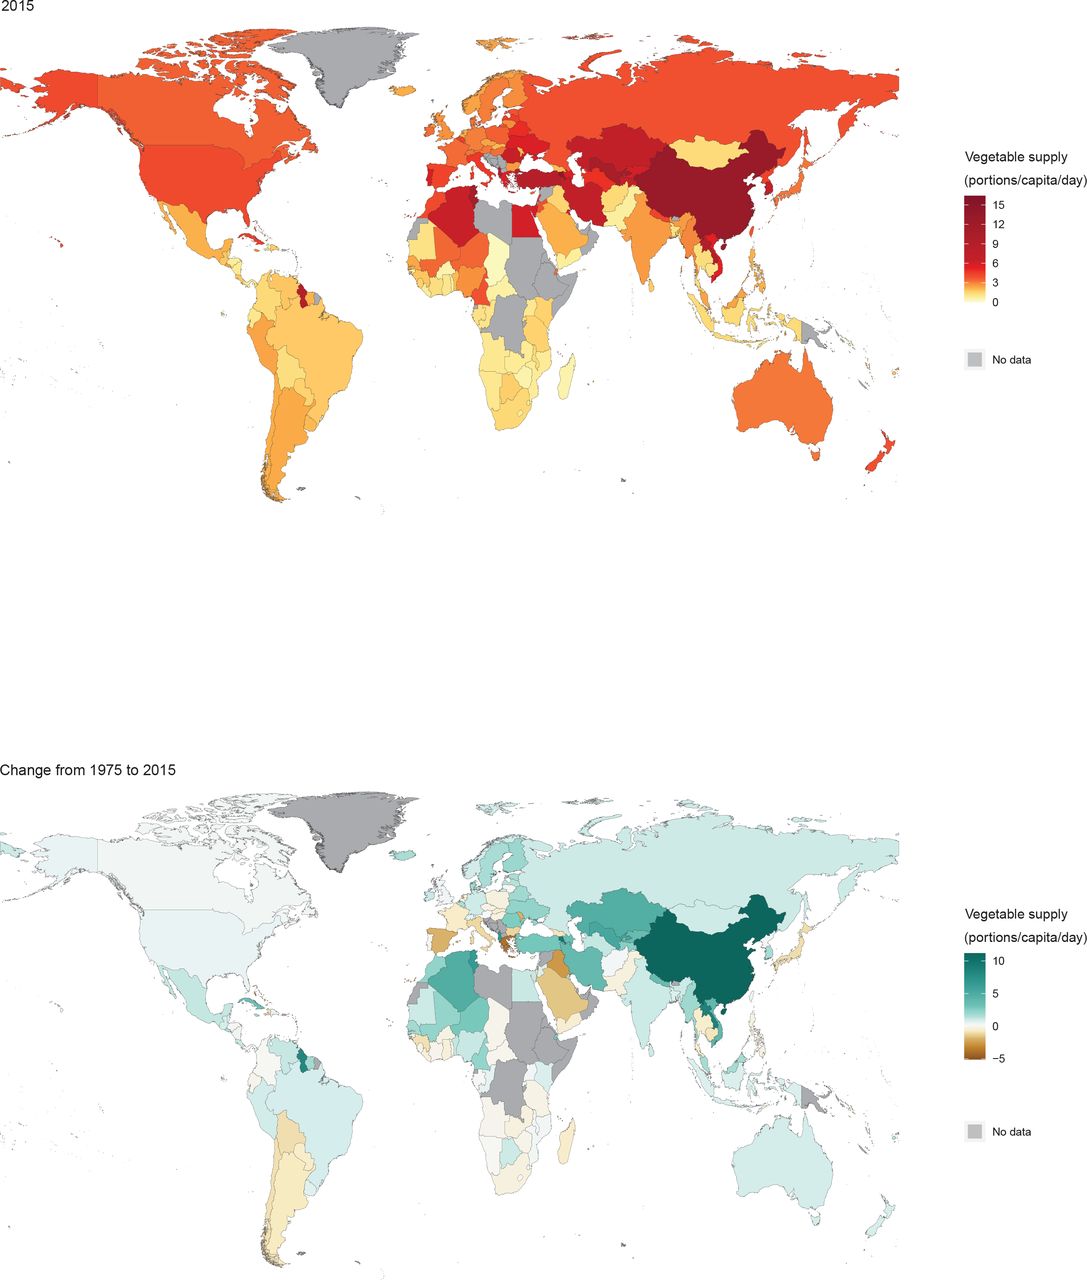
Vegetable supply by country in 2015 and change from 1975 to 2015. Grey colour indicates that countries were not included in analyses.
In 1975, average vegetable supply in high-income countries was almost four portions/capita/day, while elsewhere it was below two portions/capita/day (figure 1). Between 1975 and 2015, global average vegetable supply increased by 2.7 portions/capita/day. Vegetable supply increased in the upper-middle-income region to more than eight portions/capita/day on average, driven by a large increase in supply in China (figure 3 and online supplemental appendix table 6). Vegetable supply increased in 110 countries, by an average of 3.6 portions/capita/day and decreased in 49 countries, by an average of 1.2 portions/capita/day (figure 3).
Globally, the balance between fruit supply and vegetable supply changed modestly over the 41-year period. In 1975, 37% of total supply came from fruits and 63% from vegetables, while in 2015 these values were 42% and 58%, respectively. Proportions at national level are shown in online supplemental appendix figure 2.
Adherence to the WHO recommendation
There was a substantial increase in the number of countries whose fruit and vegetable supply exceeded the WHO recommendation for consumption of five portions per person per day (figure 4). In 1975, only 58 countries met this recommendation. By 2015, eleven diverse countries had dropped below the recommended level, including Japan, Paraguay and Saudi Arabia; 86 countries met the recommendation on average while 73 did not. Countries not meeting the recommendation in either year were mostly in sub-Saharan Africa, south and south-east Asia, and Latin America.

Adherence to WHO recommendation by country in 1975 and 2015. Grey colour indicates that countries were not included in analyses.
Global trends in BP
We calculated population-weighted averages of BP in World Bank regions using the published NCD-RisC data (http://ncdrisc.org/data-downloads.html), described in detail elsewhere.3 Trends from 1975 to 2015 were heterogeneous across regions (figure 5), with a strong and consistent decline in BP in high-income countries. A clear increase was observed in low-income countries, and this region now has the highest levels of BP in the world.
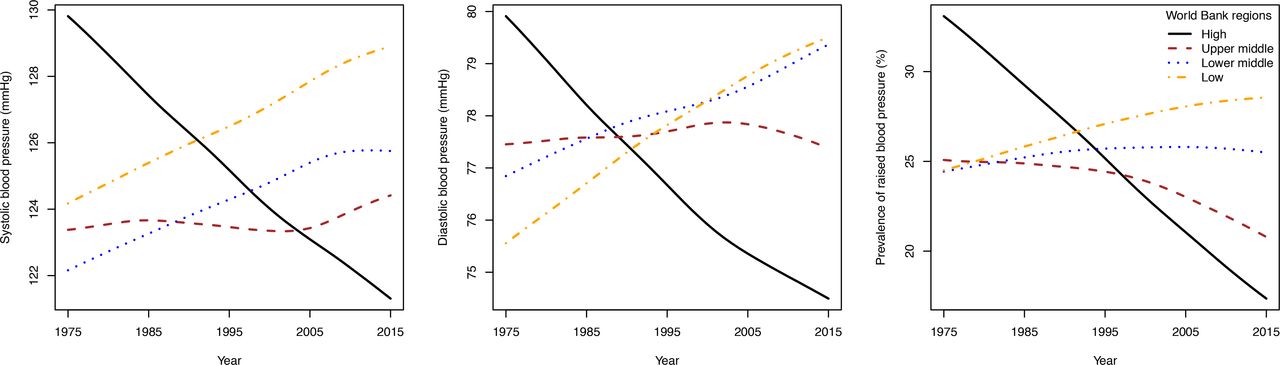
Trends in SBP, DBP and RBP by World Bank region from 1975 to 2015. DBP, diastolic blood pressure; RBP, raised blood pressure; SBP, systolic blood pressure.
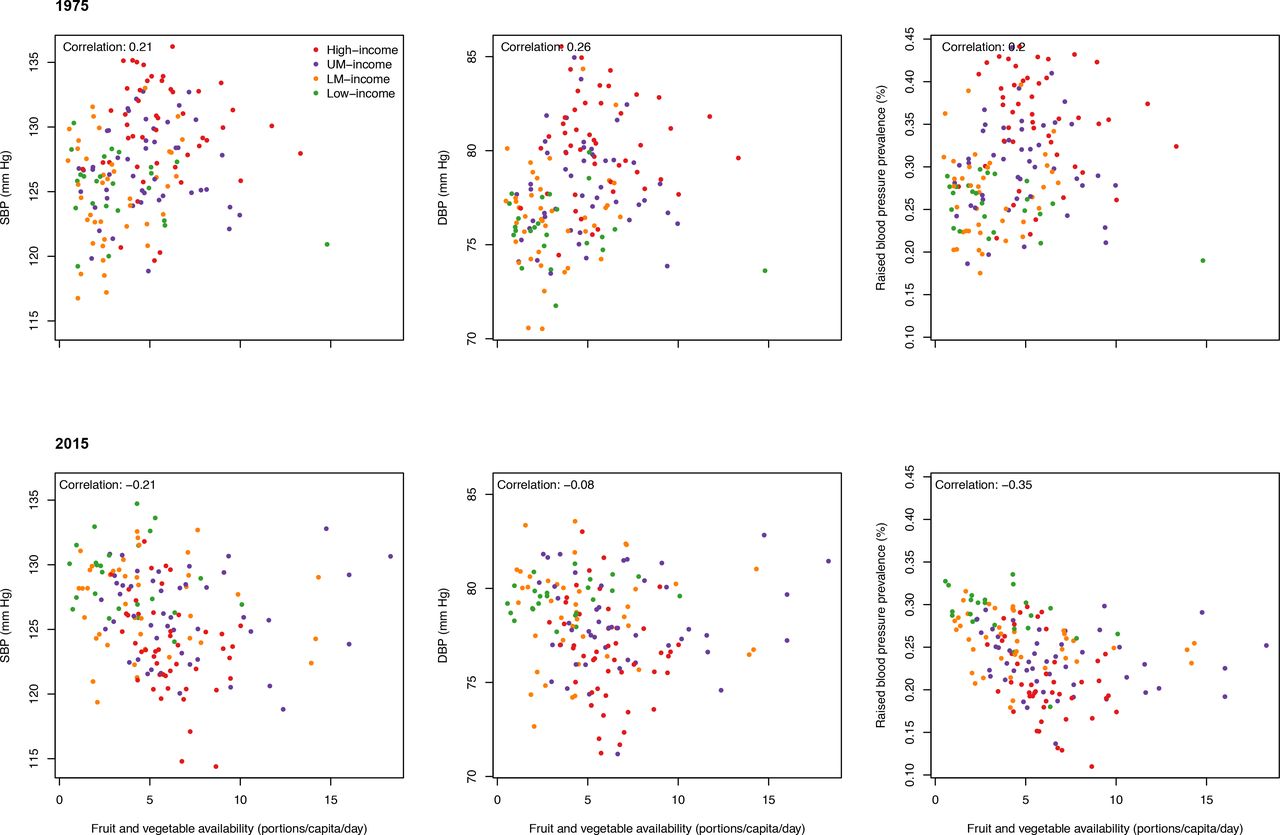
We also examined the relationship between fruit and vegetable supply and BP, which was complex and variable during the analysis period (figure 6), motivating our regression analyses.
Relationships between BP and combined fruit and vegetable supply in 1975 and 2015. Colours indicate World Bank region. BP, blood pressure.
Regression analyses
A key feature of our results is the consistent inverse association between combined fruit and vegetable supply and RBP prevalence (table 1). Our estimates show that for each portion of fruit or vegetable supply per 1000 kcal of intake, RBP prevalence decreased by 1.0–1.5 percentage points (pp). There was also an inverse association between fruit supply and RBP from 1975 to 1994, with each portion/1000 kcal corresponding to a decrease in prevalence of between 1.6 and 2.6 pp. For vegetable supply, there was an inverse association from 2005 to 2015, with each portion/1000 kcal corresponding to a decrease in RBP prevalence of 1.6 pp.
For SBP, an inverse association with combined supply was present from 1975–1994 to 2005–2015 (table 1). These results show that for each portion/1000 kcal, mean SBP decreased by almost 1 mm Hg. From 1975 to 1994, there was also an inverse association with fruit supply, where for each portion/1000 kcal, mean SBP decreased by slightly more than 1 mm Hg. A similar association was present for vegetable supply and SBP from 2005 to 2015. For DBP, the only associations were with fruit supply from 1975 to 1994, with each portion/1000 kcal corresponding to a decrease of less than 1 mm Hg.
Table 2 shows the regression models for combined fruit and vegetable supply and RBP prevalence in detail, including the effects of each portion/1000 kcal described above. The results show that the association between RBP and both urban population proportion and BMI have reversed during the analysis period. In 1975–1984, a more urban population and greater mean BMI were both associated with higher RBP prevalence. However, from 2005 to 2015, it was more rural populations that were associated with higher RBP prevalences, and counterintuitively, higher BMI was also associated with lower RBP prevalence.
Regression coefficients and 95% CIs for each individual variable included in the models of combined fruit and vegetable supply and RBP prevalence
The results for the interaction terms between combined fruit and vegetable supply and World Bank region (table 2) suggest that the effects of supply on RBP were similar across the low-income and high-income regions during the study period, and that a similar effect was also present in the lower-middle-income region from 1975 to 2004. However, the interaction term is in the opposite direction to the main effect for the lower-middle-income region from 2005 to 2015, and in the upper-middle-income group from 1975 to 1994 and from 2005 to 2015, suggesting a weaker or null association in those cases.
Sensitivity analysis
We carried out a sensitivity analysis by including life expectancy as an additional variable in the models as a proxy for overall health status, such as levels of medical care and availability of medication. Results are presented in online supplemental appendix tables 7–9, and showed similar associations after adjustment for life expectancy. Inverse associations between combined fruit and vegetable supply and RBP prevalence remained statistically significant and consistent across the four decades (table 1 and online supplemental appendix table 8). The strong inverse association between fruit supply and RBP prevalence from 1975 to 1994 remained, as well as the inverse association with vegetable supply from 2005 to 2015. However, some of the associations with SBP became non-significant after including this additional variable. As shown in online supplemental appendix table 8, higher life expectancy was inversely associated with RBP prevalence, as would be expected. We carried out a further sensitivity analysis where data for the entire period from 1975 to 2015 were analysed together. As shown in online supplemental appendix table 10, the results are broadly consistent with those presented in table 1, but mask the changes in associations seen over time.
Fruit and vegetable supply composition
There are complex patterns in global production, imports and exports of fruits and vegetables. In 2015 (online supplemental appendix figure 3), fruit production was lowest in northerly countries and in parts of sub-Saharan Africa. Imports were highest in north America, Europe and the Middle East, but were low in much of Africa and in south and east Asia. Exports were highest in parts of Europe and south America, but very low in much of Africa. Vegetable production was highest in China, while imports were high in many similar countries to fruits, and exports were particularly high in much of Europe. Changes from 1975 to 2015 also exhibited complex patterns (online supplemental appendix figue 4), particularly for fruit and vegetable production, where some neighbouring countries have strongly opposing trends (eg, France and Spain). Imports of fruits and vegetables have risen in many high-income countries, while large increases in exports of vegetables have taken place in a number of countries in Europe, but with steep falls in Romania and Bulgaria.
Discussion
In this analysis of ecological data from 159 countries between 1975 and 2015, we found heterogeneous trends in fruit and vegetable supply across the world, and inverse associations between this supply and BP levels: each additional portion/1000 kcal of fruit or vegetable supply was associated with a 1.0–1.5 percentage point lower RBP prevalence in high-income and low-income regions. Global average fruit supply increased by approximately one portion/capita/day over this period, while vegetable supply increased by almost three portions/capita/day, influenced strongly by trends in China. The WHO recommendation of at least 400 g of fruits and vegetables a day (excluding potatoes and other starchy tubers) was met on average globally, but substantial variations in fruit and vegetable supply across the world meant that this target was not met in 46% of the countries in our study, many of which are in low-income regions. The inverse associations between fruit and vegetable supply and BP from this ecological study are in line with findings from previous randomised controlled intervention studies,5–7 and limited observational studies that showed inverse associations between fruit and vegetable consumption and BP,15–19 the risk of developing hypertension20 21 and cardiovascular mortality.4 While most of these studies were from high-income western countries, our findings provide emerging research on the cardiovascular potential of fruits and vegetables in lower income regions.
In 2010, the leading risk factor for chronic disease, especially CVDs, was high BP, which accounted for 7.0% of global disability-adjusted life-years (DALYs) or 9.4 million deaths1; low fruit consumption accounted for 4.2% of global DALYs and low vegetable consumption for 1.5%. Insufficient fruit and vegetable consumption and high BP are worldwide public health concerns, while in recent decades, the highest levels of BP have moved from high-income to low-income regions.3 Despite these trends, inverse associations with RBP were present for fruit supply from 1975 to 1994, and vegetable supply from 2005 to 2015, for both high-income and low-income regions.
High-income countries had generally sufficient fruit and vegetable supply in 1975 and 2015 to adhere to the WHO recommendation,8 in contrast to middle-income regions such as eastern Europe, and low-income regions including south Asia and sub-Saharan Africa. Previous systematic analyses using country-specific dietary survey data have demonstrated that average consumption of fruits and vegetables was substantially below these recommendations22 and that only 10 out of 136 countries had an adequate supply as well as an adequate intake of vegetables.23 These findings suggest that even in countries with adequate supply, public health strategies are crucial to increase fruit and vegetable consumption. In addition, the observed large differences at national level between fruit versus vegetable supply in many Asian and sub-Saharan countries suggest the need to address and target fruit and vegetable supply separately.
Provision of adequate fruit and vegetable supply appears particularly difficult in low-income countries, as most did not meet the WHO recommendation in 2015. In these regions, the cost of fruits and vegetables is high relative to household income, which has previously been associated with lower consumption.24 Furthermore, in these regions there are fewer public health campaigns to encourage higher consumption of fruits and vegetables.25 These countries also generally have warmer climates and less access to refrigeration, leading to more fruit and vegetable supply wastage in the process of harvest, storage, transport, packaging and distribution.26 There are therefore strong disincentives to fruit and vegetable production and an exacerbated gap between availability and recommended consumption of fruits and vegetables.27 This suggests a specific need to develop policies that simultaneously target acute poverty, aim for broad economic growth and prioritise research and development that can expand fruit and vegetable productivity,28 which is often ignored in low-income regions.
Although countries in low-income regions with rising BMI have also seen increasing RBP prevalence,3 our regression models suggested a negative association between BMI and BP in 2015, driven by high-income countries with high BMI levels but low RBP prevalence, although we note that BMI did not appear to be an important confounder in our analyses. This negative association may be caused by high levels of antihypertensive medication use.29
Our study has various strengths. It is a global analysis using the FAO food balance sheets, which provide comprehensive estimates of food supply collected annually using standardised methodologies over four decades for most countries in the world.9 This ensures generalisable comparisons between countries and years compared with combined national dietary survey data with differences in dietary data collection methodologies. Worldwide BP data from the NCD-RisC study is based only on measured BP to avoid bias in self-reported data and estimates were derived via a standardised protocol.3 In addition, we used global life expectancy data as a proxy for overall health status to adjust for factors such as level of medical care and use of antihypertensive medication, which did not affect our results qualitatively.
As with all ecological analyses, our study has some limitations. Some countries had limited or no data available on food supply or BP and so were excluded from the analyses, and unknown biases in the BP and fruit and vegetable data may affect our estimates. Food supply data is for all ages, including children, and allows for all sources of waste, but does not capture fruits and vegetables cropped privately or meals eaten out, suggesting underestimation of consumption.30 Although food balance sheet data describe annual food supply, within-country seasonal variability may have occurred if surveys were not spread out throughout the year and this may not have been fully accounted for. Data on within-country variations in dietary availability patterns and socioeconomic characteristics were not available, and so did not allow country-specific adjustments and assessment of differences in intakes by demographic variables. Finally, considering the ecological nature of this analysis, while we adjusted for important confounders including urbanisation, BMI, socioeconomic status, intake of energy and food groups, and life expectancy, we cannot rule out residual confounding. Well-known potential confounders of the fruit and vegetable–BP relationship with high between-country variation include environmental and lifestyle factors such as smoking, alcohol use, physical activity, (family) history of CVDs, hypertension or diabetes, all of which may further attenuate our findings.
This ecological study has shown that higher fruit and vegetable availability is associated with lower BP globally over several decades. This provides evidence for international organisations and individual governments to introduce or strengthen policies for increasing supply of fruits and vegetables at a global level, with a particular emphasis on low-income countries meeting the minimum WHO recommendation. This has the potential to reduce the burden of NCDs substantially at national and global levels.
Data availability statement
Data are available in a public, open access repository. All data used in these analyses are publicly available.
Ethics statements
Patient consent for publication
References
Supplementary materials
Supplementary Data
This web only file has been produced by the BMJ Publishing Group from an electronic file supplied by the author(s) and has not been edited for content.
Footnotes
LMOG and JB are joint first authors.
Contributors LMOG and JB initiated the study. PM carried out initial analyses and preparation of results. JB carried out data analysis and preparation of the results with input from LMOG and PM. LMOG and JB wrote the paper with input from PM. LMOG and JB are joint authors. JB is responsible for the content of the paper as guarantor.
Funding LMOG: Imperial College Junior Research Fellowship, NIHR Cambridge Biomedical Research Centre (IS-BRC-1215-20014). JB: Royal Society Research Grant (RSG\R1\180086).
Map disclaimer The depiction of boundaries on this map does not imply the expression of any opinion whatsoever on the part of BMJ (or any member of its group) concerning the legal status of any country, territory, jurisdiction or area or of its authorities. This map is provided without any warranty of any kind, either express or implied.
Competing interests None declared.
Provenance and peer review Not commissioned; externally peer reviewed.
Supplemental material This content has been supplied by the author(s). It has not been vetted by BMJ Publishing Group Limited (BMJ) and may not have been peer-reviewed. Any opinions or recommendations discussed are solely those of the author(s) and are not endorsed by BMJ. BMJ disclaims all liability and responsibility arising from any reliance placed on the content. Where the content includes any translated material, BMJ does not warrant the accuracy and reliability of the translations (including but not limited to local regulations, clinical guidelines, terminology, drug names and drug dosages), and is not responsible for any error and/or omissions arising from translation and adaptation or otherwise.